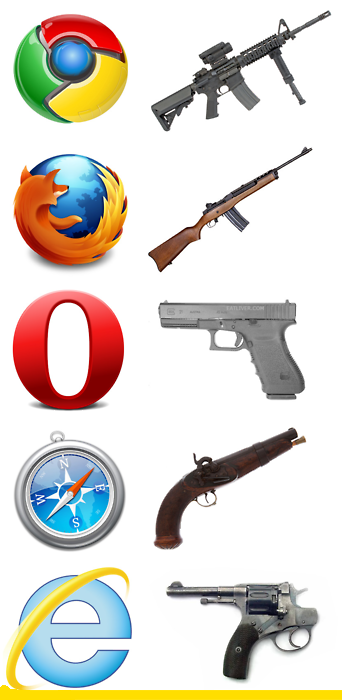
BROWSER & DEBUGGER
- Chrome (*)
- Firefox (*)
- Opera
- Safari
- Internet Explorer
Chrome
- Engine: WebKit (until 27), Blink (based on WebKit, from 28 & beyond).
- Debugger: Dev Tool (integrated)
Firefox
- Engine: Gecko (by Mozilla Foundation and the Mozilla Corporation)
- Debugger: Firefox Developer Tools (intergrated), Firebug.
Opera
-
Engine: Presto
-
Debugger: Opera Dragonfly
Safari
- Engine: WebKit
- Debugger: Web inspector (Integrated)
Internet Explorer
- Engine: Trident (also known as MSHTML)
- Debugger:
- IE (6, 7): ms script debugger, ms script editor, ms visual studio (IE dev toolbar)
- IE (8): developer tools
Firefox - Firebug?
- Easy to use.
-
Many plugin for Firefox browser, and many for firebug too. Ex: Cookies, Dust-Me Selectors, YSlow...
-
Including HTML inspector, js debugger, network tool, DOM inspector...
- Can open extenal editor by "Open with editor" function
- Support lite version for the browser that not support Firebug (as) plugin.
Firebug - Tabs/Panels standard
Firebug - Console panel
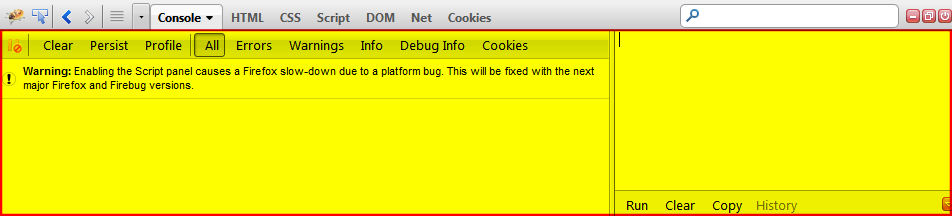
-
JavaScript command line
-
Lists all kinds of messages and offers a profiler for JavaScript commands (including error, warning, debug message...)
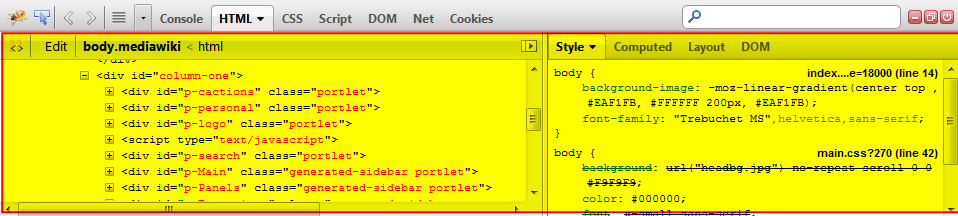
Firebug - HTML panel
-
Displays the generated HTML/XML
-
Right side it shows the CSS styles defined for the currently
selected tag, the computed styles for it, layout information and the DOM
variables assigned to it in different tabs.
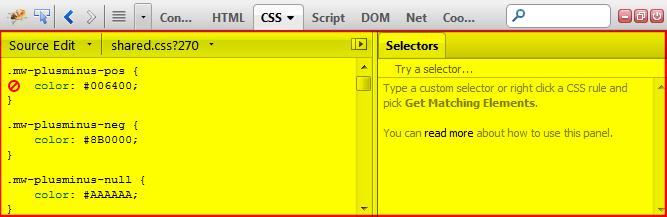
Firebug - CSS panel
-
Manipulate CSS rules (adding, editing and removing CSS styles of the different files of a page containing CSS)
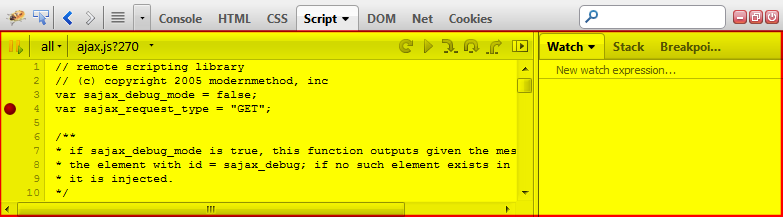
Firebug - Script panel
-
Debug JavaScript code
Firebug - DOM panel
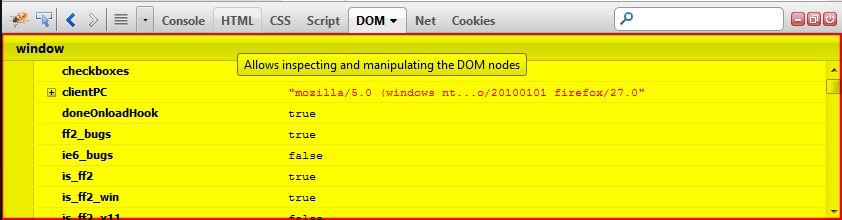
- Information about all the different DOM properties and methods.
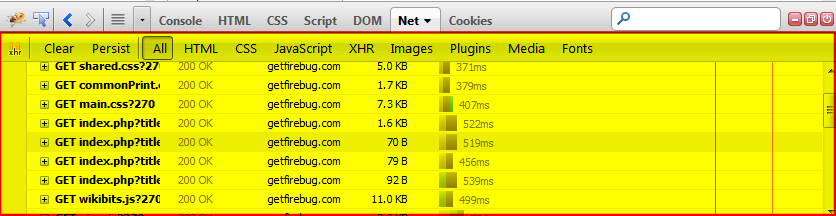
Firebug - Net panel
-
Monitor HTTP traffic initiated by a web page and simply present all collected and computed information to the user.
Firebug - Cookies panel
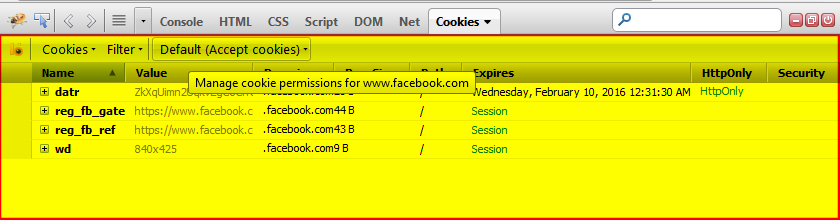
- The Cookies panel allows to display and manipulate cookies set by the current page.
...available since Firebug 1.10 and was formerly a separate extension called Firecookie.
Firebug Lite
-
Compatible with all major browsers: IE6+, Firefox, Opera, Safari and Chrome
-
Same look and feel as Firebug
-
Inspect HTML and modify style in real-time
-
Powerful console logging functions
- Rich representation of DOM elements

Not In Lite
-
Live editing for all panels
-
Layout Side Panel
-
Context menu options
-
Tooltips (to show colors and images)
-
Search feature
-
Javascript debugger / Javascript profiler
-
Net panel / HTTP and XHR monitor
-
Access to restricted URI resources
-
Highlight HTML changes
How to use?
-
Bookmarklet (*)
-
Live link: <script type="text/javascript" src="https://getfirebug.com/firebug-lite.js"></script>
-
Local link: <script type="text/javascript" src="/local/path/to/firebug-lite.js"></script>
(*): (function(F,i,r,e,b,u,g,L,I,T,E){if(F.getElementById(b))return;E=F[i+'NS']&&F.documentElement.namespaceURI;E=E?F[i+'NS'](E,'script'):F[i]('script');E[r]('id',b);E[r]('src',I+g+T);E[r](b,u);(F[e]('head')[0]||F[e]('body')[0]).appendChild(E);E=new%20Image;E[r]('src',I+L);})(document,'createElement','setAttribute','getElementsByTagName','FirebugLite','4','firebug-lite.js','releases/lite/latest/skin/xp/sprite.png','https://getfirebug.com/','#startOpened');
Chrome - DevTools
- Easy to use.
-
Built into Google Chrome (native).
- Mobile environment emulator.
- Many plugin.
- ...the same as Firebug
DevTools - TABS/PANELS
STANDARD
Elements

-
See everything in one DOM tree.
-
Allows inspection and on-the-fly editing of DOM elements.
Console

-
JavaScript command line
- Lists all kinds of messages and offers a profiler for JavaScript commands (including error, warning, debug message...)
Sources Panel

-
Debug javascript
-
Pretty Print javascript for debug
-
View other resources
Network

-
Monitor HTTP traffic
Timeline

- Complete overview of where time is spent when loading and using.
Profiles

-
Profile the execution time and memory usage of a web app or page.
resources

-
Inspect resources that are loaded in the inspected page.
Audits

-
Analyze a page for optimization
Notes
- Some Debugger auto convert CSS Hex-color to RGBA color that support limited by some browser.
- Do not copy HTML for using after from debugger HTML panel/tab.
- Some browser plugin causes problem while debuging or browsing (adblock, G.A analytic tools...).
- Cannot debugging ajax "offline".
devtools
By jhjh