Urban Mobility Models for VANETs
Atulya Mahajan, Niranjan Potnis, Kartik Gopalan and An-I A. Wang
Where we are
-
Random model
-
Flow-based model
-
Traffic models
-
Trace based models
Urban Mobility Models for VANETs
- Limitations and short comings of current models
- Understanding the sensitivity of traffic models to various modelling details
-
Present 3 new models:
- Stop Sign Model (SSM)
-
Probabilistic Traffic Sign Model (PTSM)
-
Traffic Light Model (TLM)
-
Compare these models with previous ones
-
Reason as to take conclusions regarding the sensitivity of traffic models to various modelling details
Limitations of Current Models
- Tend to ignore real-world constraints:
- Street Layouts
- Traffic Signs
- Results in simulations that do not accurately represent the protocol's performance
Factors Affecting Mobility in VANETs
-
Street Layouts
- Well defined paths
- Affects connectivity
-
Block Size
- Determines the number of intersections
- Larger blocks -> more clustering
-
Traffic-control Mechanisms
- Traffic lights, stop signs
- Affects the average speed
-
Independent Vehicular Motion
- Microscopic Models
-
Average Speed
- Rate of network topology change
Stop Sign Model
- Every street at an intersection has a stop sign.
- All the vehicles must stop
- A vehicle is conditioned by the one in front of him
- No overtakings unless considering a multi-lane model
- The model does not illustrate the real world at 100% but it's a good starting point towards understanding the dynamics of mobility and its effect on mobility performance.
Probabilistic Traffic Sign Model (PTSM)
- Refinement of SSM
- Stop signs replaced with traffic lights
- No coordination between traffic lights of different directions
- When a node reaches in intersection
- Stop - red light, probability p
- Continues - green light, probability 1-p
- Cars arriving at a queue wait the time of the previous node plus 1 second (startup delay)
- This model avoids excessive stopping.
Traffic Light Model
- Next iteration of PTSM
- New features:
- Coordinated traffic lights
- Acceleration and deceleration
- Multiple Lanes
- The goal is to "regulate knobs" and find the best way to get relevant results.
PERFORMANCE
EVALUATION
Test Conditions
- NS-2 Simulator
- AODV(Ad hoc On-Demand Distance Vector) routing protocol.
- 100 nodes
- 250m transmission range
- Comparisons
- SSM,
- PTSM,
- TLM, the Random Waypoint Model (RWM)
- Rice University Model (RUM) .
Varying number of nodes
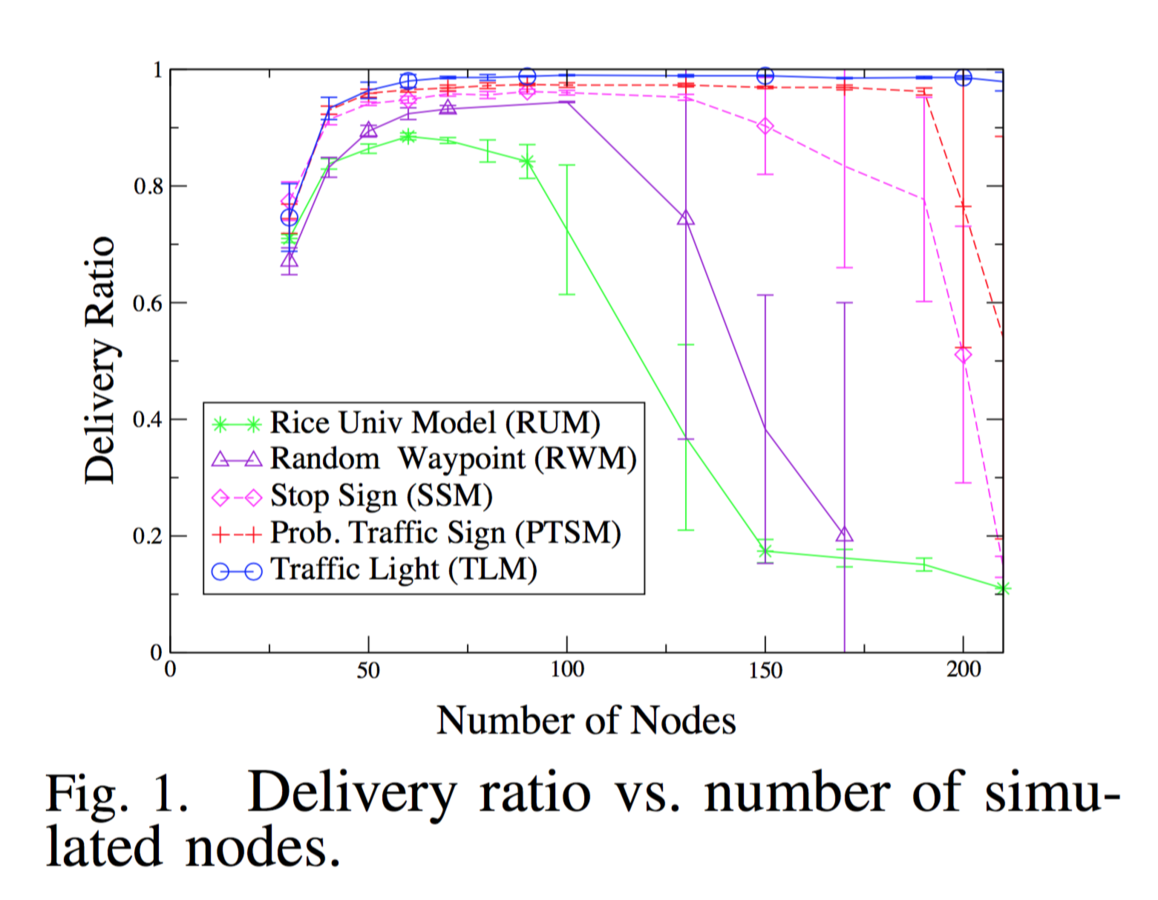
-
The delivery ratio increases with the number of nodes, up to 100 nodes, as the connectivity of the communication graph increases.
-
The delivery ratio starts decreasing as the number of nodes increases further. - Too many control messages
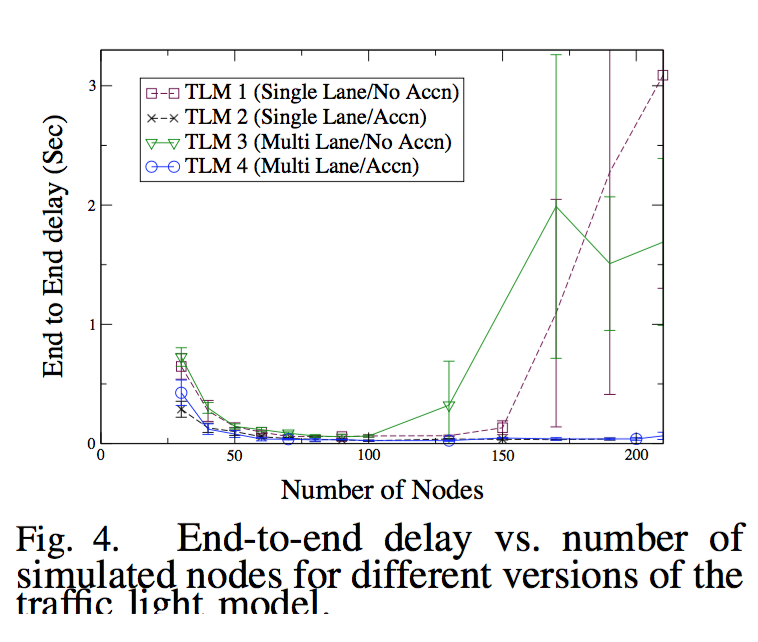
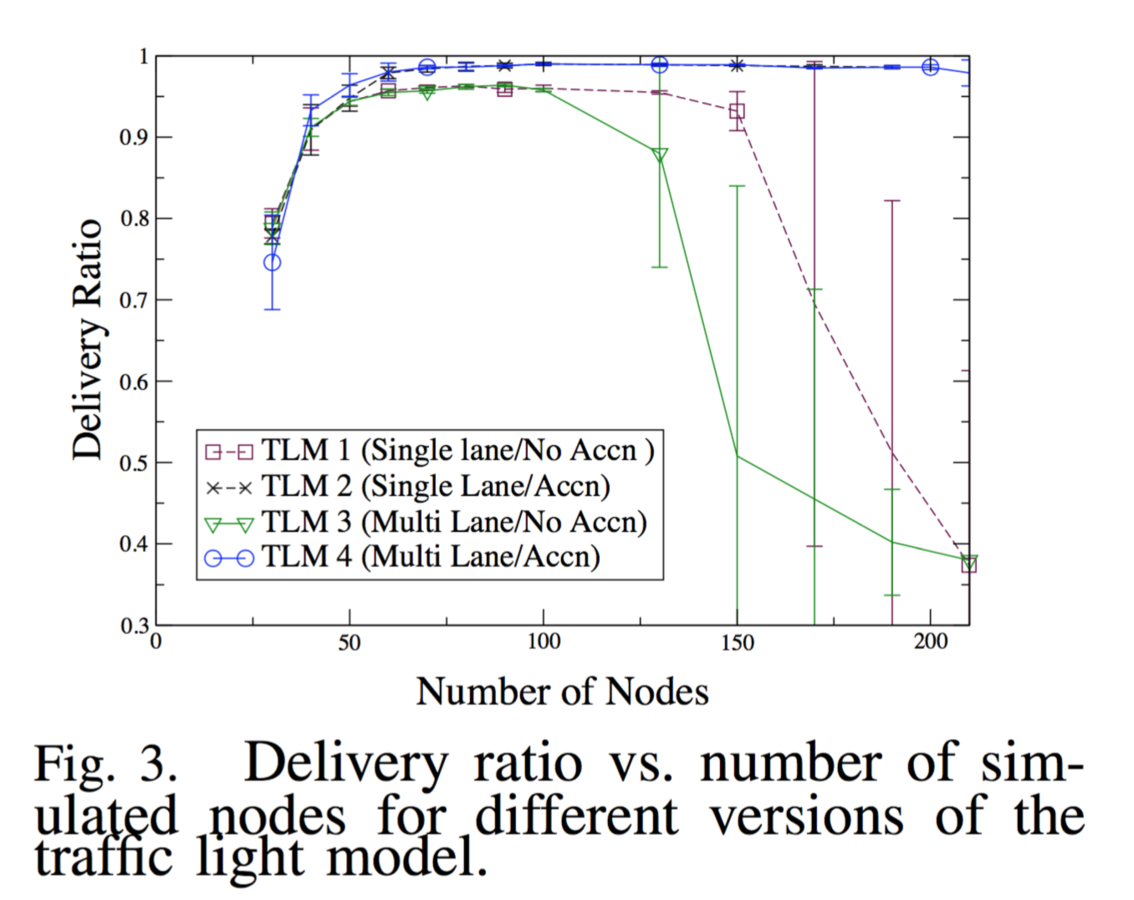
Varying number of nodes
-
Acceleration/deceleration led to a significant increase in the delivery ratio because this feature reduces the average speed of vehicles. -> network routes are more stable.
-
The performance difference between the single-lane and multilane models is not noticeable below 100 nodes.
-
Once the acceleration/deceleration is enabled, the difference between the single-lane and multi-lane models becomes negligible.
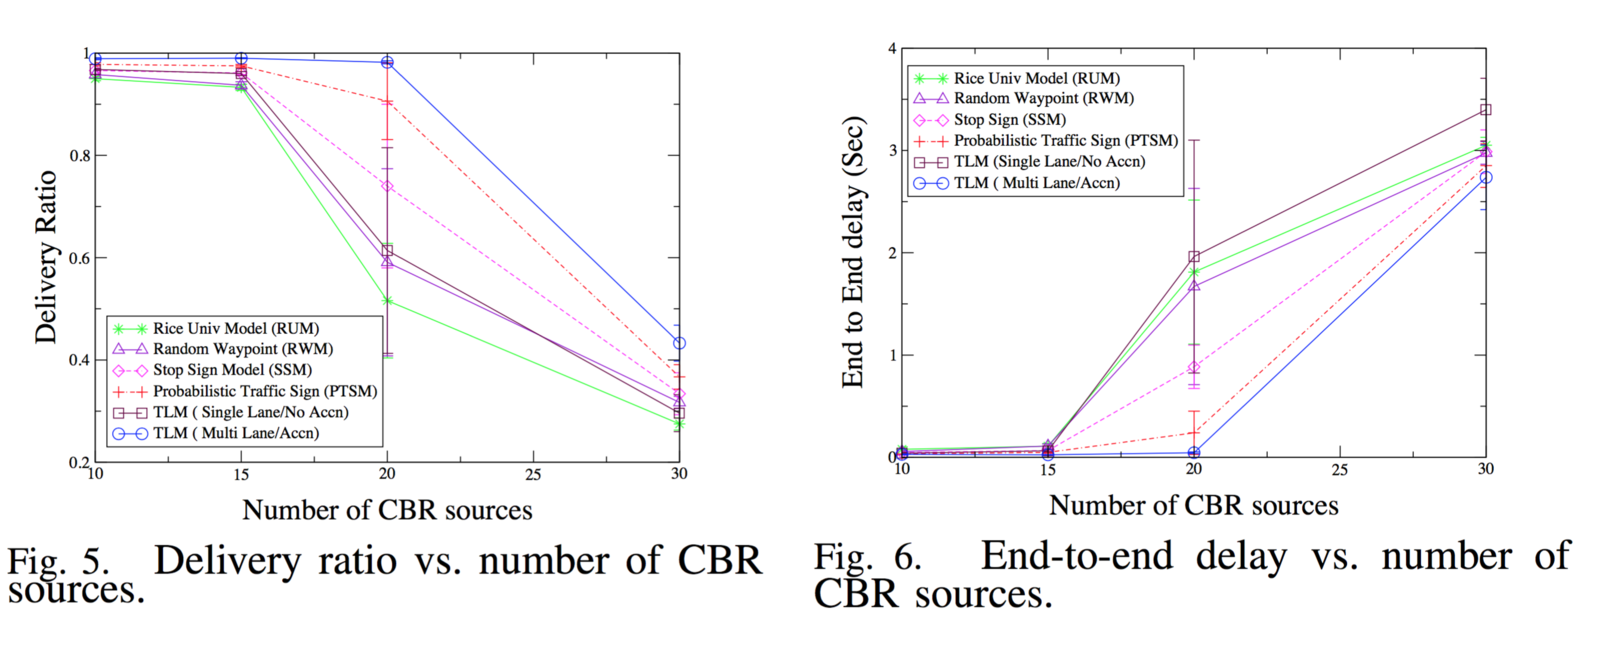
Varying Number of Constant Bit Rate Sources
- When the number of sources increases beyond 15, there is an increase in the end-to-end delay by an order of magnitude and a significant drop in the delivery ratio.
- When the number of CBR sources increases, there is an increase in the number of packets contending for a common wireless channel, which leads to more collisions and packet drops.
- Respecting the speed limit of each road
- Effects are hardly noticeable
Varying Vehicle Speeds
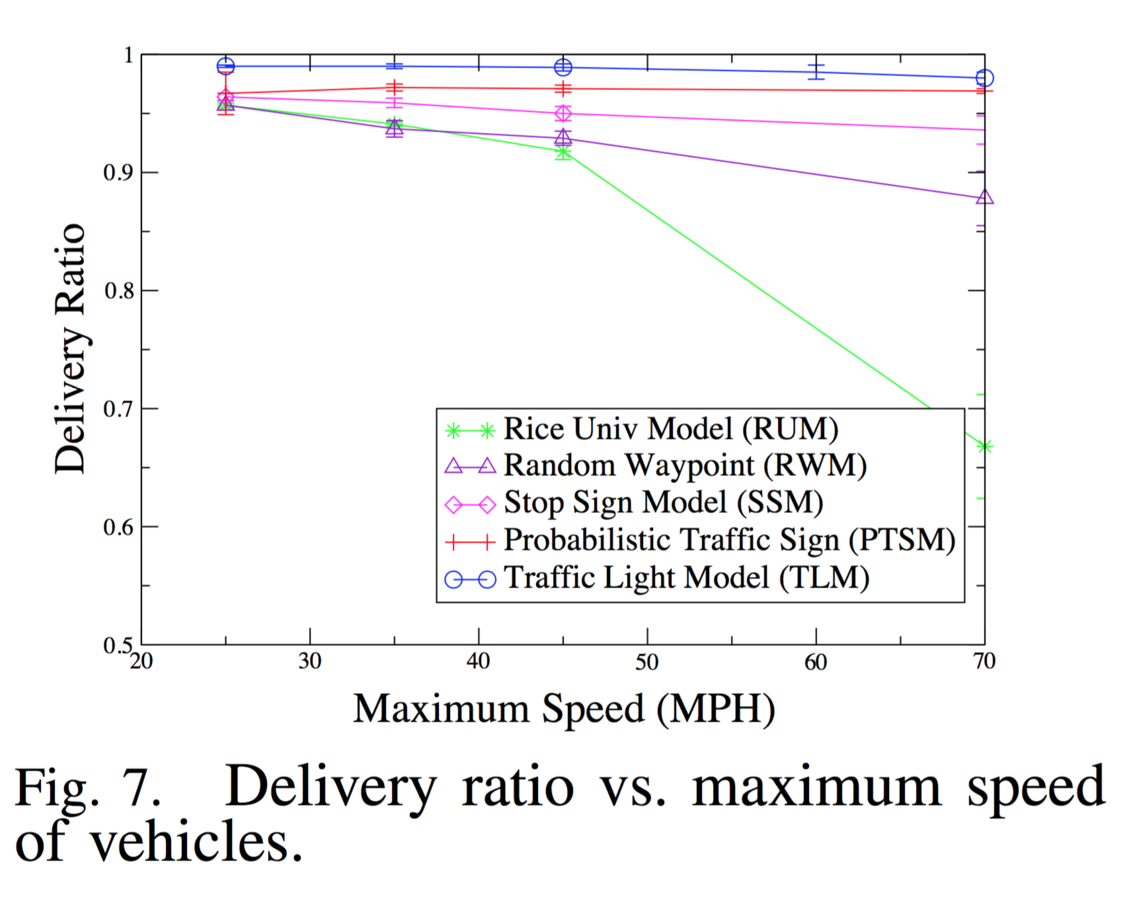
-
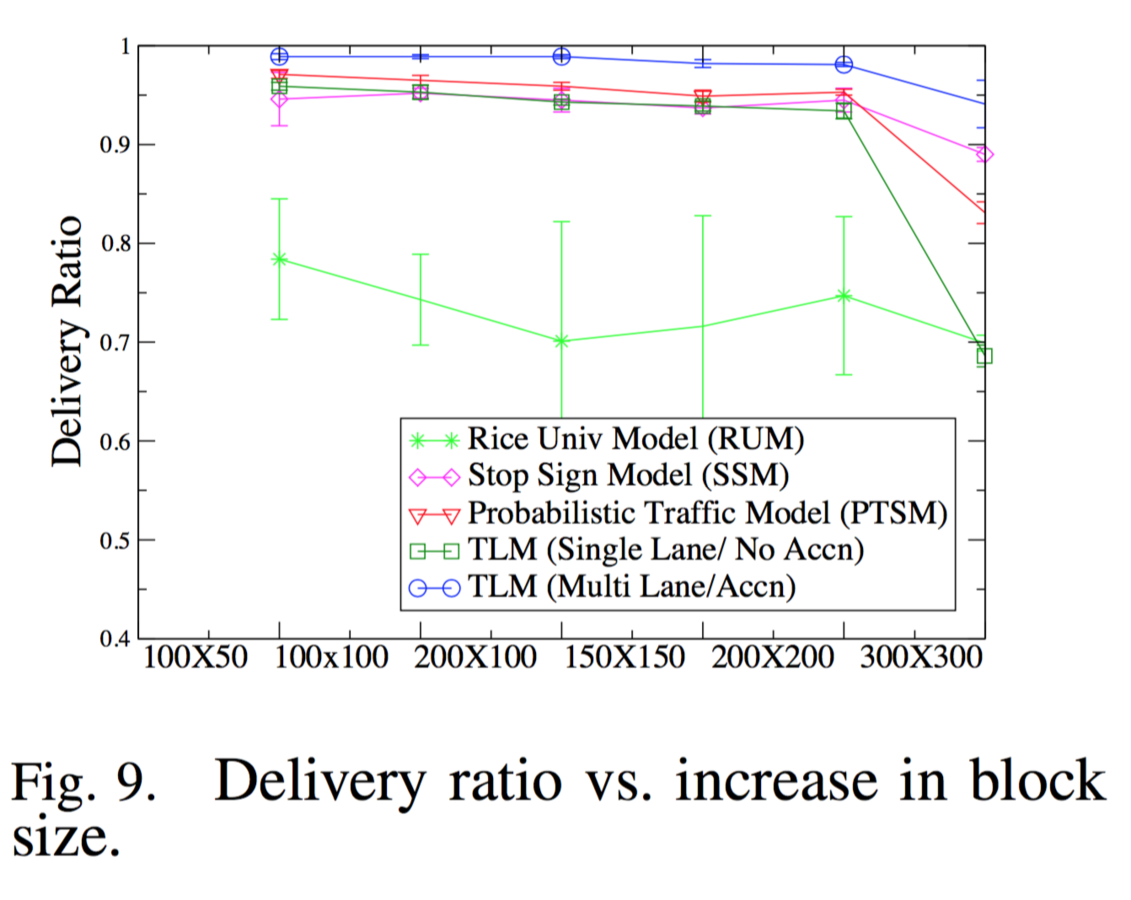
As the block size increases, the delivery ratio decreases.
-
With large block sizes, vehicles spend more time in traversing between intersections; thus, nodes are mobile more often.
-
This increased mobility leads to a weakened connectivity in the network, and a corresponding drop in the delivery ratio.
Effect of Block Sizes
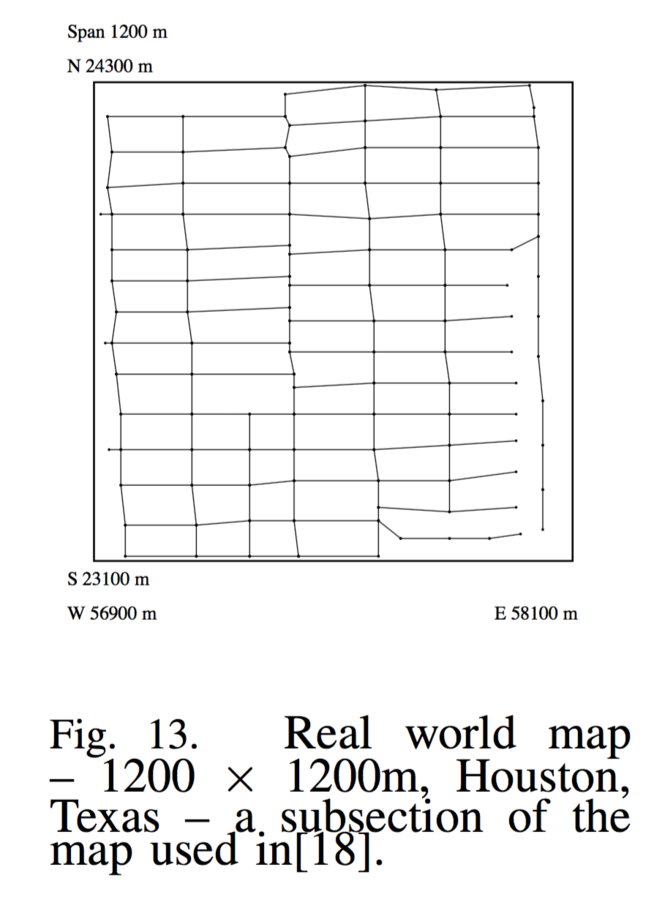
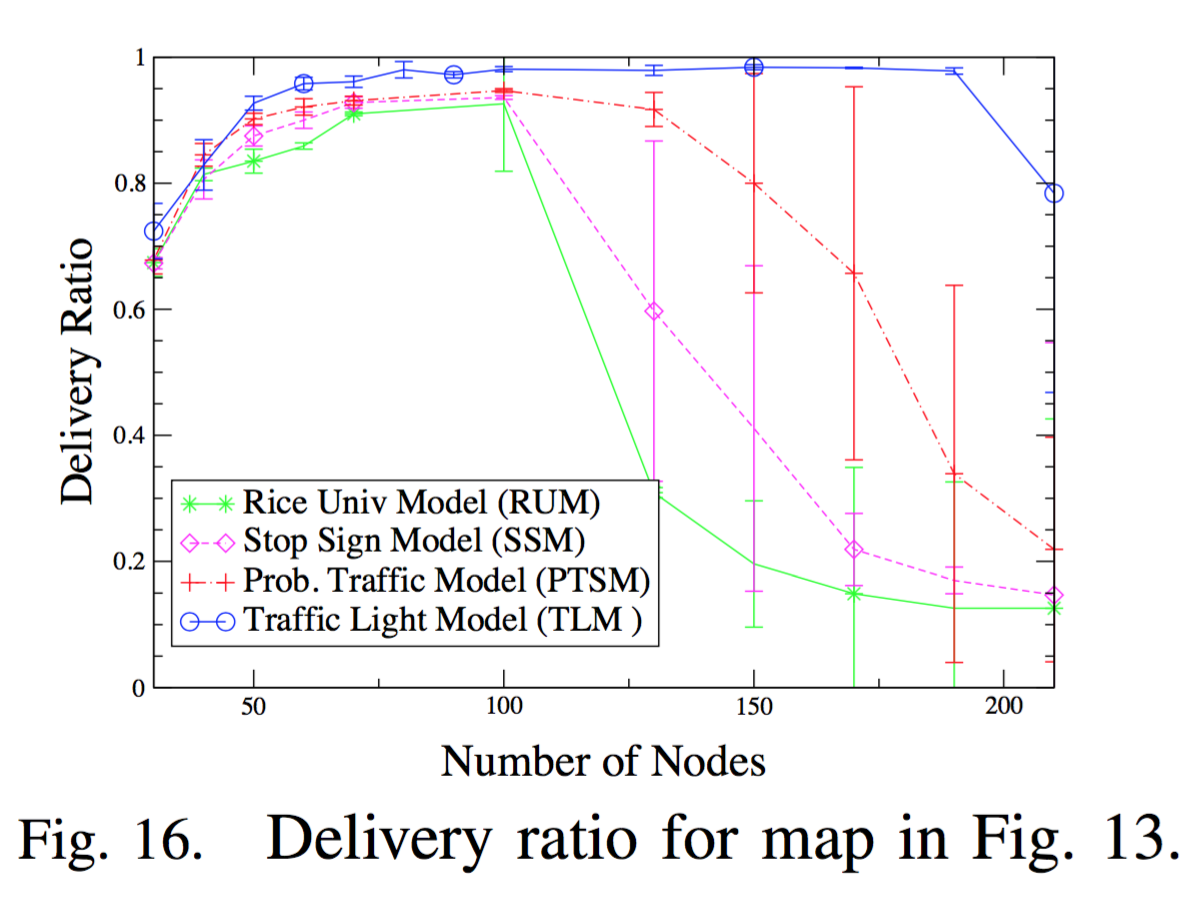
Real Map Results
- The delivery ratio for each model increased with the number of nodes up to 100 nodes, followed by a rapid degradation in performance thereafter.
- However, the performance using TLM remained constant up to almost 200 nodes.
- These results confirm the correlation between topology and mobility, and between the mobility and performance of the simulated VANETs.
Conclusions
- Mobility models play a critical role in accurate simulation of routing protocol performance in Vehicular Ad Hoc Networks (VANETs).
- The authors propose three new but related vehicular mobility models – the Stop Sign Model, the Traffic Sign Model, and the Traffic Light Model
- The clustering effect of vehicles waiting at intersections and acceleration/deceleration of vehicles are significant factors that affect the delivery ratio and packet delays in VANETs.
- The simulation of multiple lanes and coordinated traffic lights has only a marginal impact on the ad hoc routing performance.
My thoughts
- Bullet One
- Bullet Two
- Bullet Three
Urban Mobility Models for VANETs
By João Santos