Mapping with Carto
The fundamentals
@JacopoOttaviani


- Interactive (clickable, zoomable)
- Diverse (there are 6+ types of maps)
- Dynamic (change dataset > change map)
- Replicable (easy to duplicate a map)
- Embeddable (you can include them in your story)
Carto maps are:
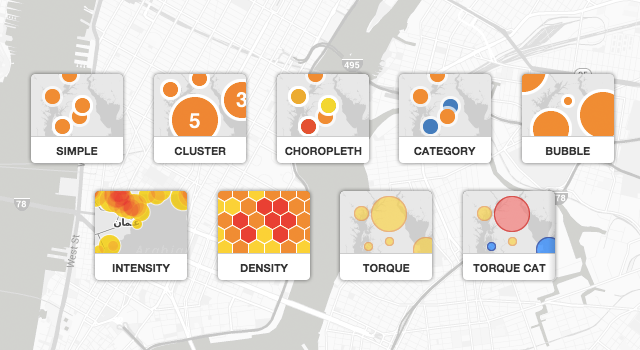
Types of map

In the new CARTO interface,
aggregation is the new wizard.
We will learn how to:
- Load and modify your dataset on Carto
- Georeference it (as long as it has a valid location column)
- Play with Carto's interfaces
- Set up info-windows and make categories maps
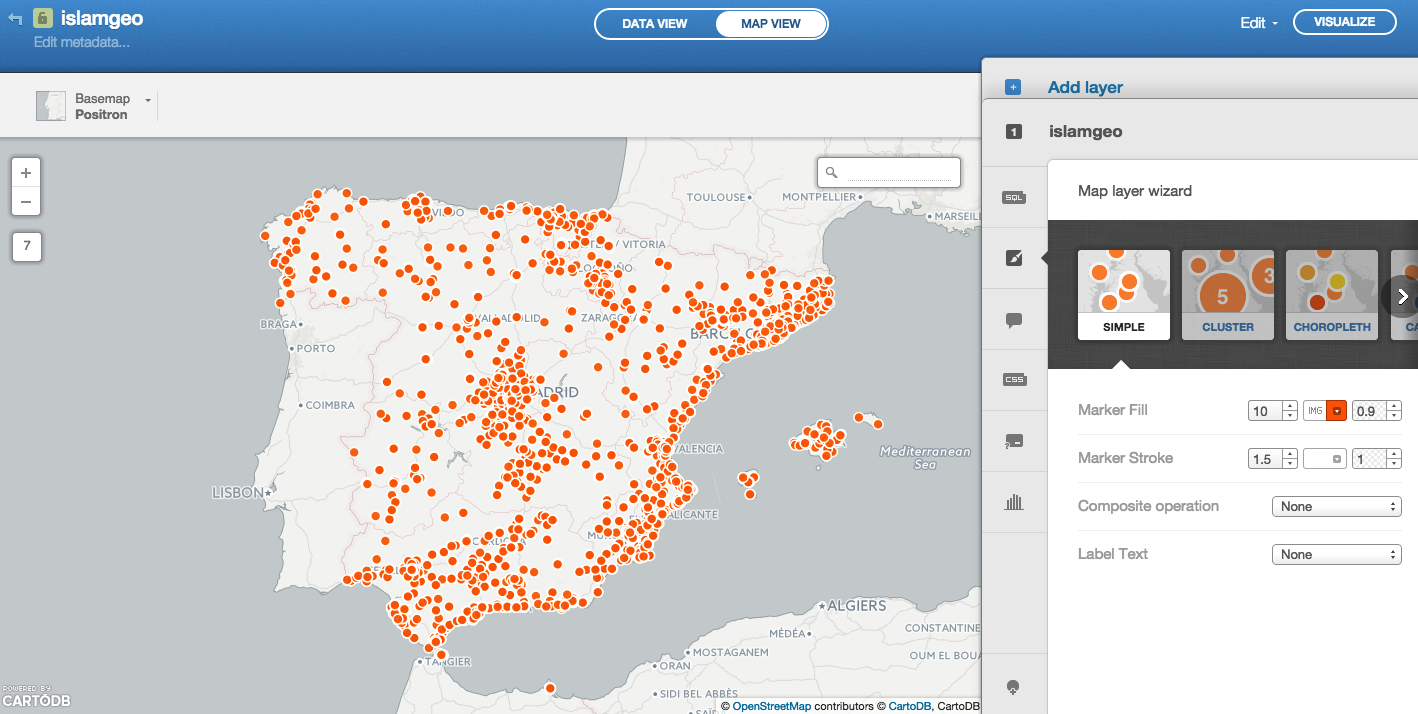
- Visualise it on a simple interactive (working) map
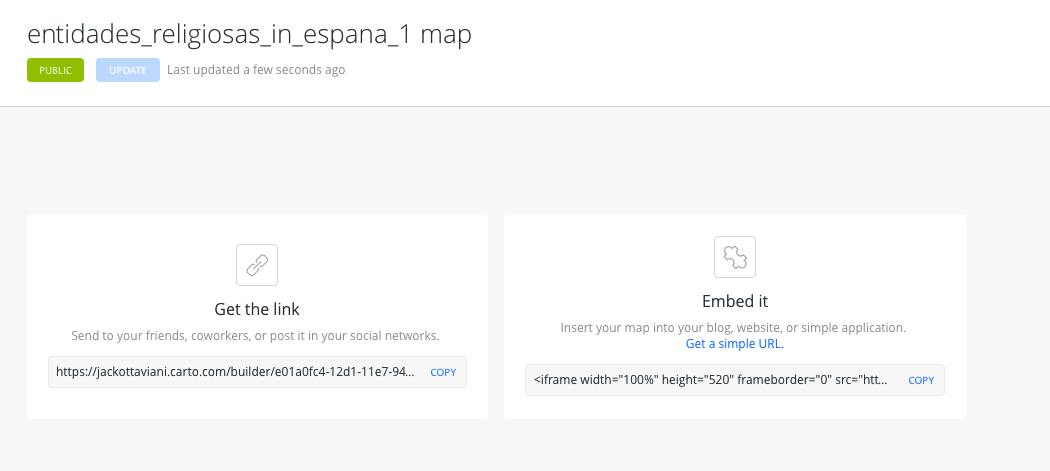
- Take the embed code to integrate the map into our story
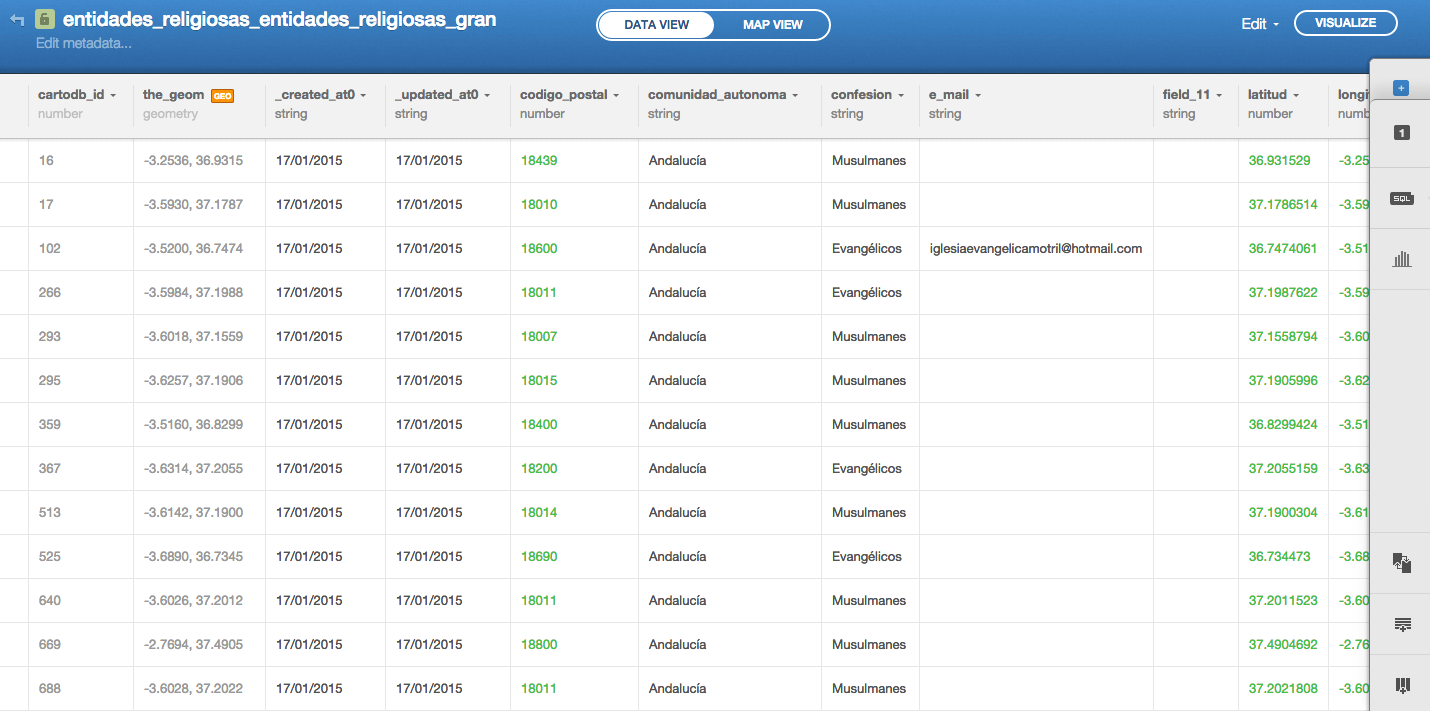
First of all: the dataset
Open Carto and load a dataset: http://bit.ly/entidades-religiosas-espana
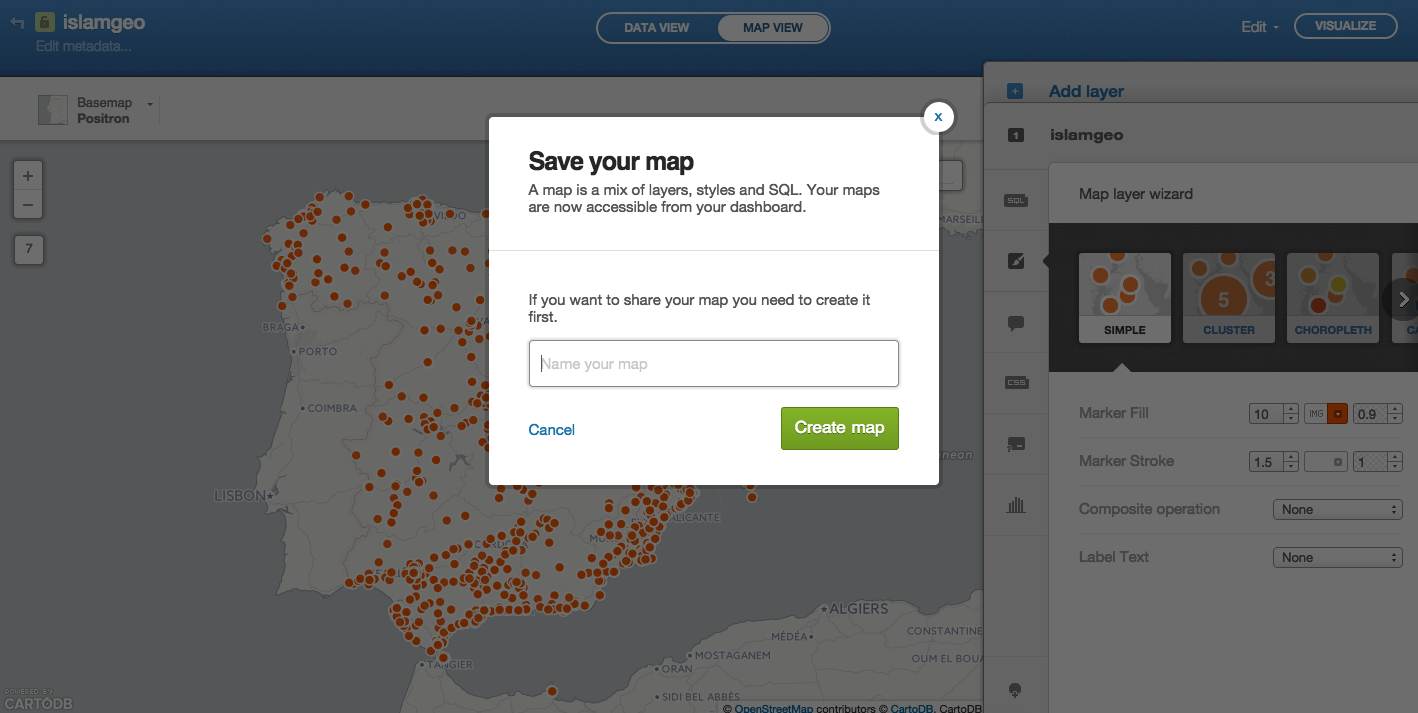
First steps with Carto
- Two modalities: data view, map view
- One dataset can generate 1+ visualisations
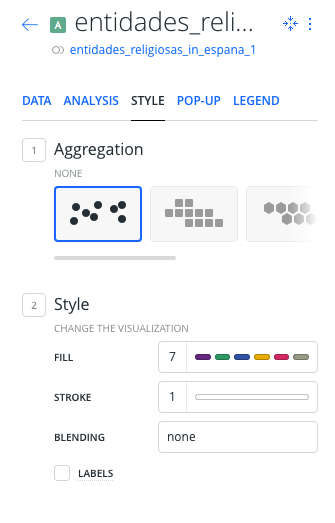
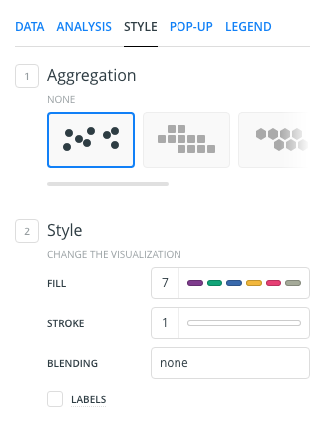
Infowindow
Wizards/Aggregation

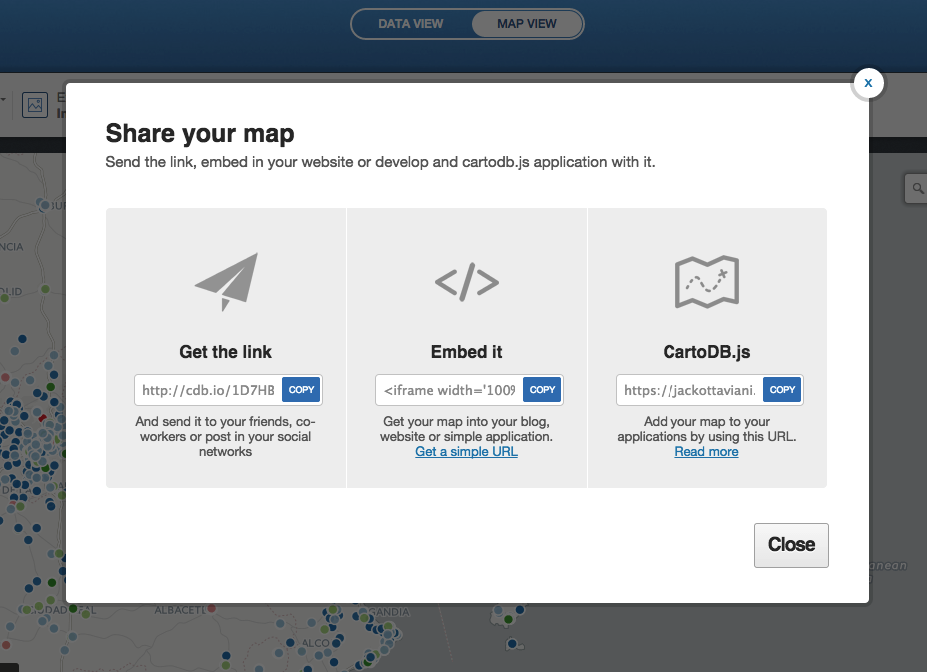
Publication (button: SHARE)
Questions?
Now, feel free to play around

Exercise #2. Make your first map
Delete dataset and visualisation, re-upload it and re-make the whole process from scratch.
Objectives:
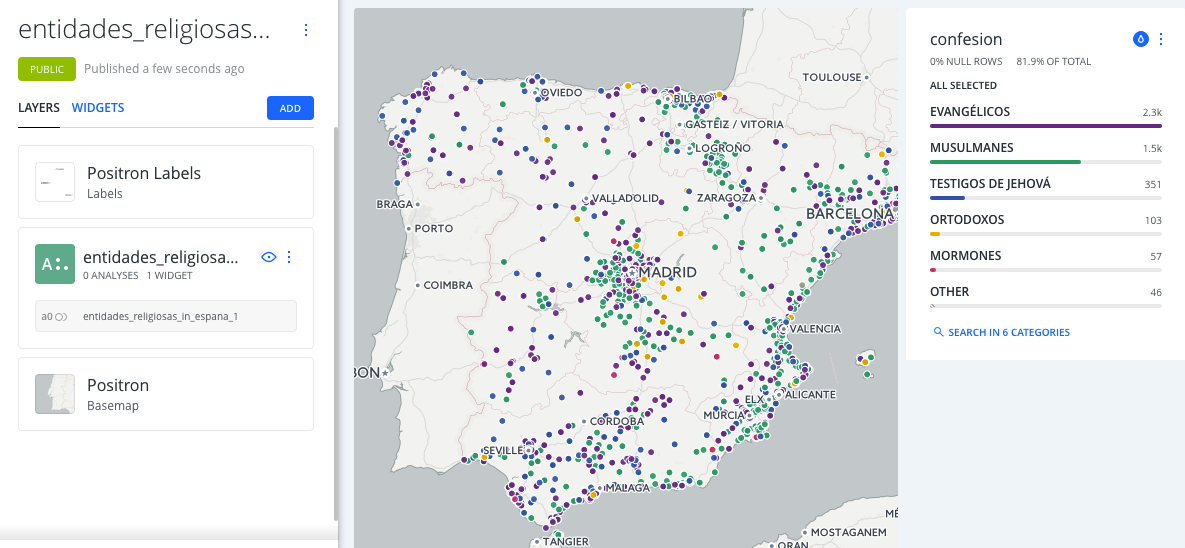
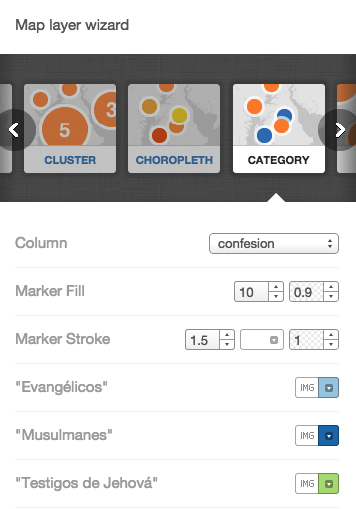
- Make a «category map» showing the religious entities in Spain.
- Select the right category column
- Play with colours, marker size and stroke, filters
- Configure the info-windows (exclude data you don't want to show to the final user)
- Publish the map and get the embed code
#2 - Simple maps on Carto
By jottaviani


