


Karl Ho
Data Generation datageneration.io
Karl Ho
School of Economic, Political and Policy Sciences
University of Texas at Dallas
2. Harvard
Certain assignments in this course will permit or even encourage the use of generative artificial intelligence (AI) tools, such as ChatGPT. When AI use is permissible, it will be clearly stated in the assignment prompt posted in Canvas. Otherwise, the default is that use of generative AI is disallowed. In assignments where generative AI tools are allowed, their use must be appropriately acknowledged and cited. For instance, if you generated the whole document through ChatGPT and edited it for accuracy, your submitted work would need to include a note such as “I generated this work through Chat GPT and edited the content for accuracy.” Paraphrasing or quoting smaller samples of AI generated content must be appropriately acknowledged and cited, following the guidelines established by the APA Style Guide. It is each student’s responsibility to assess the validity and applicability of any AI output that is submitted. You may not earn full credit if inaccurate on invalid information is found in your work. Deviations from the guidelines above will be considered violations of CMU’s academic integrity policy. Note that expectations for “plagiarism, cheating, and acceptable assistance” on student work may vary across your courses and instructors. Please email me if you have questions regarding what is permissible and not for a particular course or assignment.
3. Carnegie Mellon University
You are welcome to use generative AI programs (ChatGPT, DALL-E, etc.) in this course. These programs can be powerful tools for learning and other productive pursuits, including completing some assignments in less time, helping you generate new ideas, or serving as a personalized learning tool.
However, your ethical responsibilities as a student remain the same. You must follow CMU’s academic integrity policy. Note that this policy applies to all uncited or improperly cited use of content, whether that work is created by human beings alone or in collaboration with a generative AI. If you use a generative AI tool to develop content for an assignment, you are required to cite the tool’s contribution to your work. In practice, cutting and pasting content from any source without citation is plagiarism. Likewise, paraphrasing content from a generative AI without citation is plagiarism. Similarly, using any generative AI tool without appropriate acknowledgement will be treated as plagiarism.
4. UTD (some courses)
Cheating and plagiarism will not be tolerated.
The emergence of generative AI tools (such as ChatGPT and DALL-E) has sparked large interest among many students and researchers. The use of these tools for brainstorming ideas, exploring possible responses to questions or problems, and creative engagement with the materials may be useful for you as you craft responses to class assignments. While there is no substitute for working directly with your instructor, the potential for generative AI tools to provide automatic feedback, assistive technology and language assistance is clearly developing. Course assignments may use Generative AI tools if indicated in the syllabus. AI-generated content can only be presented as your own work with the instructor’s written permission. Include an acknowledgment of how generative AI has been used after your reference or Works Cited page. TurnItIn or other methods may be used to detect the use of AI. Under UTD rules about due process, referrals may
be made to the Office of Community Standards and Conduct (OCSC). Inappropriate use of AI may result in penalties, including a 0 on an assignment.
Using generative AI may not save time, but will improve quality and deepen thought process.
As a “language” for the eye, graphics benefits
from the ubiquitous properties of visual perception. "
- Jacques Bertin
Data Literacy
Understand data theory
Manage data
Analyze data
Data Skills
Programming
Tools
Source: Yau 2011
Understand data theory
Be familiar with principles behind effective data visualization
Read complex data through educated reviews
Communicate message in data effectively using advanced visualization techniques
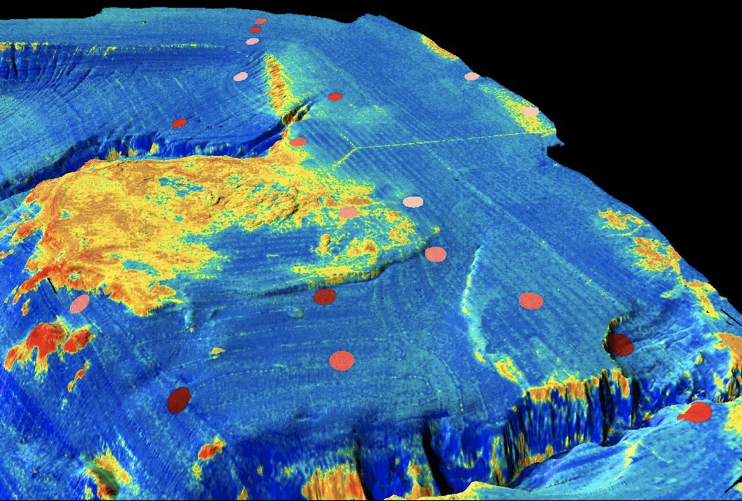
Multibeam sonar backscatter data draped on bathymetry off Santa Monica Calif. Yellow is high backscatter. Santa Monica sewer pipe and diffuser is visible in upper part of image (y-shaped feature). Red-brown dots represent color-coded fish abundance as determined from trawl data.
Source: https://tinyurl.com/ydhqtr8f
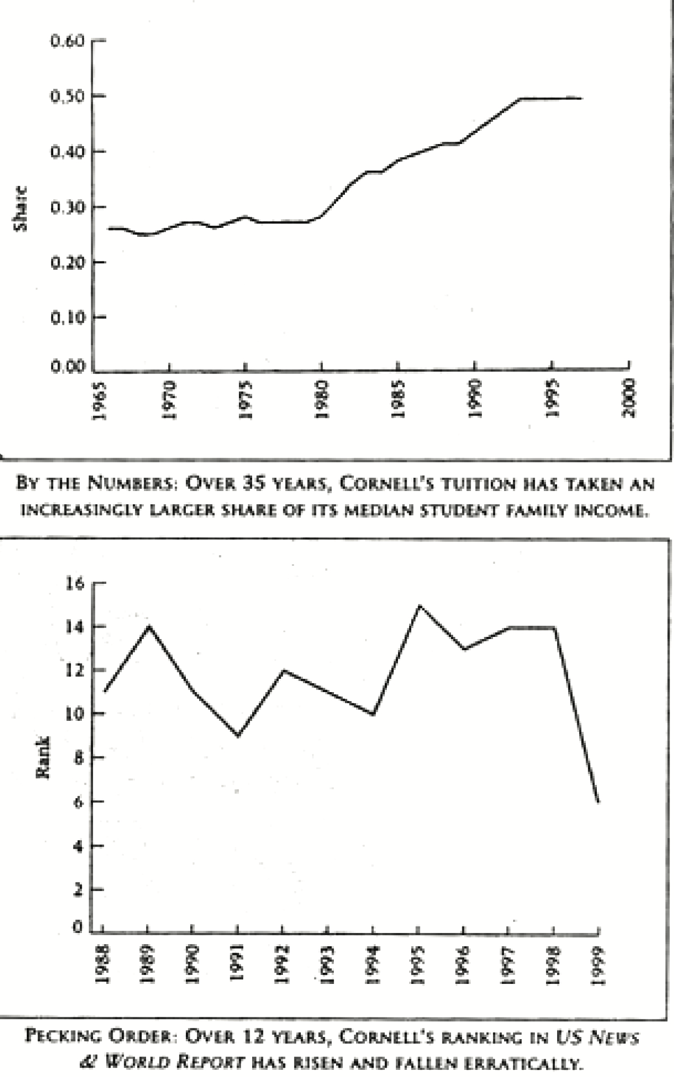
Source: Chris Adolph, also Johnson, R.R. and Kuby, P.J., 2011. Elementary statistics. Cengage Learning.
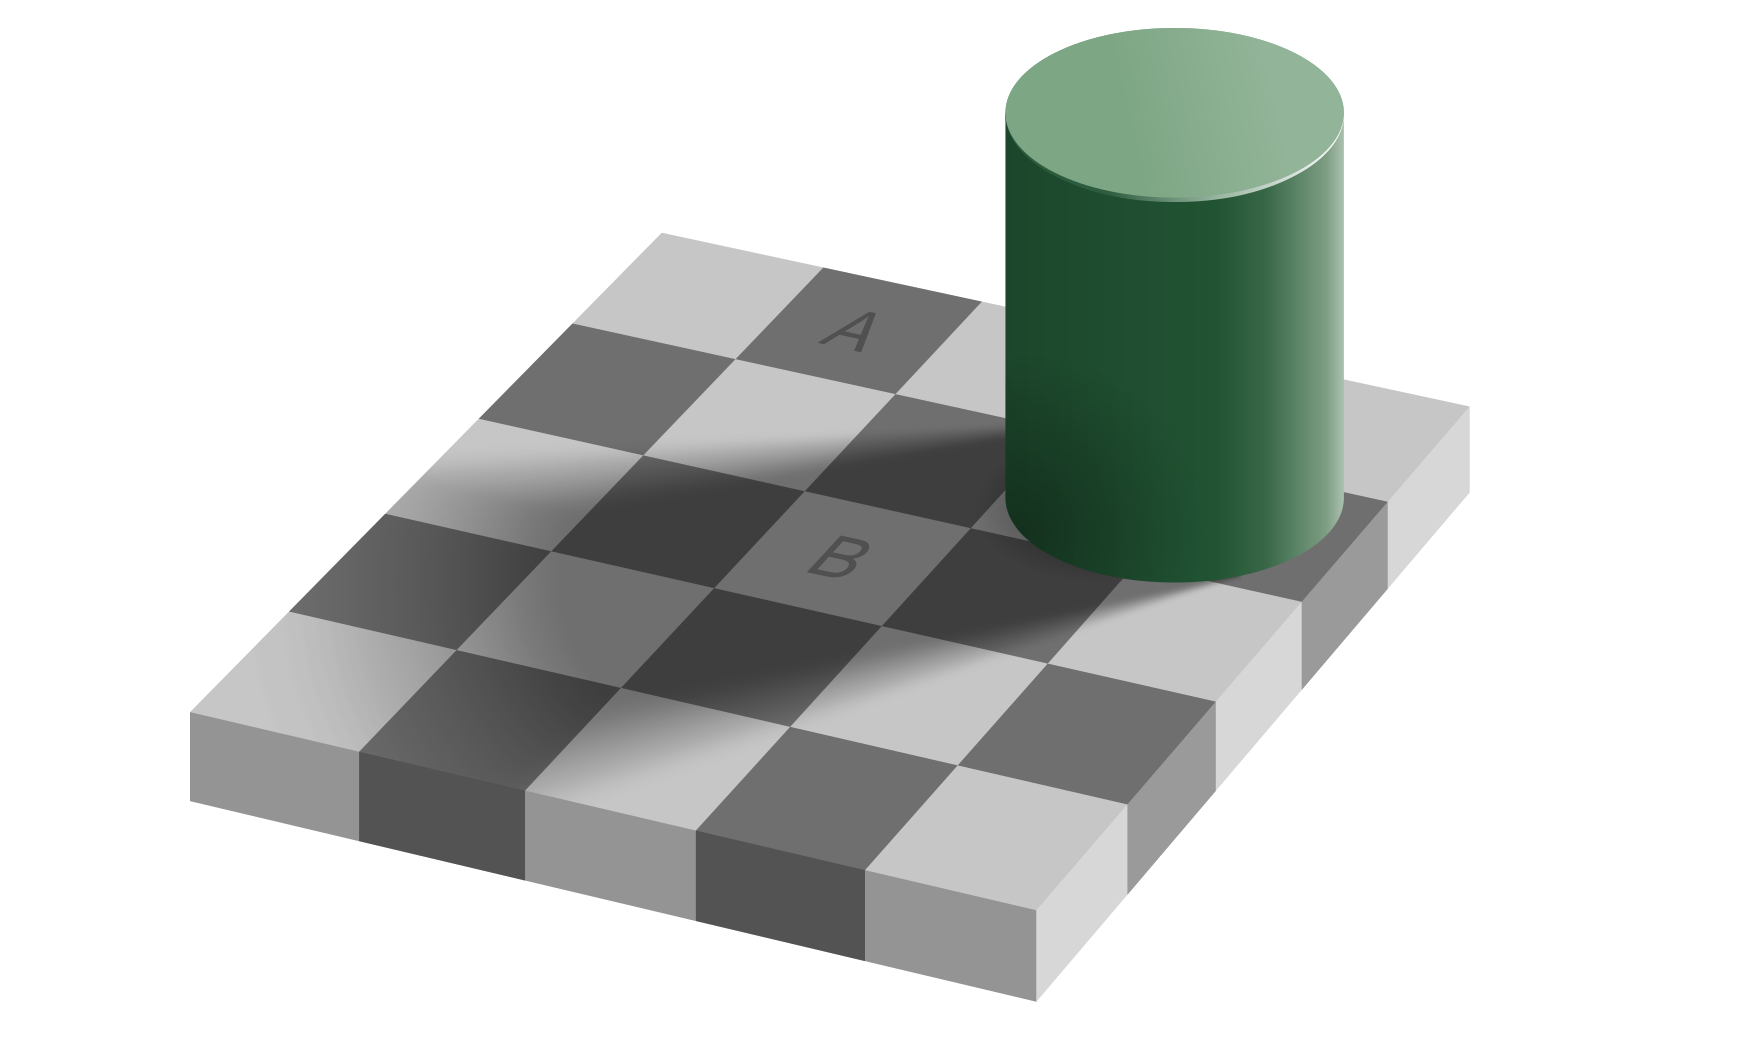
Look closer
Look closer
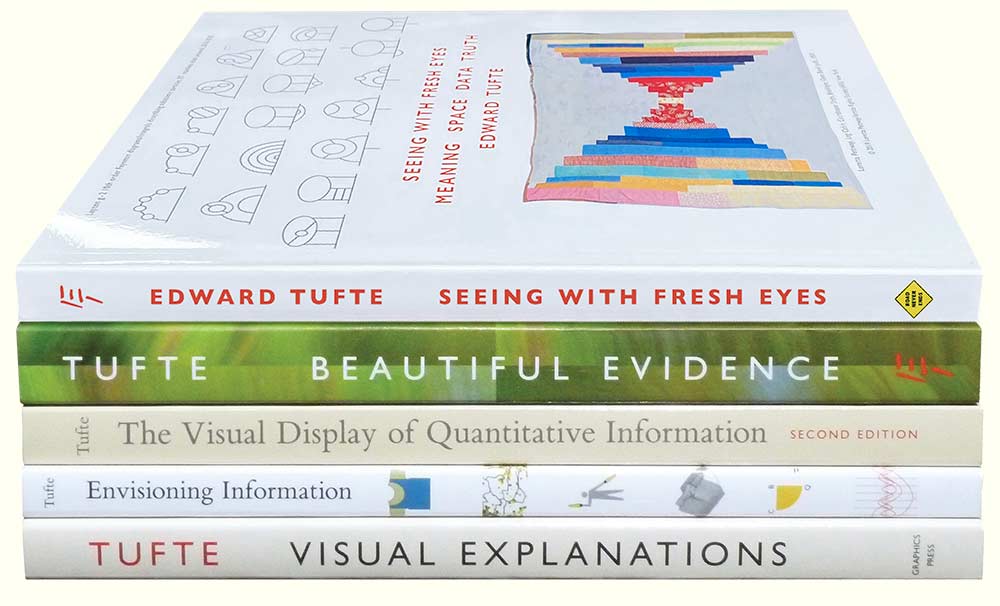
Source: Edward R. Tufte. 2001. The Visual Display of Quantitative Information. Graphics Press. 2nd ed.
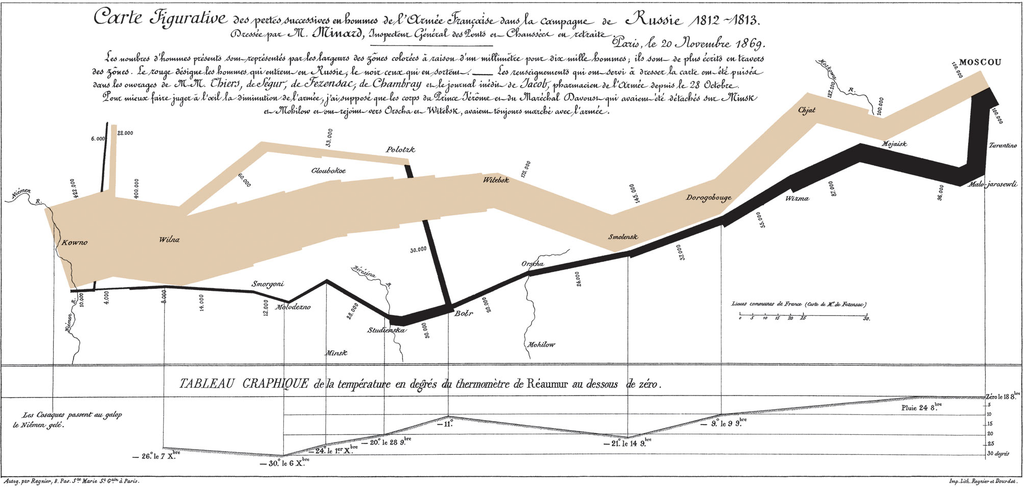
Source: https://en.wikipedia.org/wiki/Charles_Joseph_Minard
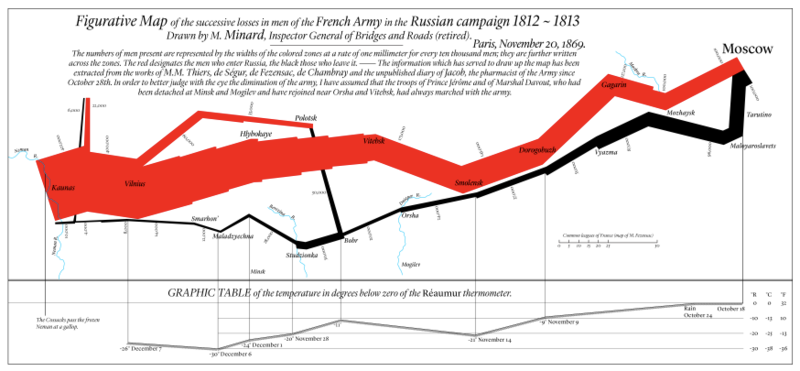
Charles Joseph Minard, in mapping Napoleon's march on Moscow
Source: https://en.wikipedia.org/wiki/Charles_Joseph_Minard
How much information?
1. Latitude of army & features (Y-coordinate) . 2. Longitude of army & features (X-coordinate)
3. Size of army (width of line, numerals) . 4. Advance vs. Retreat color of line
5. Division of army splitting of line 6. Temperature linked lineplot
7. Time linked lineplot
Source: https://en.wikipedia.org/wiki/Charles_Joseph_Minard
Combines narrative & analysis:
a technique mostly lost until this century
- Chris Adoph
Source: https://en.wikipedia.org/wiki/Charles_Joseph_Minard
Source: https://en.wikipedia.org/wiki/Charles_Joseph_Minard
By Karl Ho


