


Katya Malinova PRO
I am an Associate Professor, Mackenzie Investments Chair in Evidence-Based Investment Management at the DeGroote School of Business, McMaster University, Canada.
Katya Malinova and Andreas Park
Warwick Business School Gillmore Centre Conference
DeFi & Digital Currencies
The Shard. London 27 & 28 October 2023
Preliminaries & Some Motivation
Basic Idea
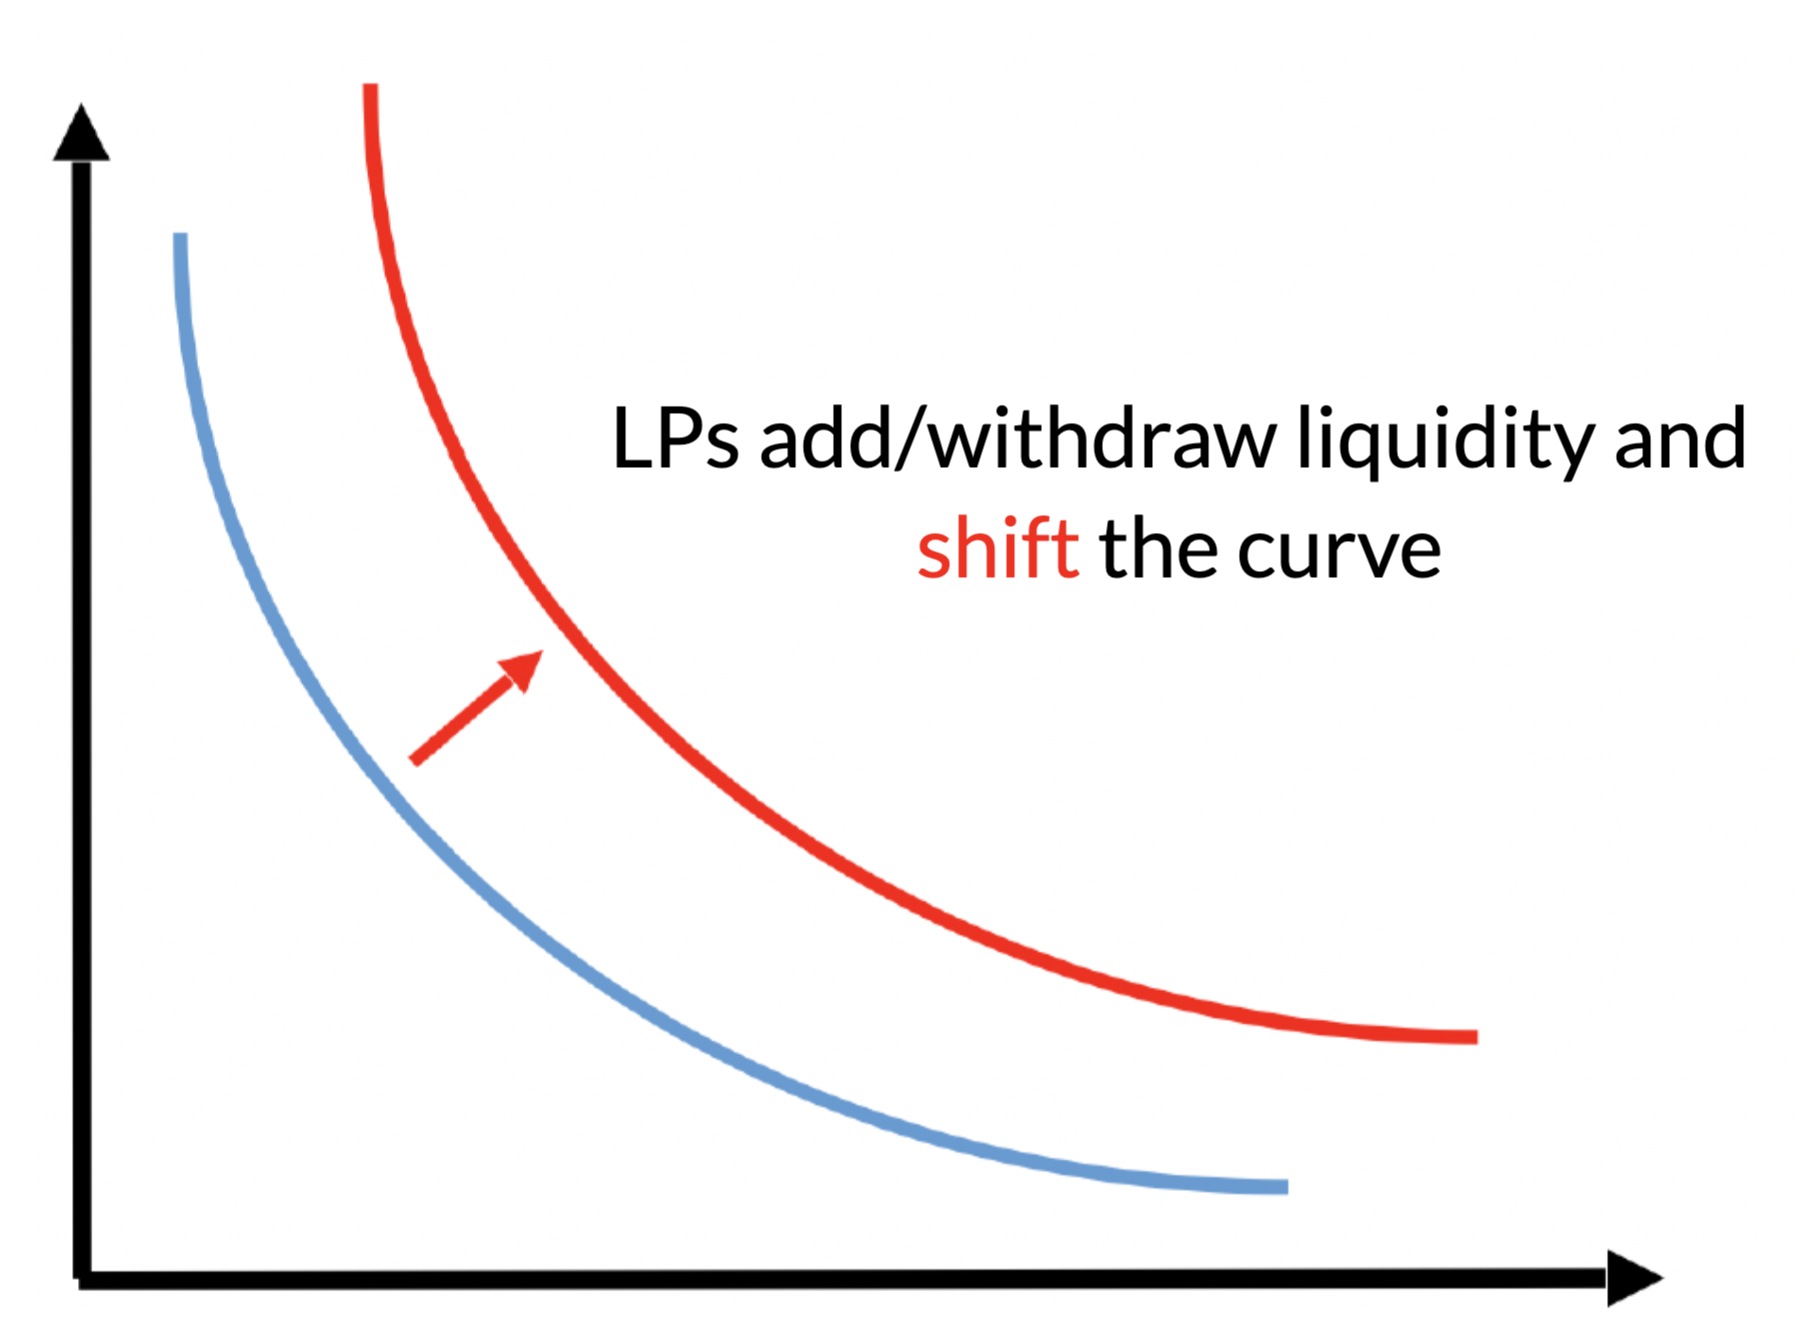
Liquidity providers
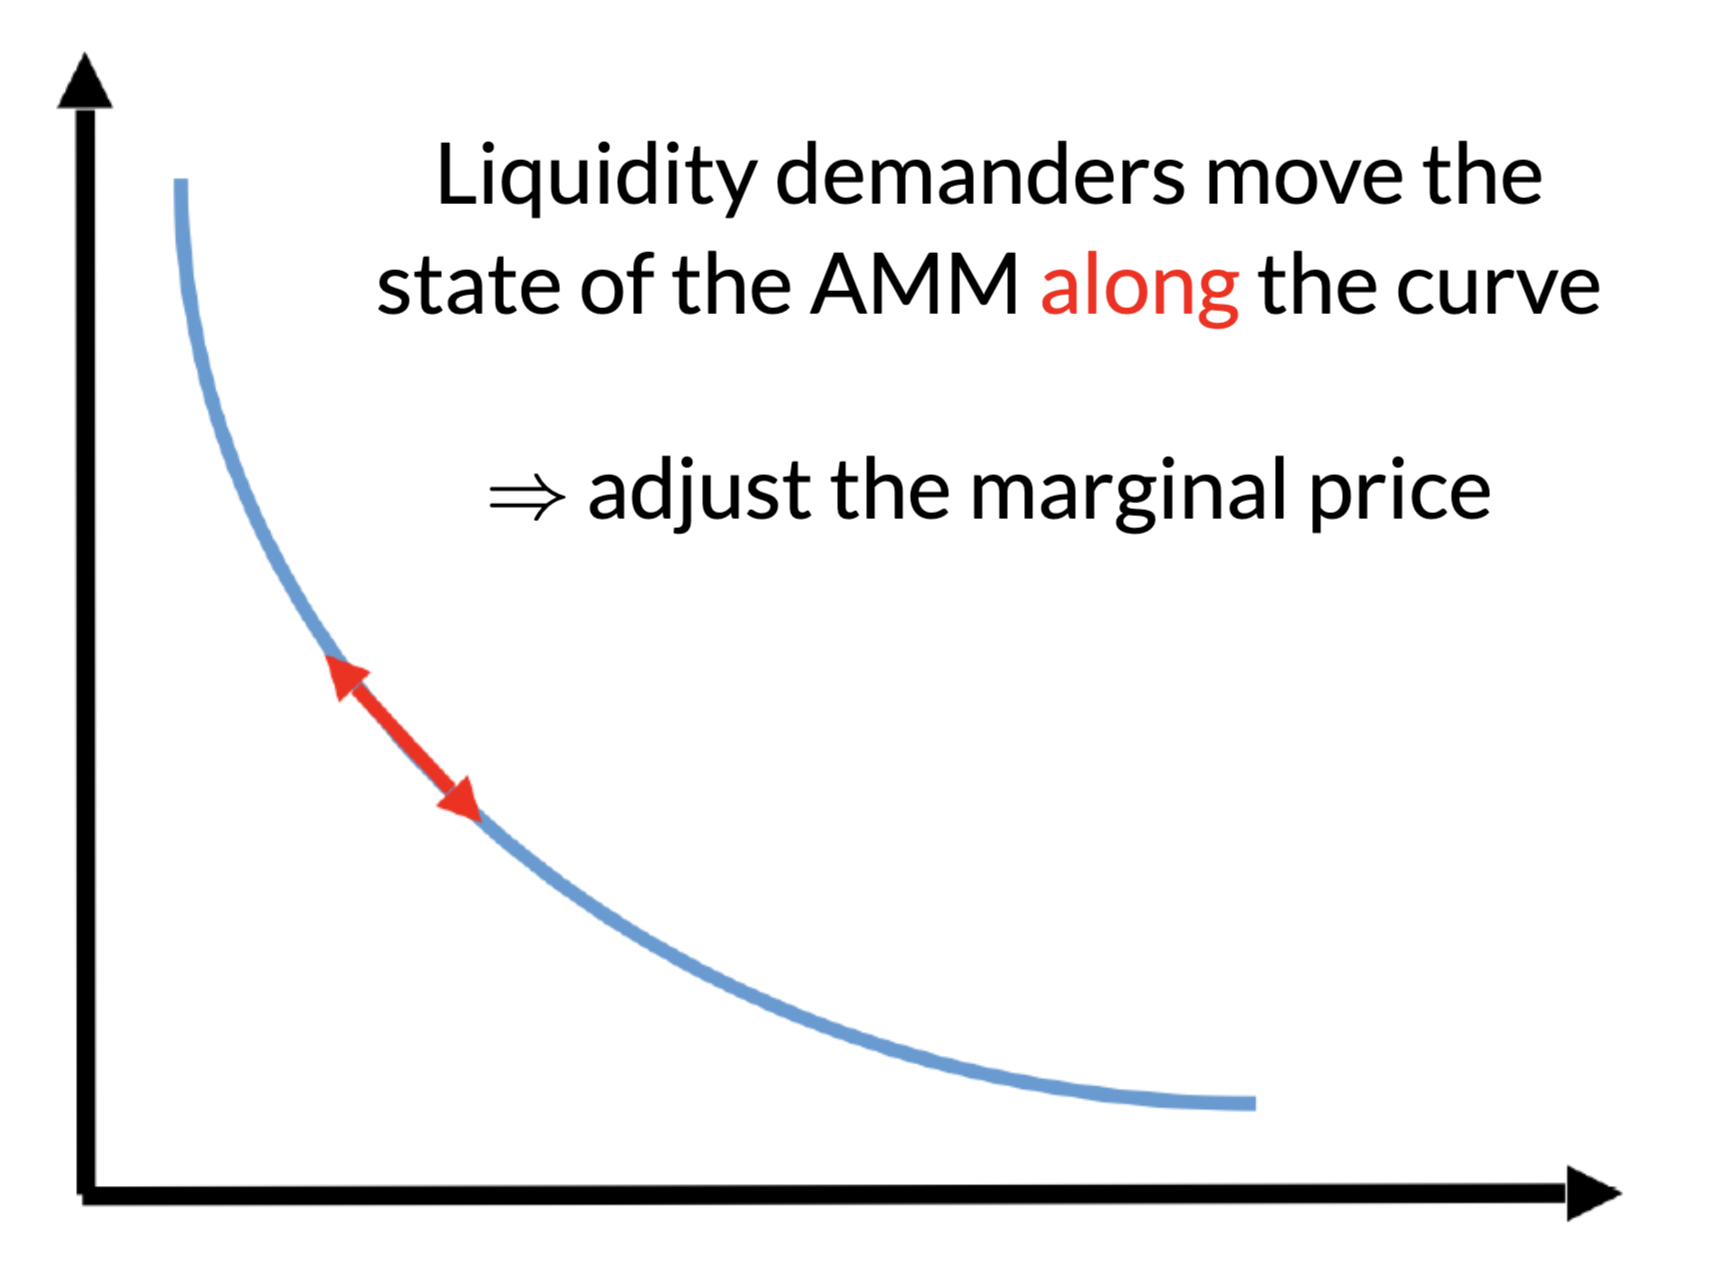
Liquidity demander
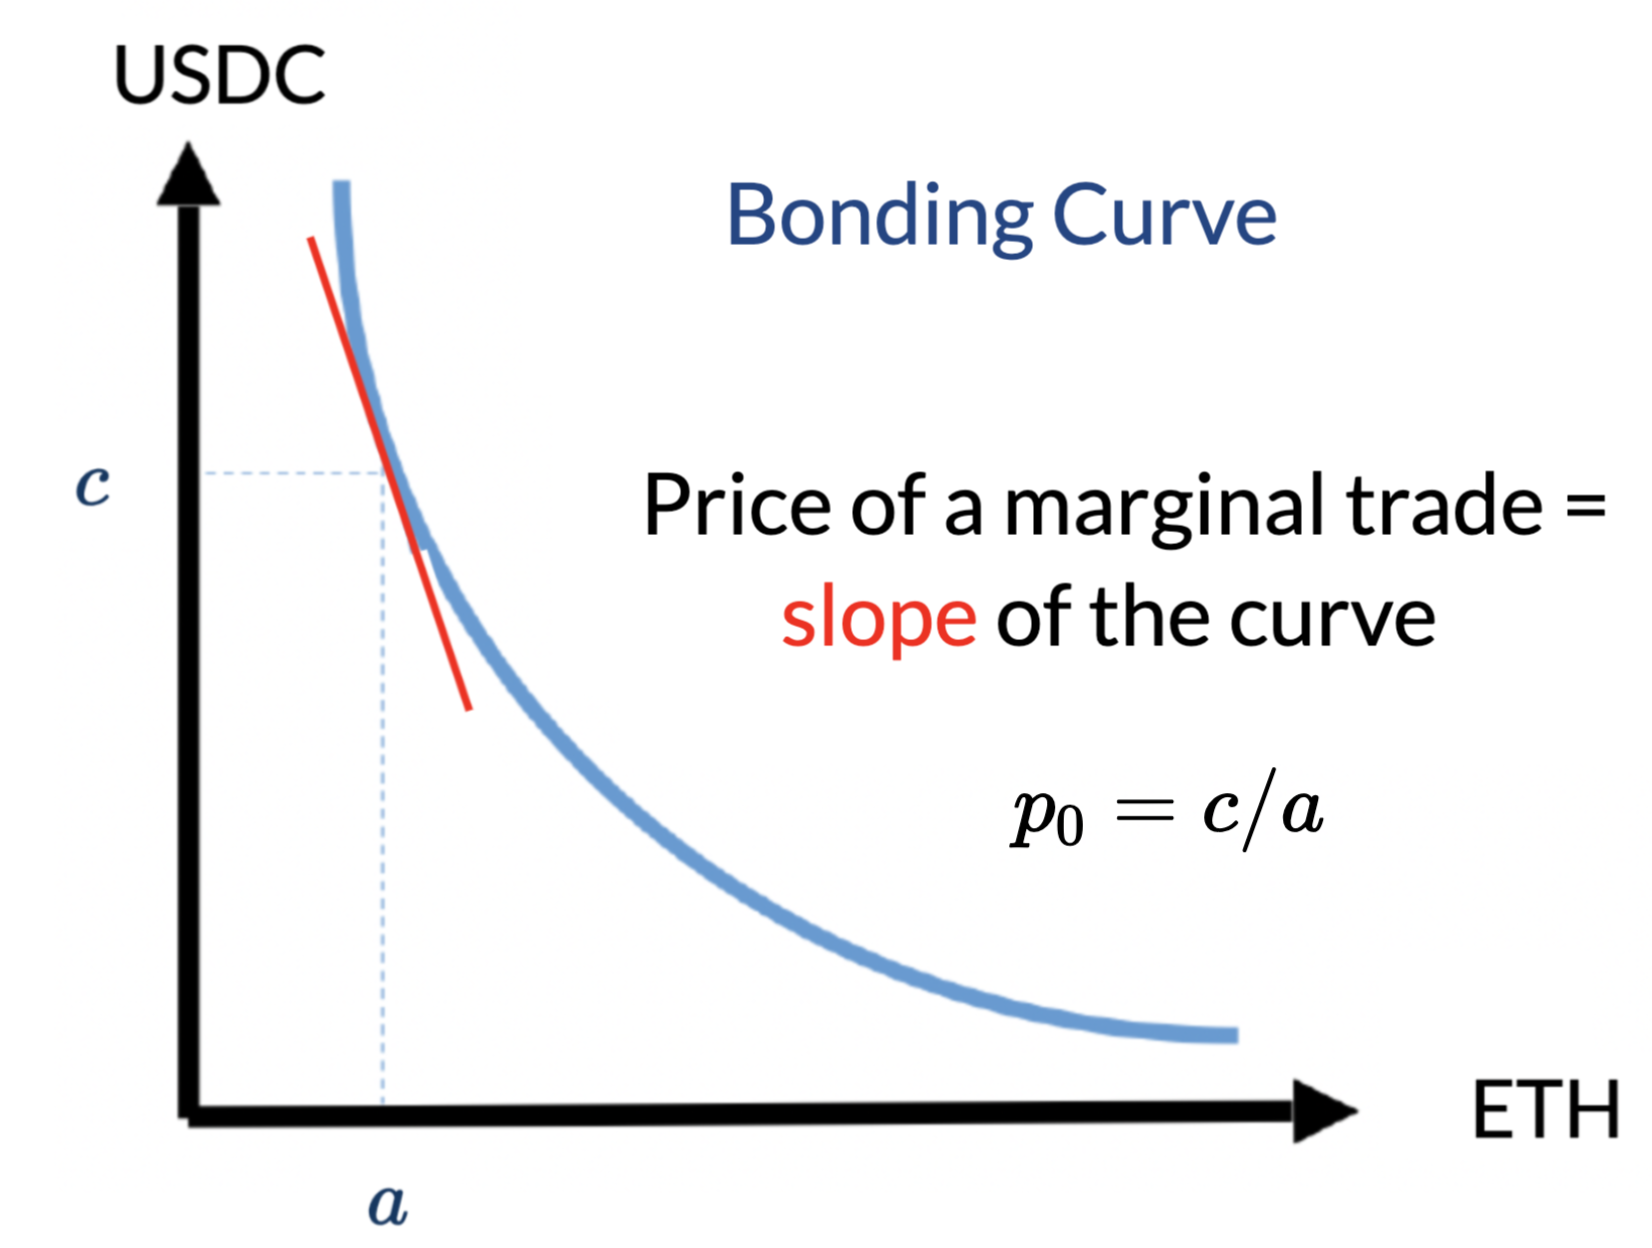
Liquidity Pool
AMM pricing is mechanical:
No effect on the marginal price
Key Components
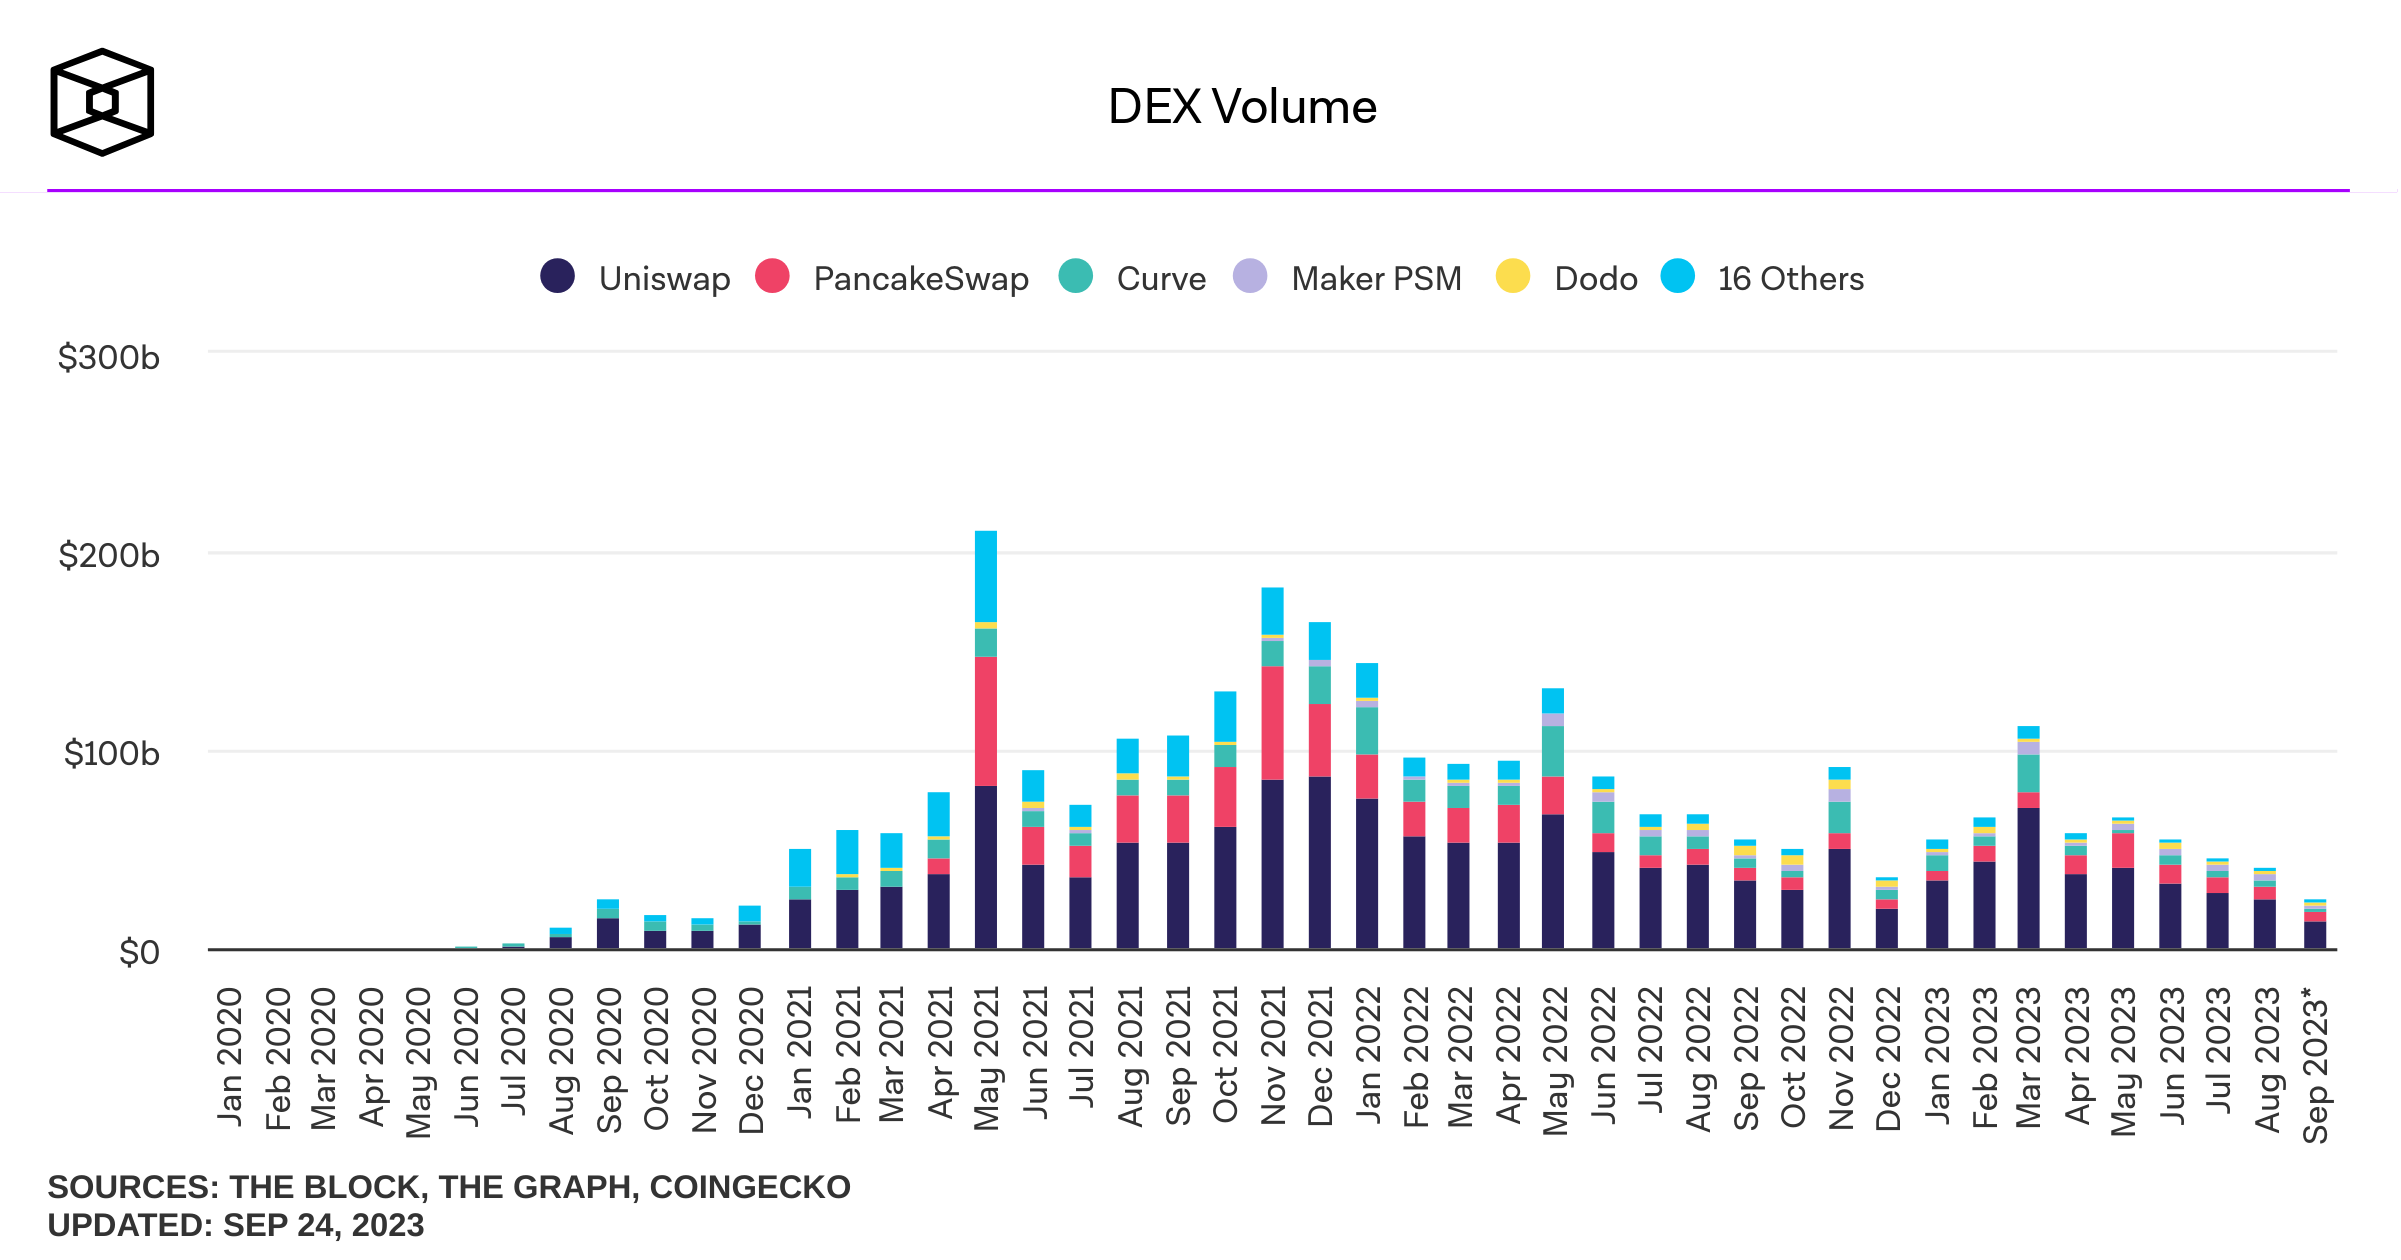
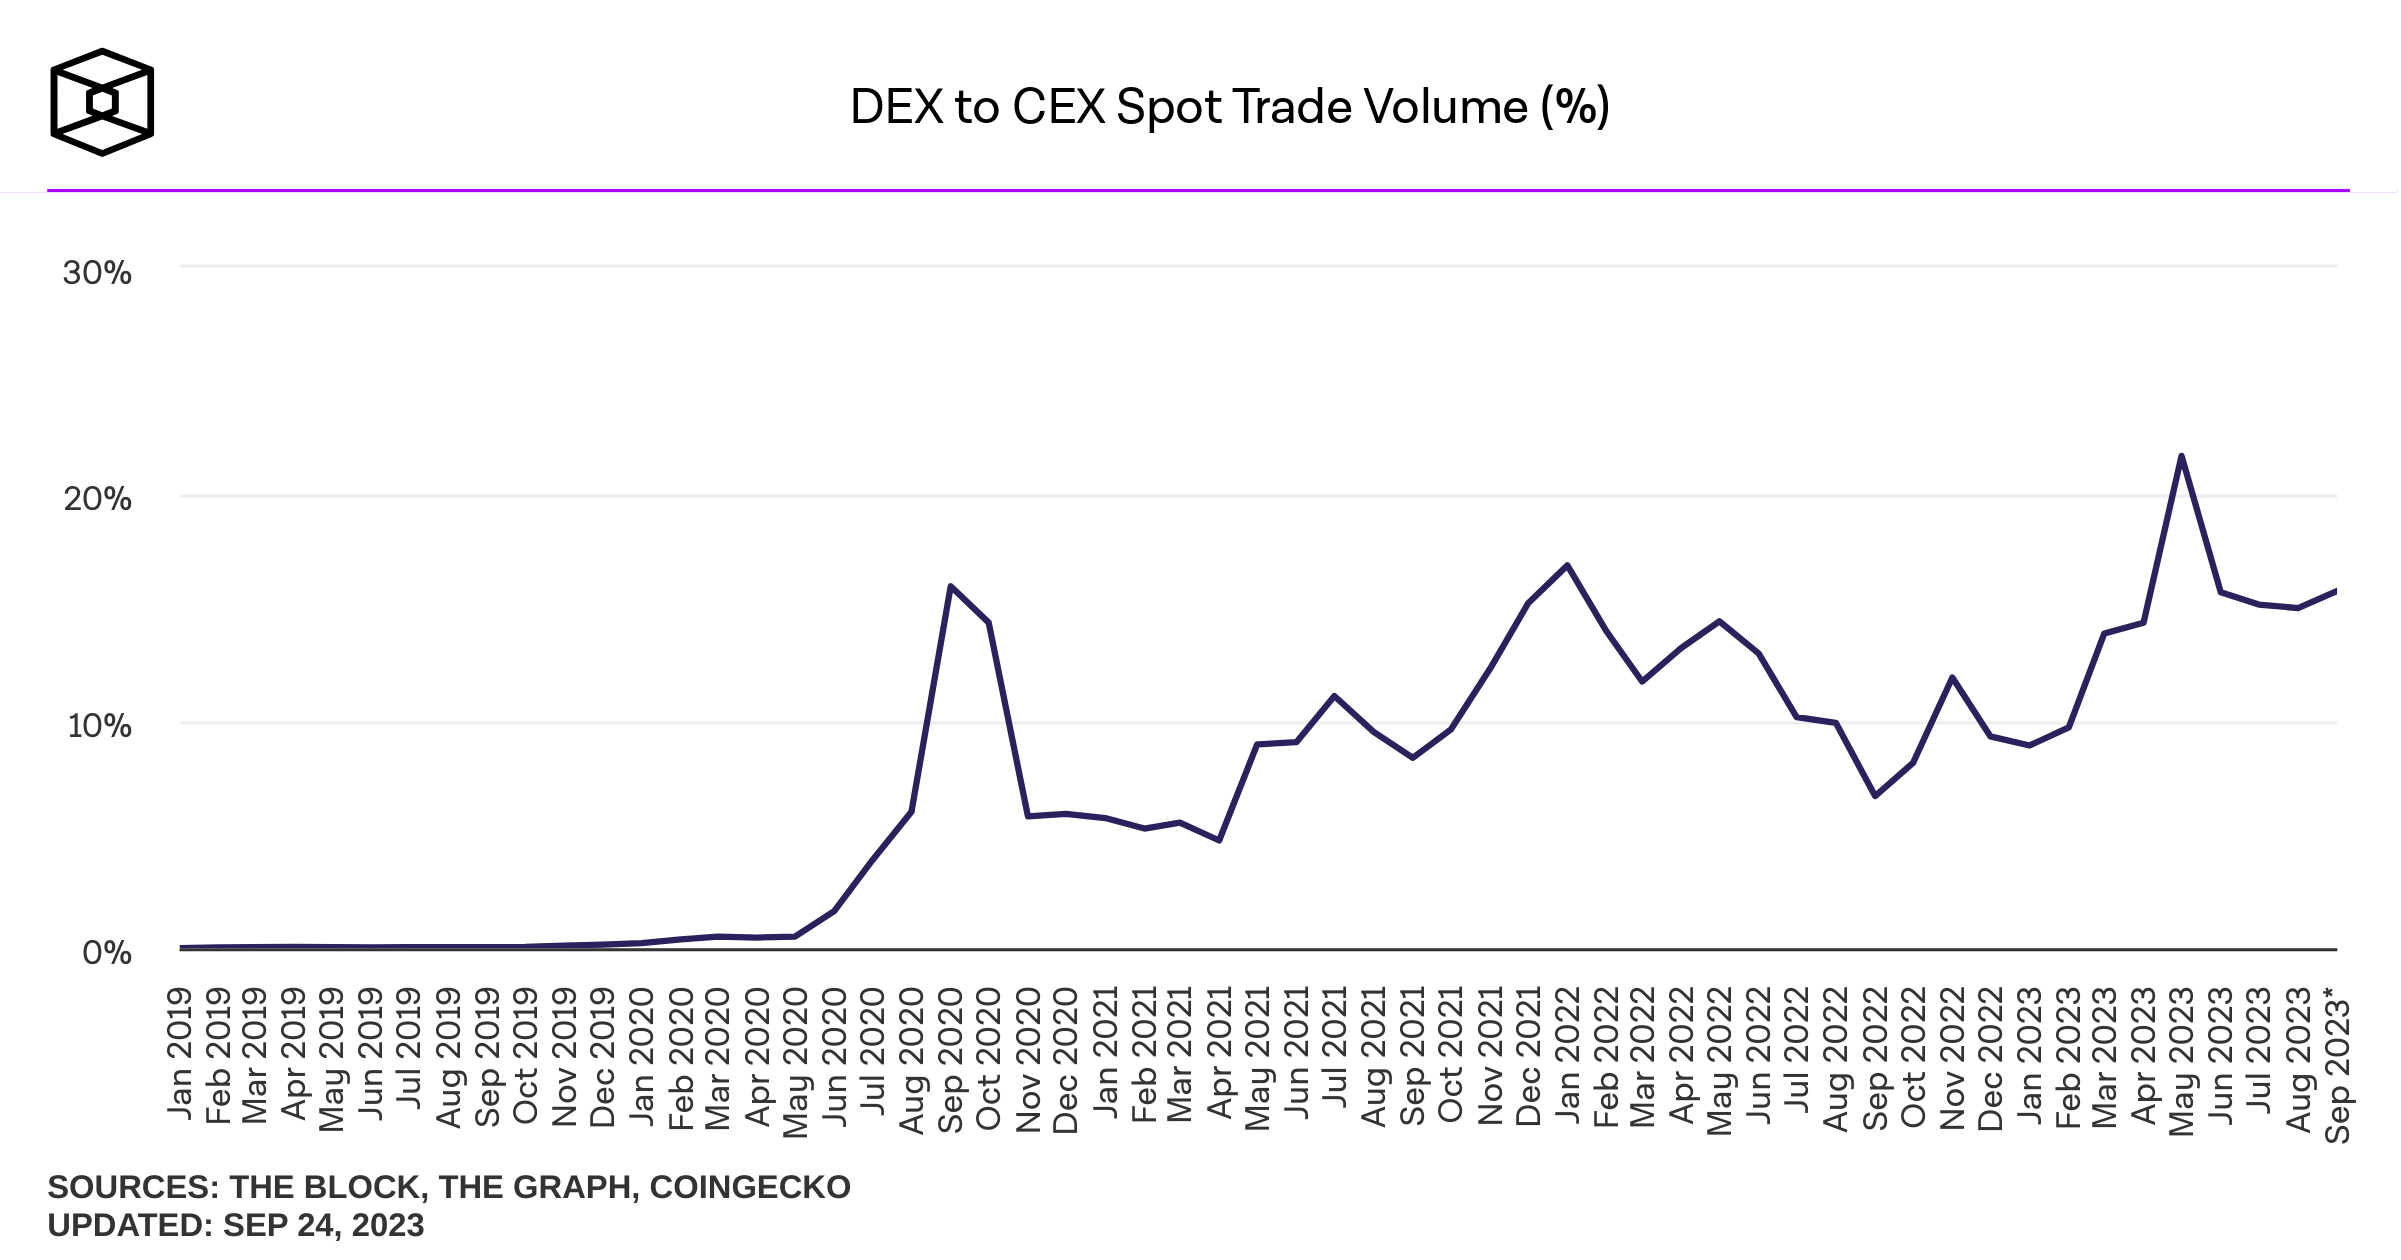
Liquidity Supply and Demand in an Automated Market Maker
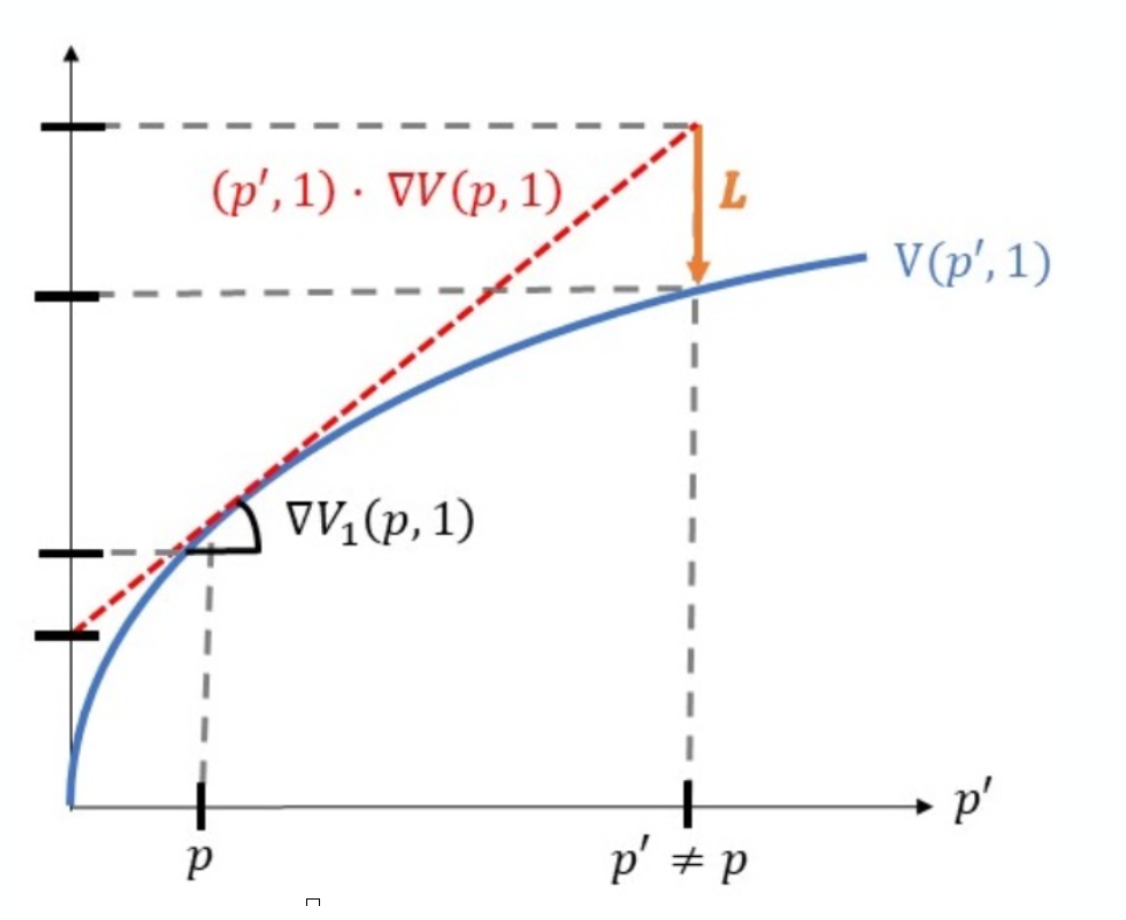
Liquidity providers: positional losses
Buy and hold
Provided liquidity
in the pool
Returns to liquidity providers
Similar to Lehar and Parlour (2023), Barbon & Ranaldo (2022).
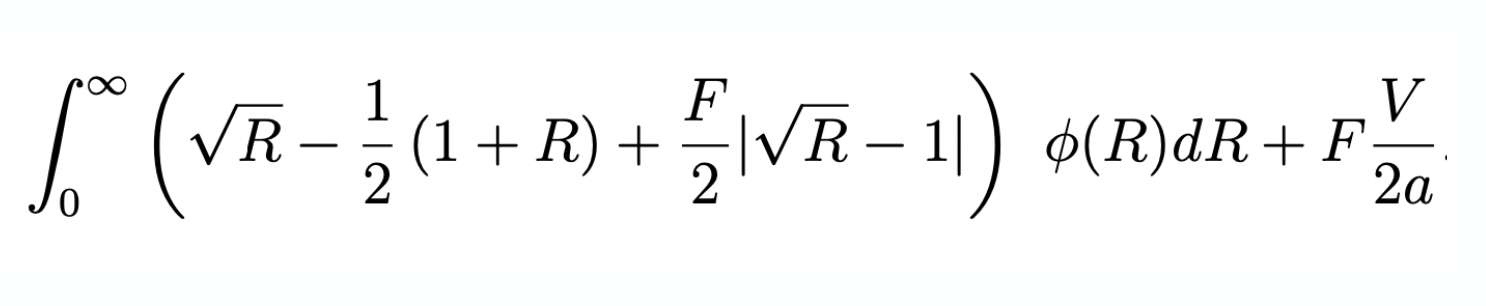
(incremental) adverse selection loss when the return is \(R\)
fees earned
on informed
fees earned
on balanced flow
for reference:
For fixed balanced volume \(V\) & fee \(F\):
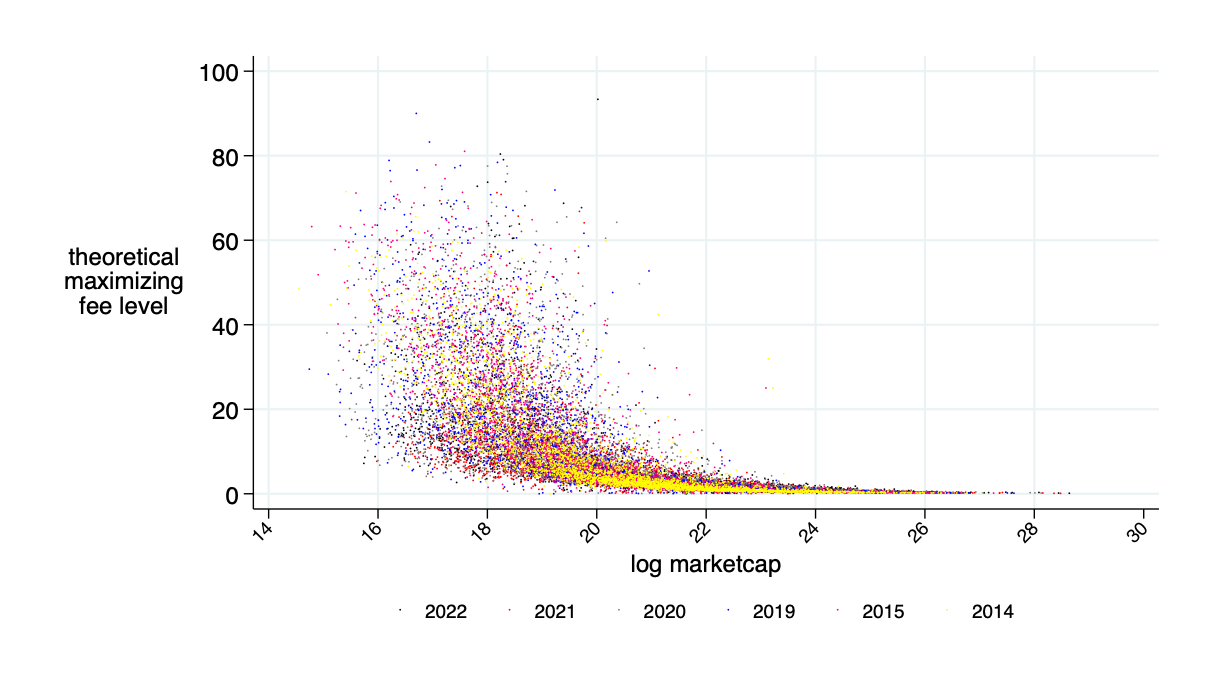
Liquidity Demander's Decision & (optimal) AMM Fees
Result:
competitive liq provision\(\to\) there exists an optimal (min trading costs) fee \(>0\)
Similar to Lehar&Parlour (2023) and Hasbrouck, Riviera, Saleh (2023)
What's next?
How we think of the Implementation of an AMM for our Empirical Analysis
Approach: daily AMM deposits
Background on Data
some volume may be intermediated
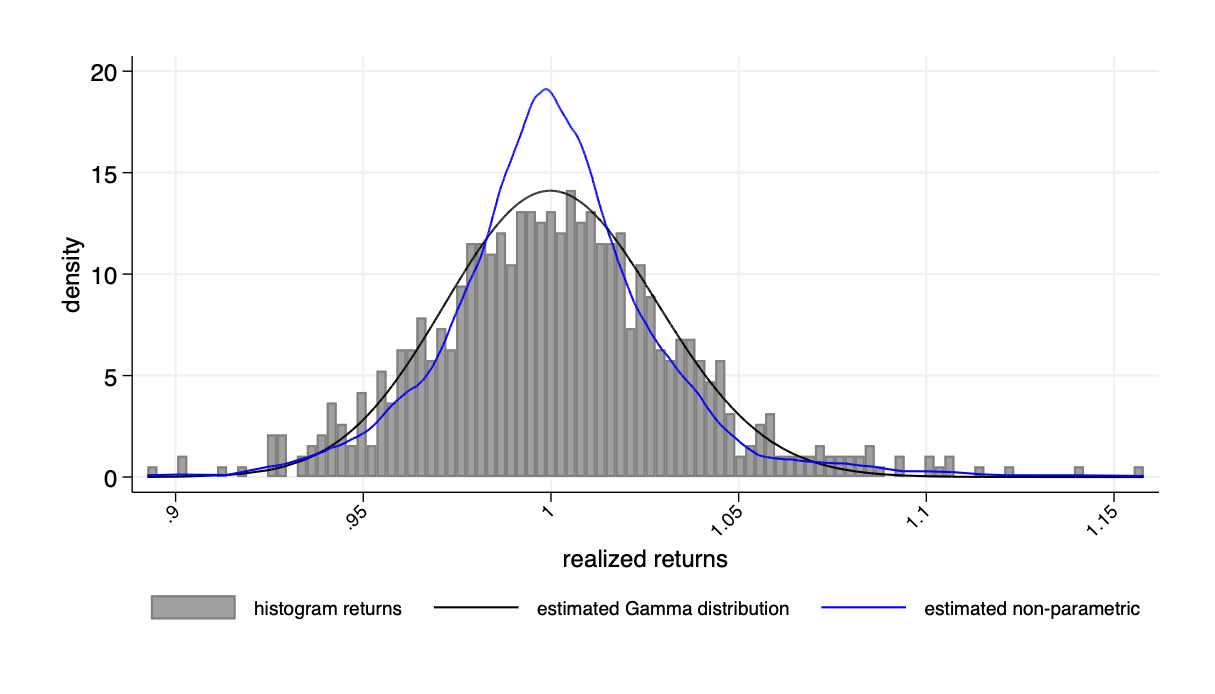
AMMs based on historical returns
Return distribution example: Tesla
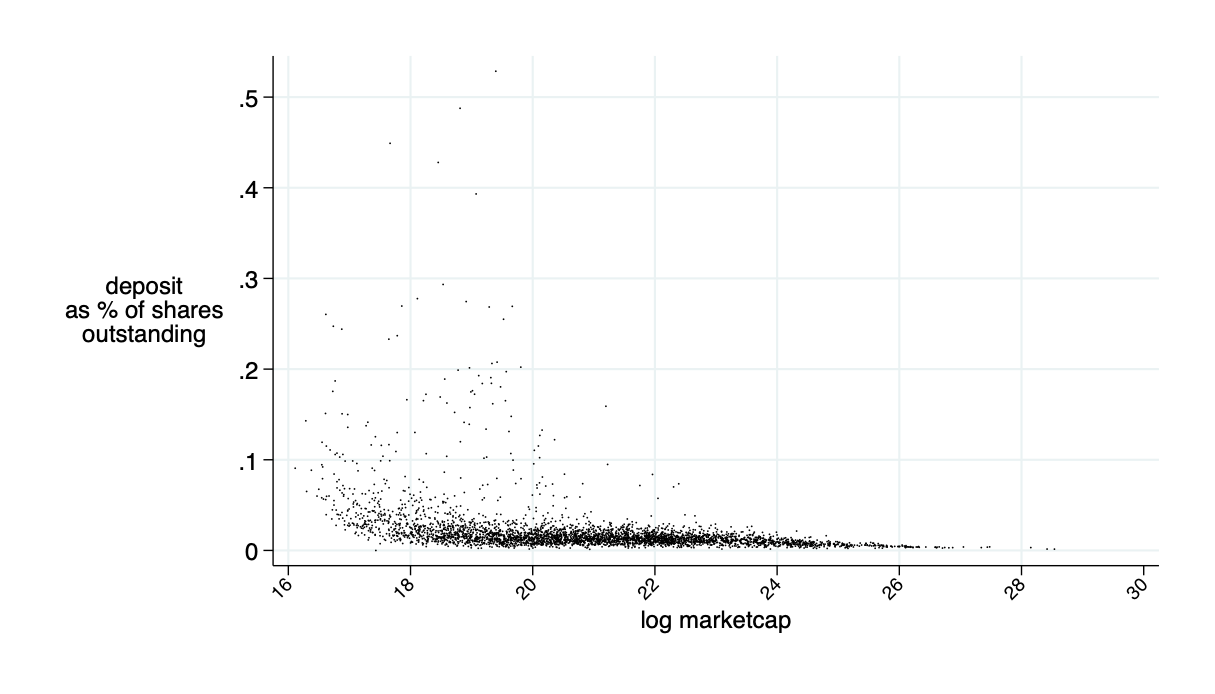
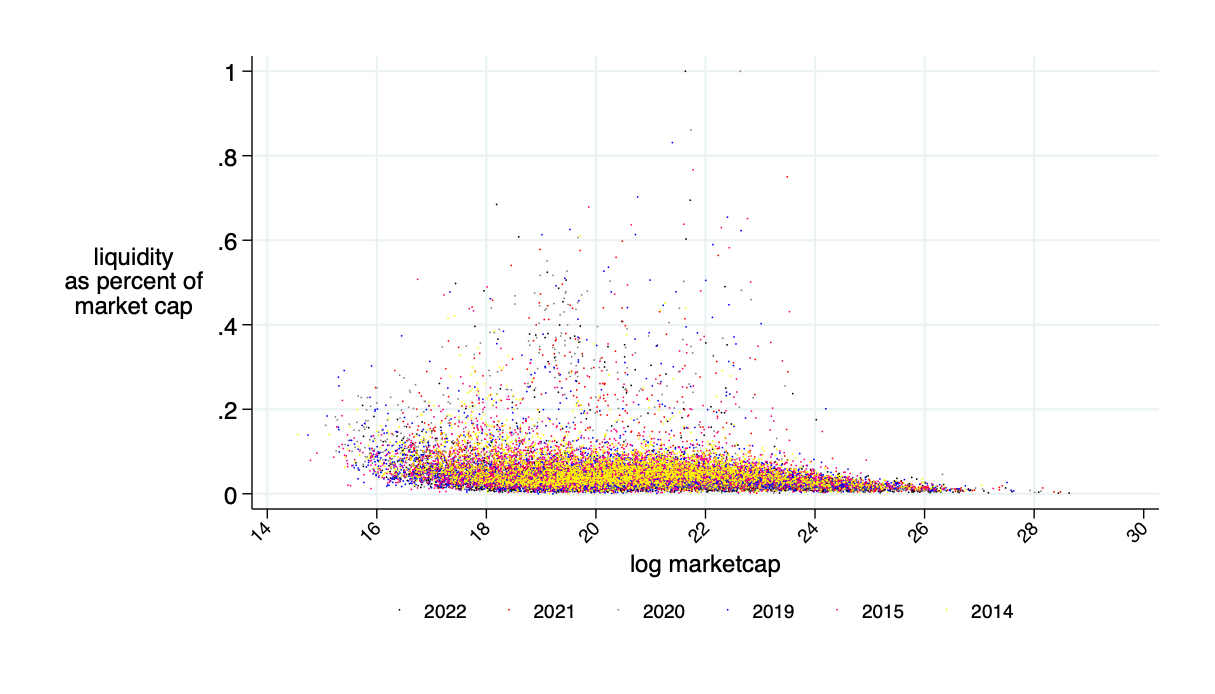
Average of the market cap to be deposited for competitive liquidity provision: \(\bar{\alpha}\approx 2\%\)
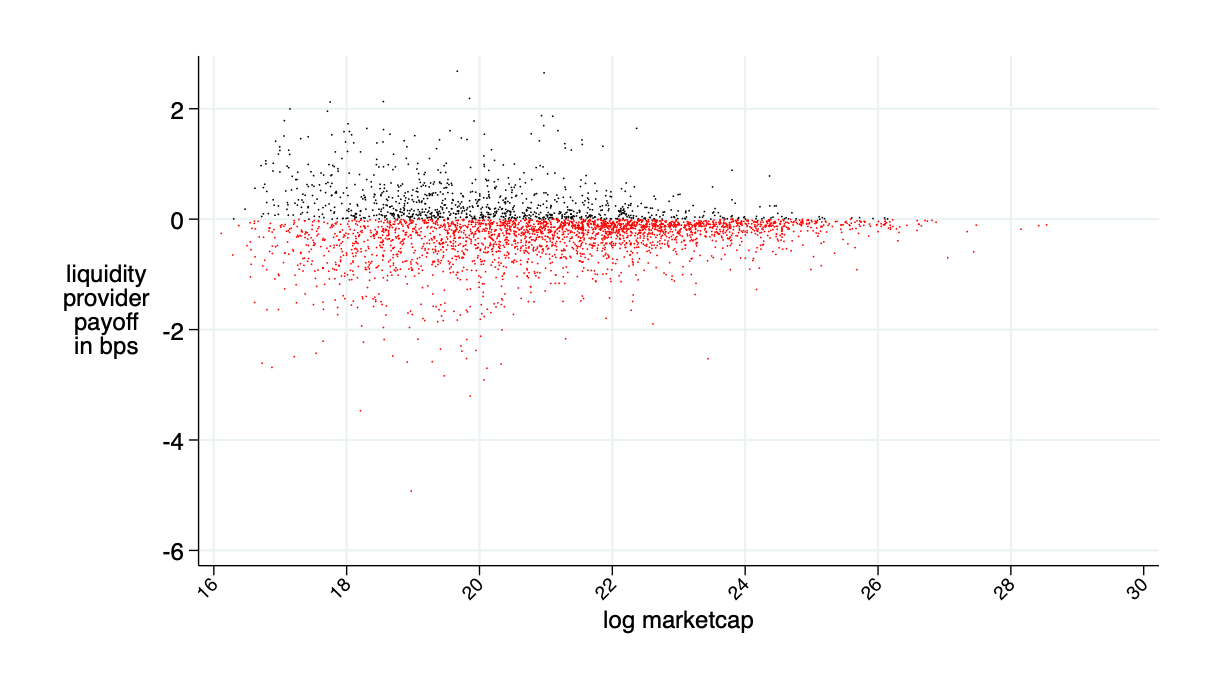
almost break even on average (average loss 0.2bps \(\approx0\))
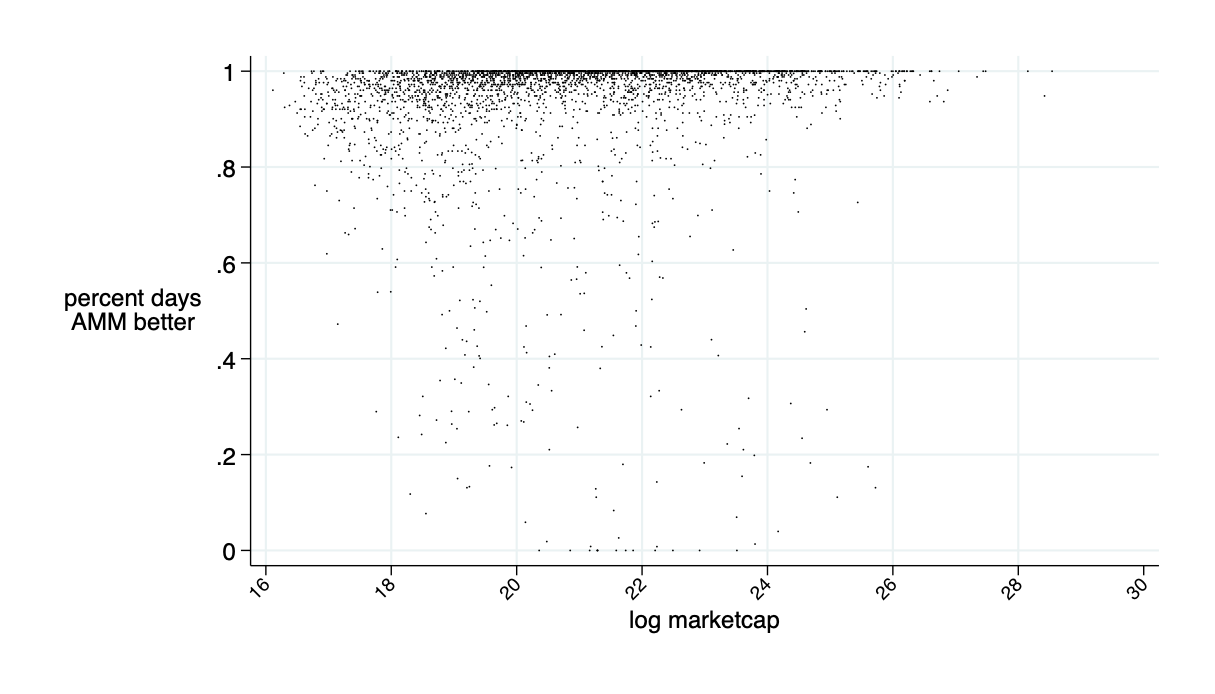
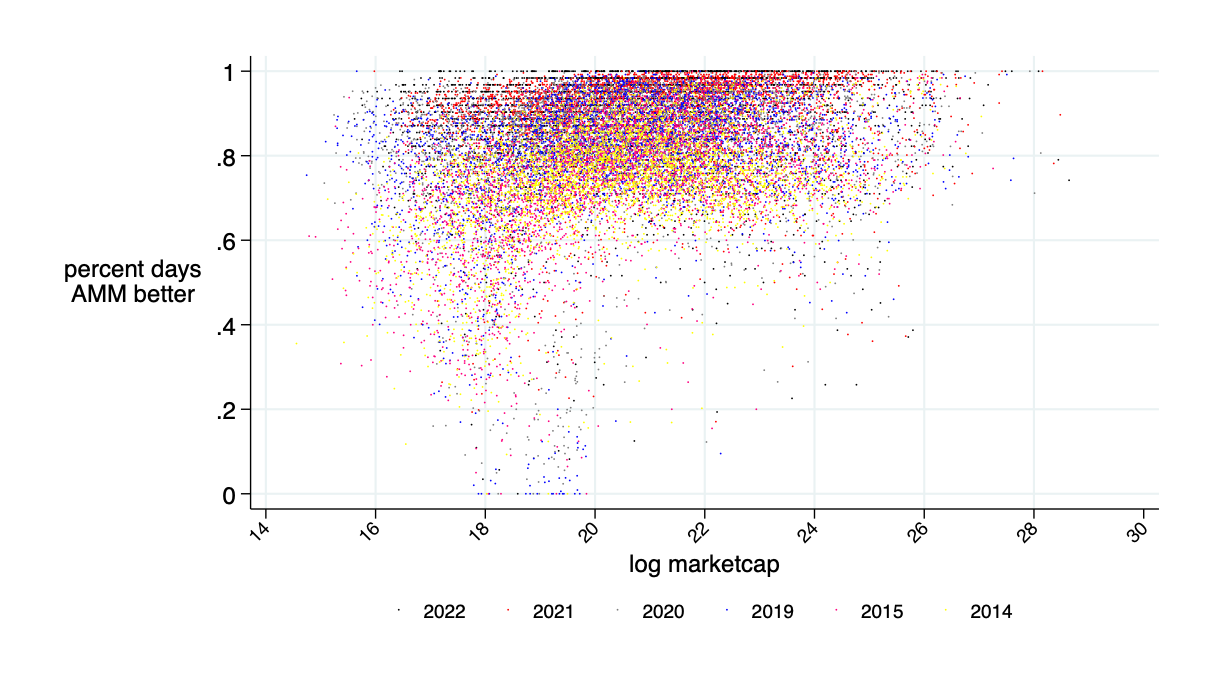
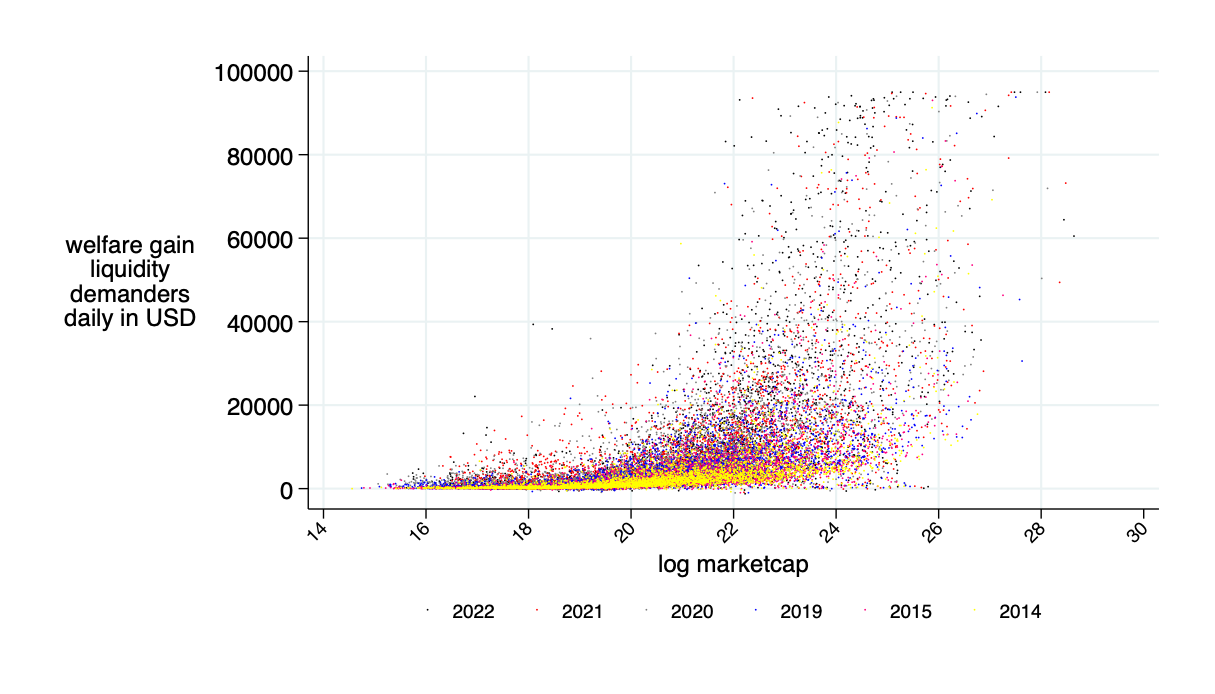
average: 94% of days AMM is cheaper than LOB for liq demanders
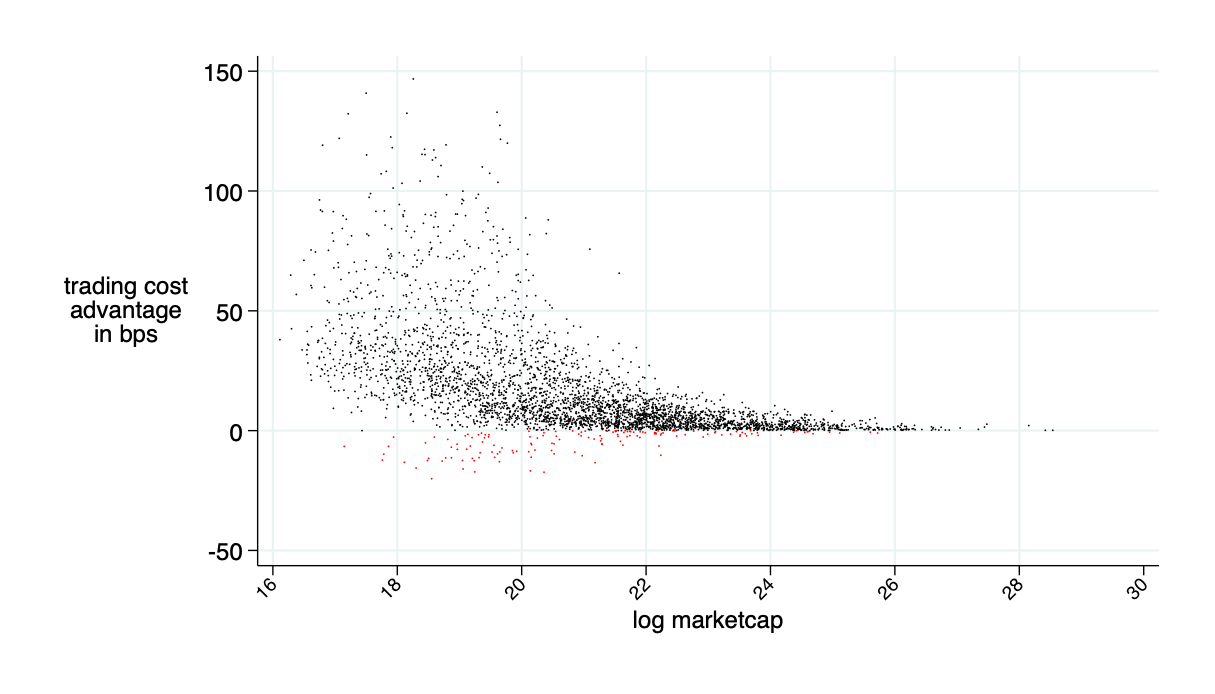
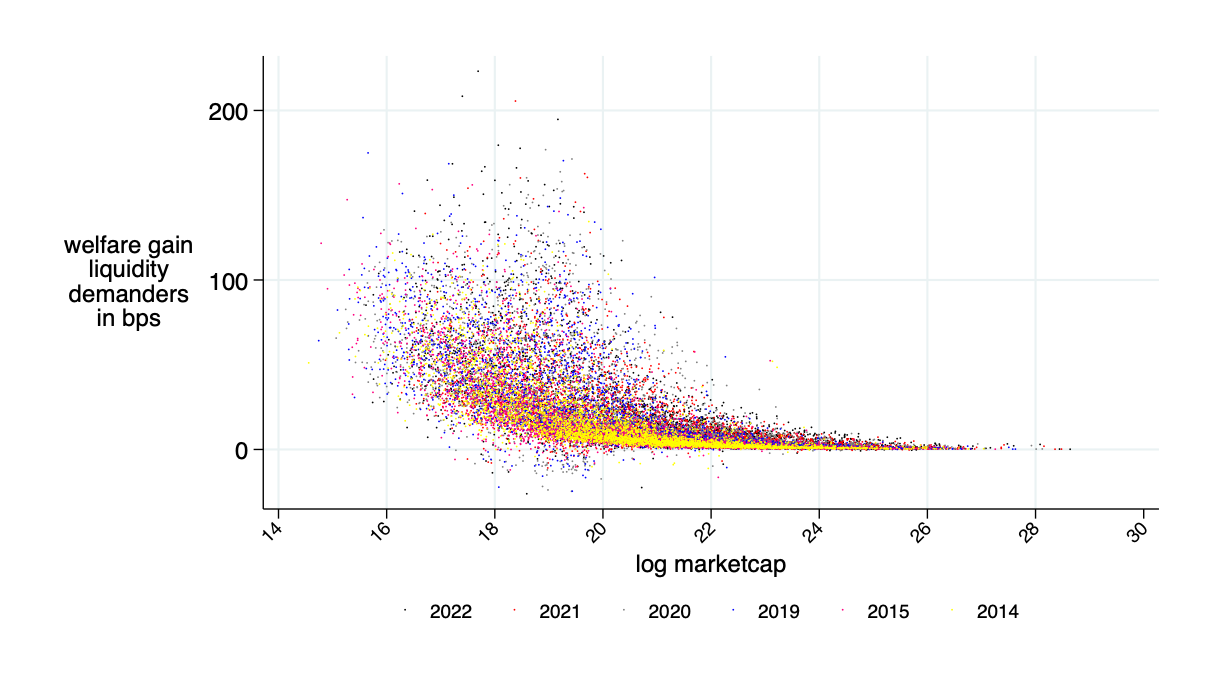
average savings: 16 bps
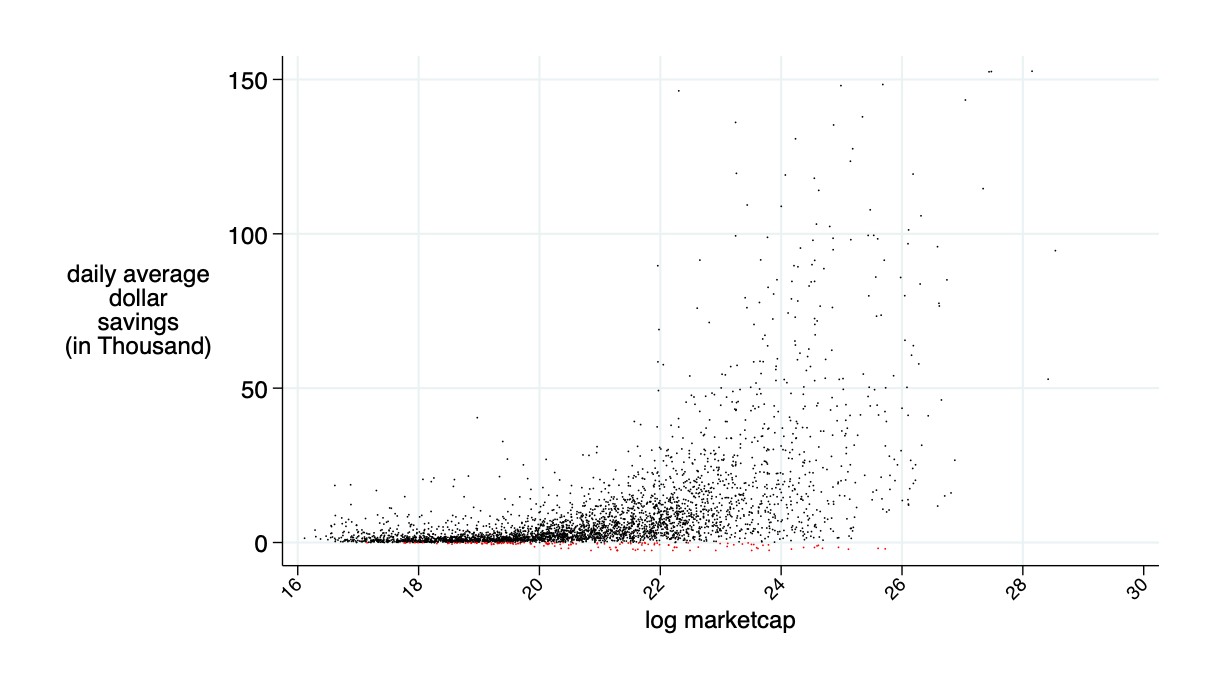
average daily: $9.5K
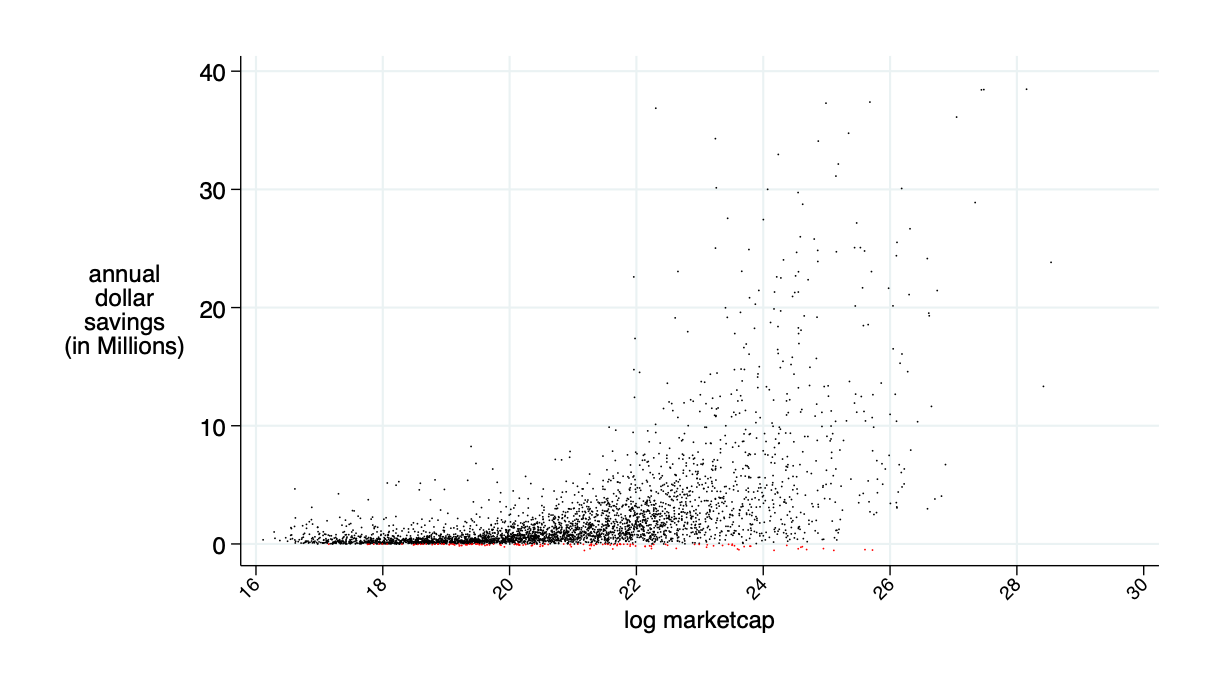
average annual saving: $2.4 million
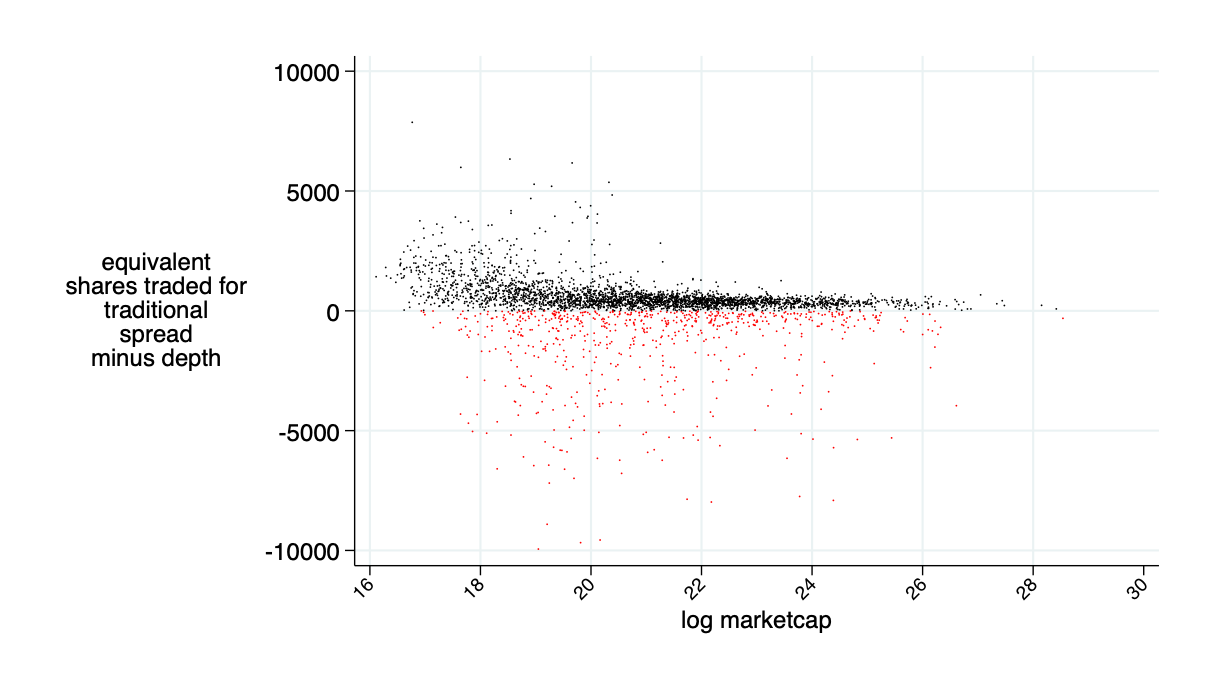
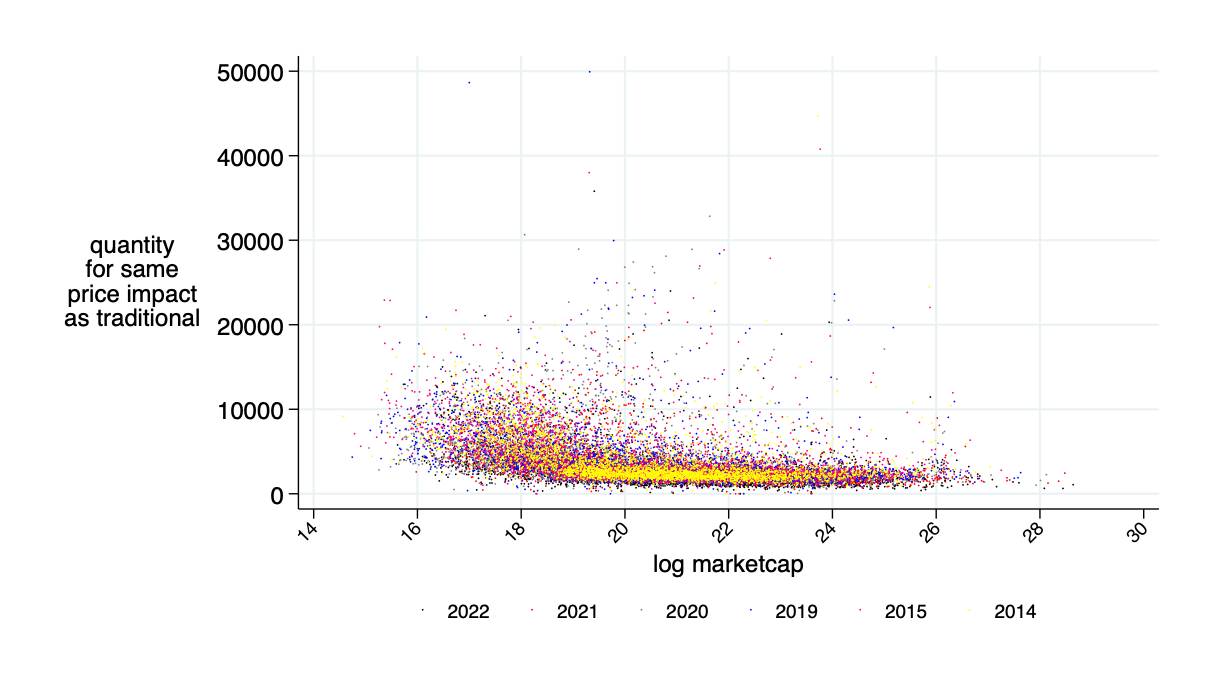
implied "excess depth" on AMM relative to the traditional market
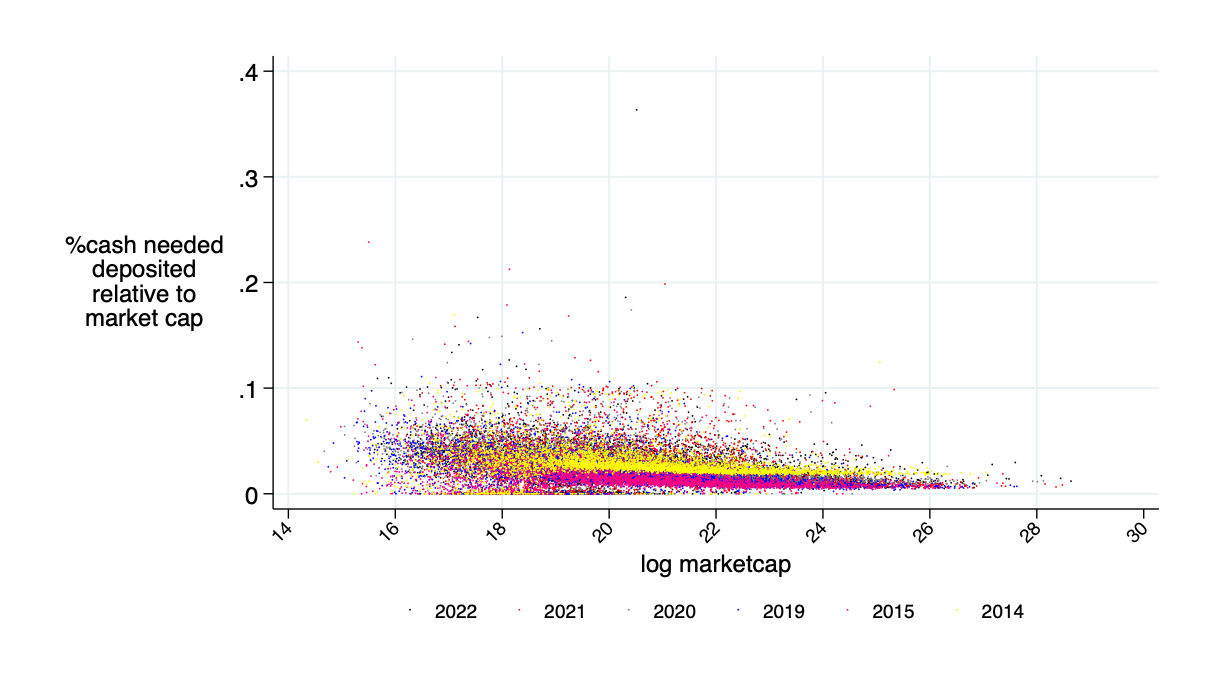
Sidebar: Capital Requirement
Deposit Requirements
\(\Rightarrow \) Need about 5% of the value of the shares deposited -- not 100% -- to cover up to a 10% return decline
Summary
@katyamalinova
malinovk@mcmaster.ca
slides.com/kmalinova
https://sites.google.com/site/katyamalinova/
Deposit Requirements
\(\Rightarrow \) Need about 5% of the value of the shares deposited -- not 100% -- to cover up to a 10% return decline
An alternative to -10% circuit breaker:
max cash needed based on long-run past average R \(-\) 2 std
Optimally Designed AMMs with
"ad hoc" one-day backward look
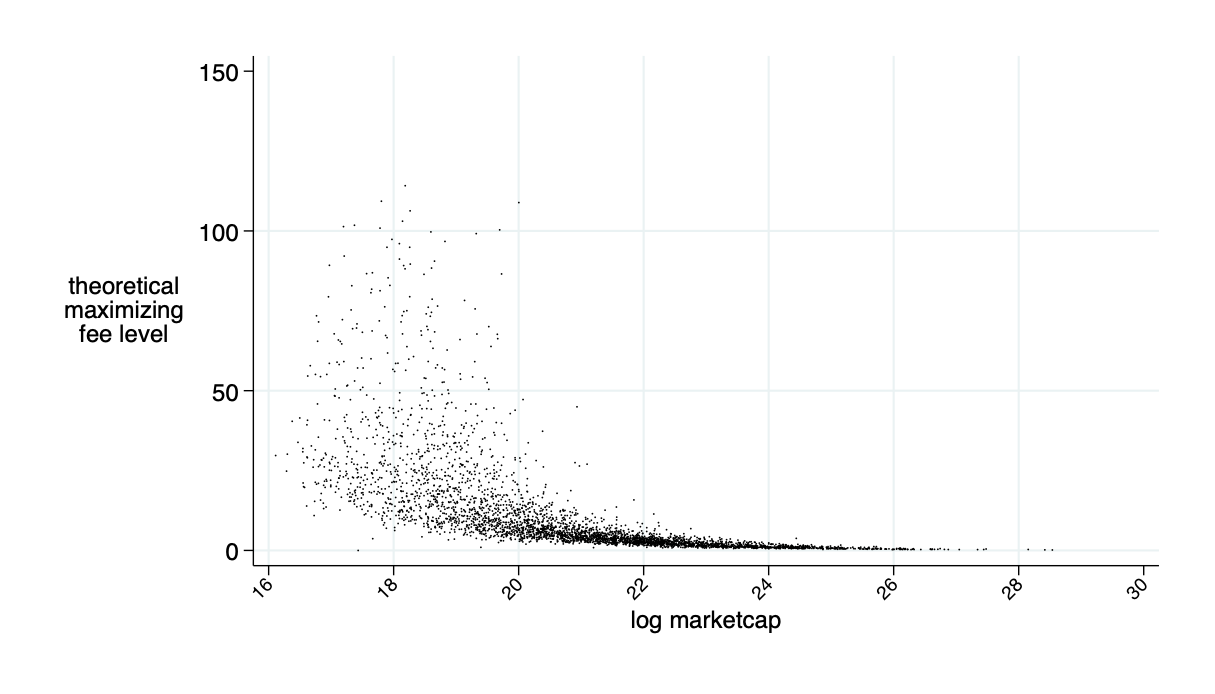
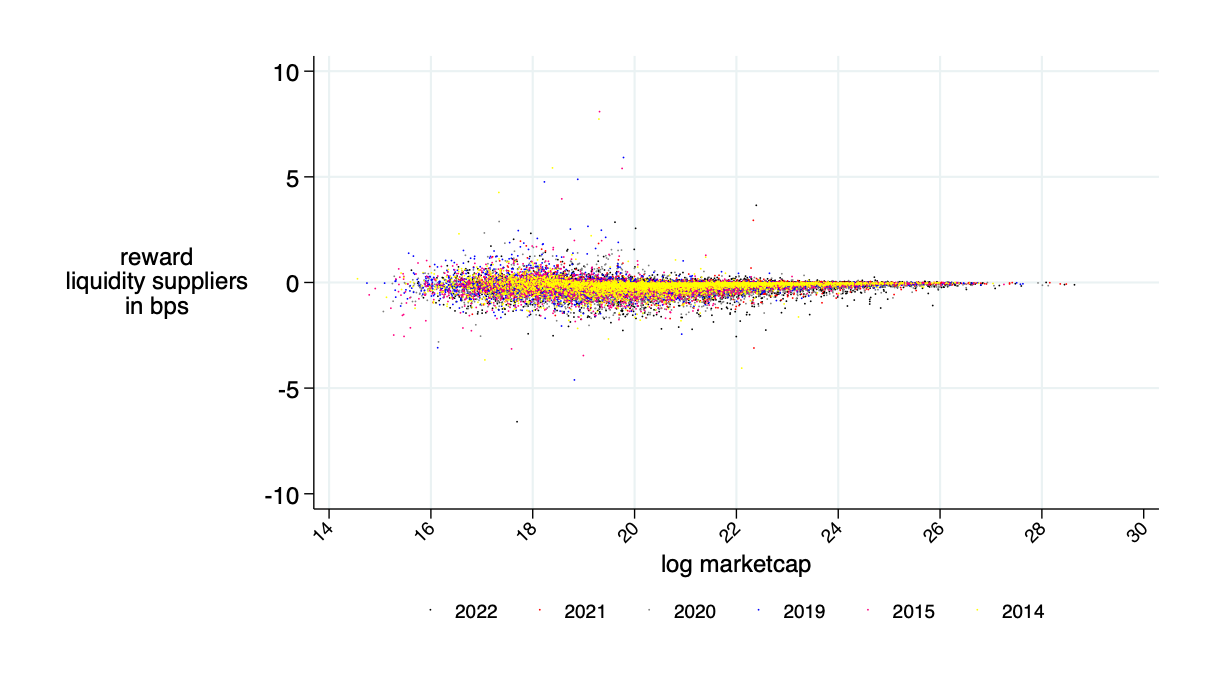
Optimal fee \(F^\pi\)
average benefits liquidity provider in bps (average=0)
Insight: Theory is OK - LP's about break even
\(\overline{\alpha}\) for \(F=F^\pi\)
Need about 10% of market cap in liquidity deposits to make this work
actually needed cash as fraction of "headline" amount
Only need about 5% of the 10% marketcap amount in cash
AMMs are better on about 85% of trading days
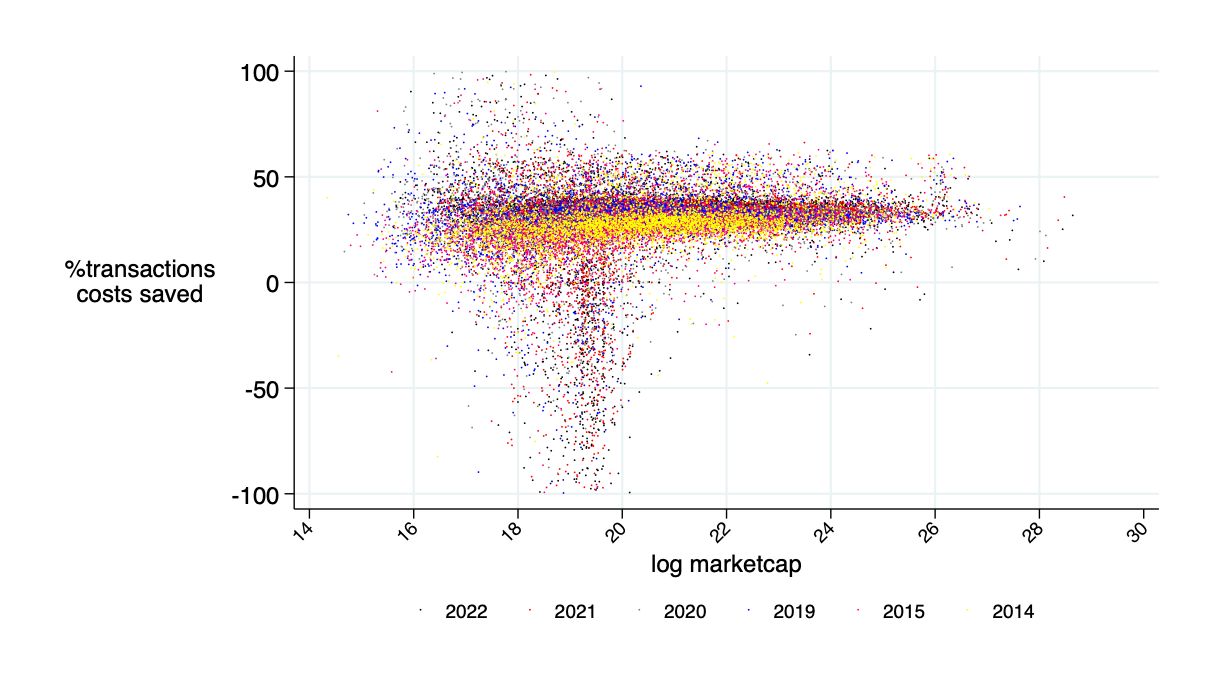
quoted spread minus AMM price impact minus AMM fee (all measured in bps)
relative savings: what fraction of transactions costs would an AMM save? \(\to\) about 30%
theoretical annual savings in transactions costs is about $15B
Literature
AMM Literature: a booming field
Lehar and Parlour (2021): for many parametric configurations, investors prefer AMMs over the limit order market.
Aoyagi and Ito (2021): co-existence of a centralized exchange and an automated market maker; informed traders react non-monotonically to changes in the risky asset’s volatility
Capponi and Jia (2021): price volatility \(\to\) welfare of AMM LPs; conditions for a breakdown of liquidity supply in the automated system; more convex pricing \(\to\) lower arbitrage rents & less trading.
Capponi, Jia, and Wang (2022): decision problems of validators, traders, and MEV bots under the Flashbots protocol.
Park (2021): properties and conceptual challenges for AMM pricing functions
Milionis, Moallemi, Roughgarden, and Zhang (2022): dynamic impermanent loss analysis for under constant product pricing.
Hasbrouck, Rivera, and Saleh (2022): higher fee \(\Rightarrow\) higher volume
Empirics:
Lehar and Parlour (2021): price discovery better on AMMs
Barbon and Ranaldo (2022): compare the liquidity CEX and DEX; argue that DEX prices are less efficient.
@financeUTM
andreas.park@rotman.utoronto.ca
slides.com/ap248
sites.google.com/site/parkandreas/
youtube.com/user/andreaspark2812/
By Katya Malinova
WBS Gilmore


