Data Visualization
From Complex Academic Projects to Primary Education
Benjamin E. Lind, Ph.D. (lind.benjamin@gmail.com)
Educational Support Staff
Anglo-American School of St. Petersburg


Data Stories, 23 January 2017
Center for Network Science, Central European University
Background
In Brief


Be Mindful of the Audience
Current Research Projects

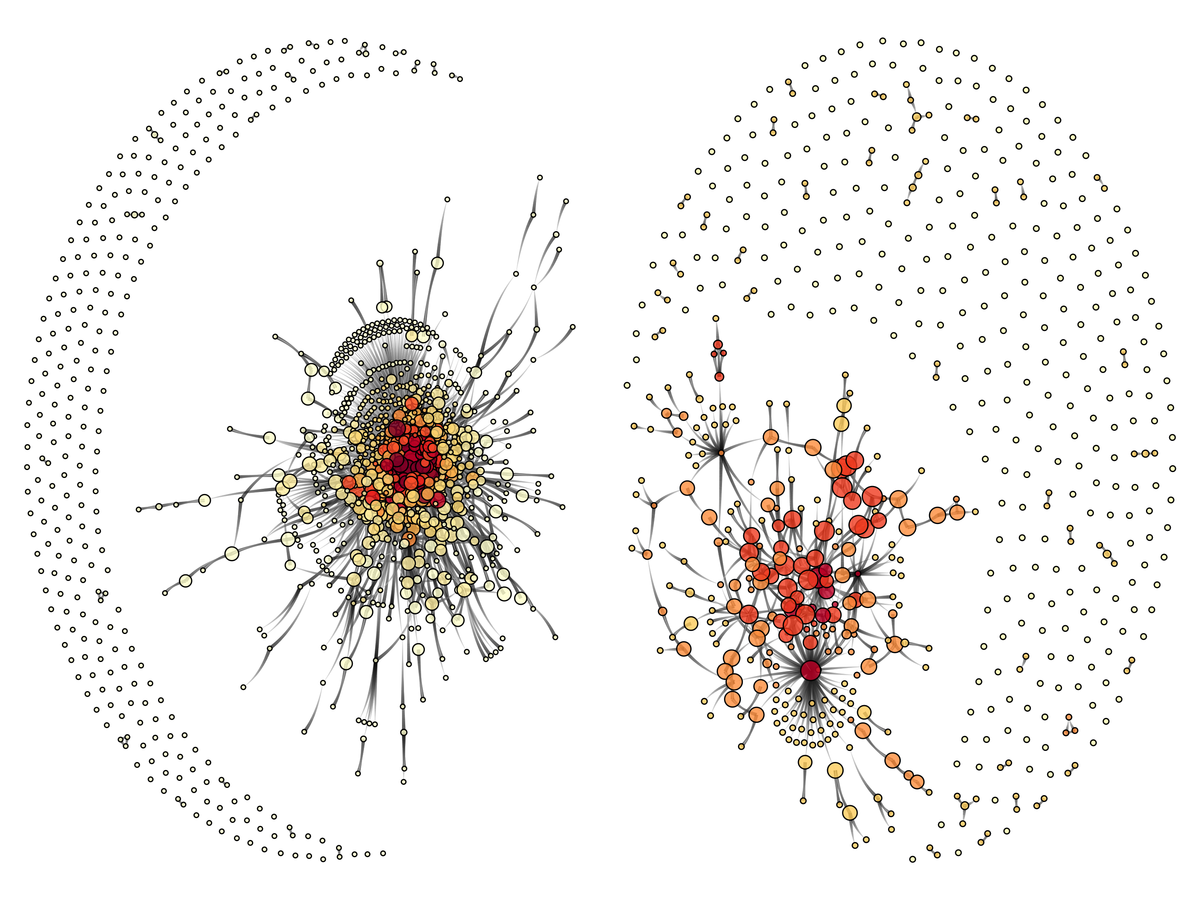
Two-Mode Network Portraying Ties between Musicians and Albums
September 15, 2012. 2-10pm.
September 21, 2012. 2-10pm.
Comparison of Geo-Tagged Twitter Users at a Protest Site.
Protest
No Protest
Typical Follow-Up Discussions
- "Nice-looking plots!"
- "How'd you do that?"
- "I really need to learn R."
Untypical Follow-Up Discussions
- Implications of the findings.
- The visualization's role in the research.
A Moment for Reflection
- "Is the problem in my presentation?" - Perhaps
- "Who is this visualization useful for?"
Simplifying Academic Speak, A Quick Story
Model Choice Explanation
Lind and Stepan-Norris. 2011. AJS.
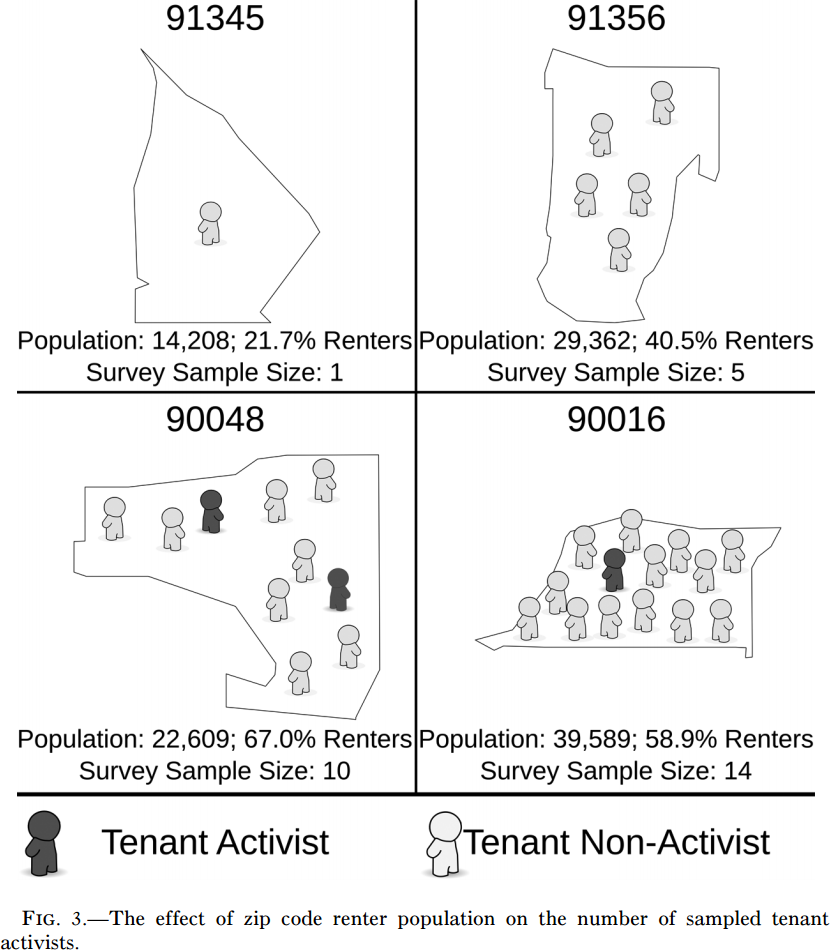
Why don't you just use a Poisson or negative binomial model?
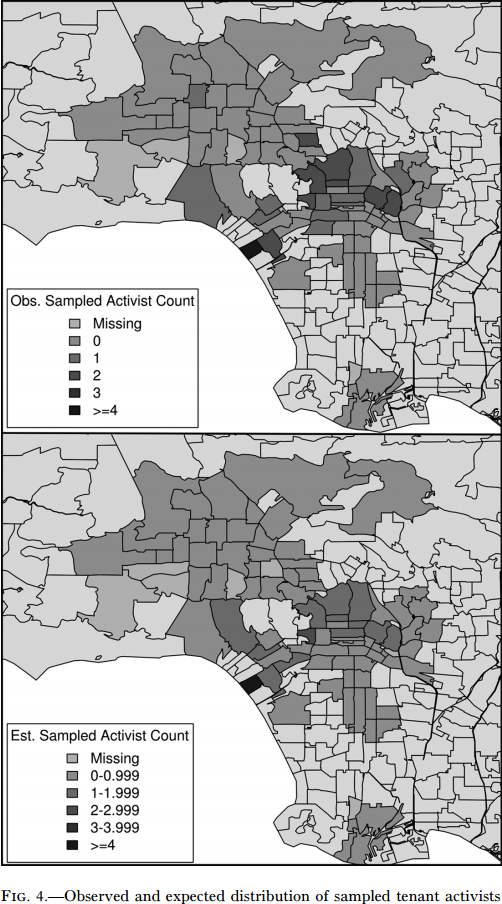
It needs a map.
Lind and Stepan-Norris. 2011. AJS.
When can we get one of those 'network maps?'
I'm going to be honest, I just want to learn about networks to make the pictures.
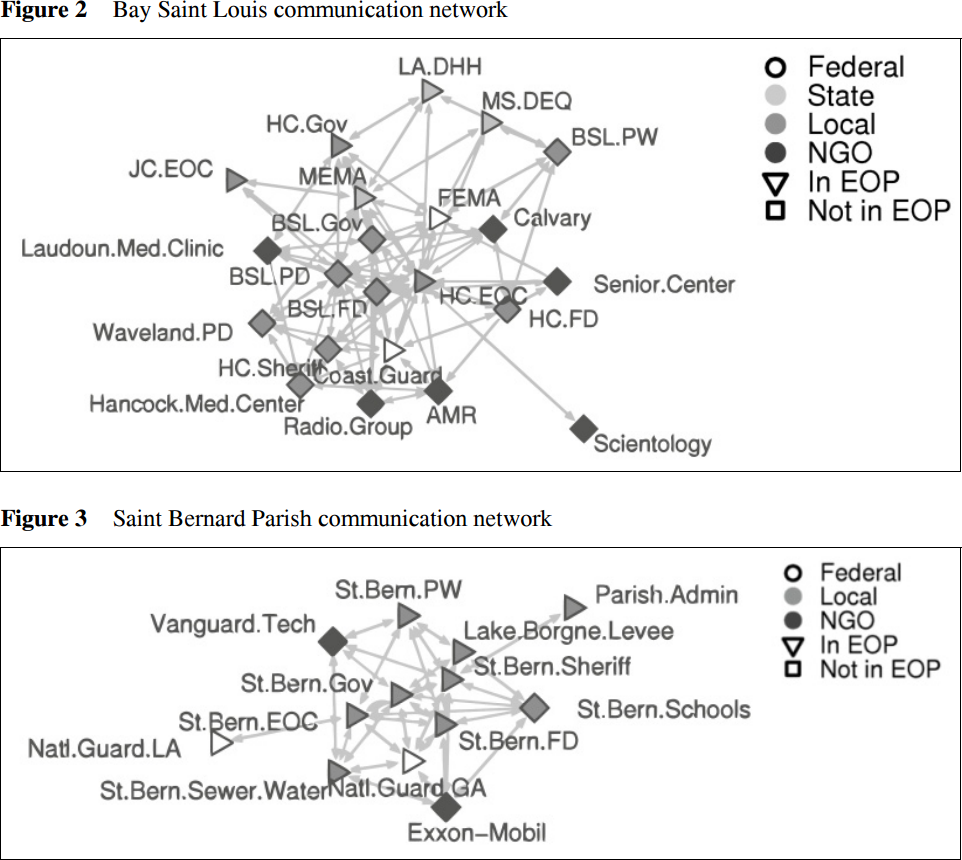
Lind et al. 2008. IJEM.
Intrinsic Aesthetic Appeal
- Pleasure experienced from visualizations, regardless of meaning, interpretation, or explanation.
- More attractive and elegant than text.
- "Wow factor" and caution.
- Exploratory point-and-click software.
- Need for restraint and emphasis on narrative.
- Matter of conventional expectation, questionable purpose.
- Value in familiarity.
International Academia
Teaching Data Visualization
Difficulties
- Statistical familiarity, computer literacy and programming
- Challenge to advance without basic background
- Comparable to most students everywhere
- Encourage "Wizard + Image Editor" approach initially
- Less intimidating than command-line software
- Other difficulties teaching point-and-click software
- Language
- Grammar of Graphics
- E.g., "facets," "geoms," "aesthetic mappings," etc.
- Tufte much more approachable
- Better illustrations
- Direct social applications
- Grammar of Graphics
Zeeman 1976:67 reproduced in Tufte 2001:50

Qualitative Example
- Example understood by math-scared students
- Could easily explain in a foreign language
Editing Visualizations

- Students appreciated the de-mystification.
- Never before considered editing.
- Ultimately lost on the statistics.
Editorial Work
Working Paper Series as "Pre-Publication" Guidance
- Uphill battle for Russians to publish internationally.
- Language issues.
- Unfamiliar with editors, review process, conventions.
- Quality visualizations are crucial!
- Easier feedback than on writing.
- Signaling effect upon future reviewers.
- Common stumbling blocks
- Editing figures as a novel idea (like undergraduates).
- Lack of background knowledge and experience.
- Format and labeling.
Particulars
- English language issues
- Pre-requisite knowledge on international conventions
- Clarity in visuals when lacking language skills
Universals
- Statistical and computational literacy
- Background in graphical know-how and experience
- Editing visualizations
Primary and Secondary Education
How do students learn about the portrayal of quantitative information?
What level of literacy can we expect from general audiences?
General Knowledge (GK) Test
Florida Teacher Certification Examinations/Florida Educational Leadership Examination
- Required for all certified Florida teachers
- Mathematics test includes items on
- Bar charts
- Line charts
- Tables
Pre-K through Grade 12 Data Visualization Training
- Unconsciously teaching students data visualization
- Teachers unfamiliar with basic terminology
- Often included within lessons on other subject matter
Human Geography
High School
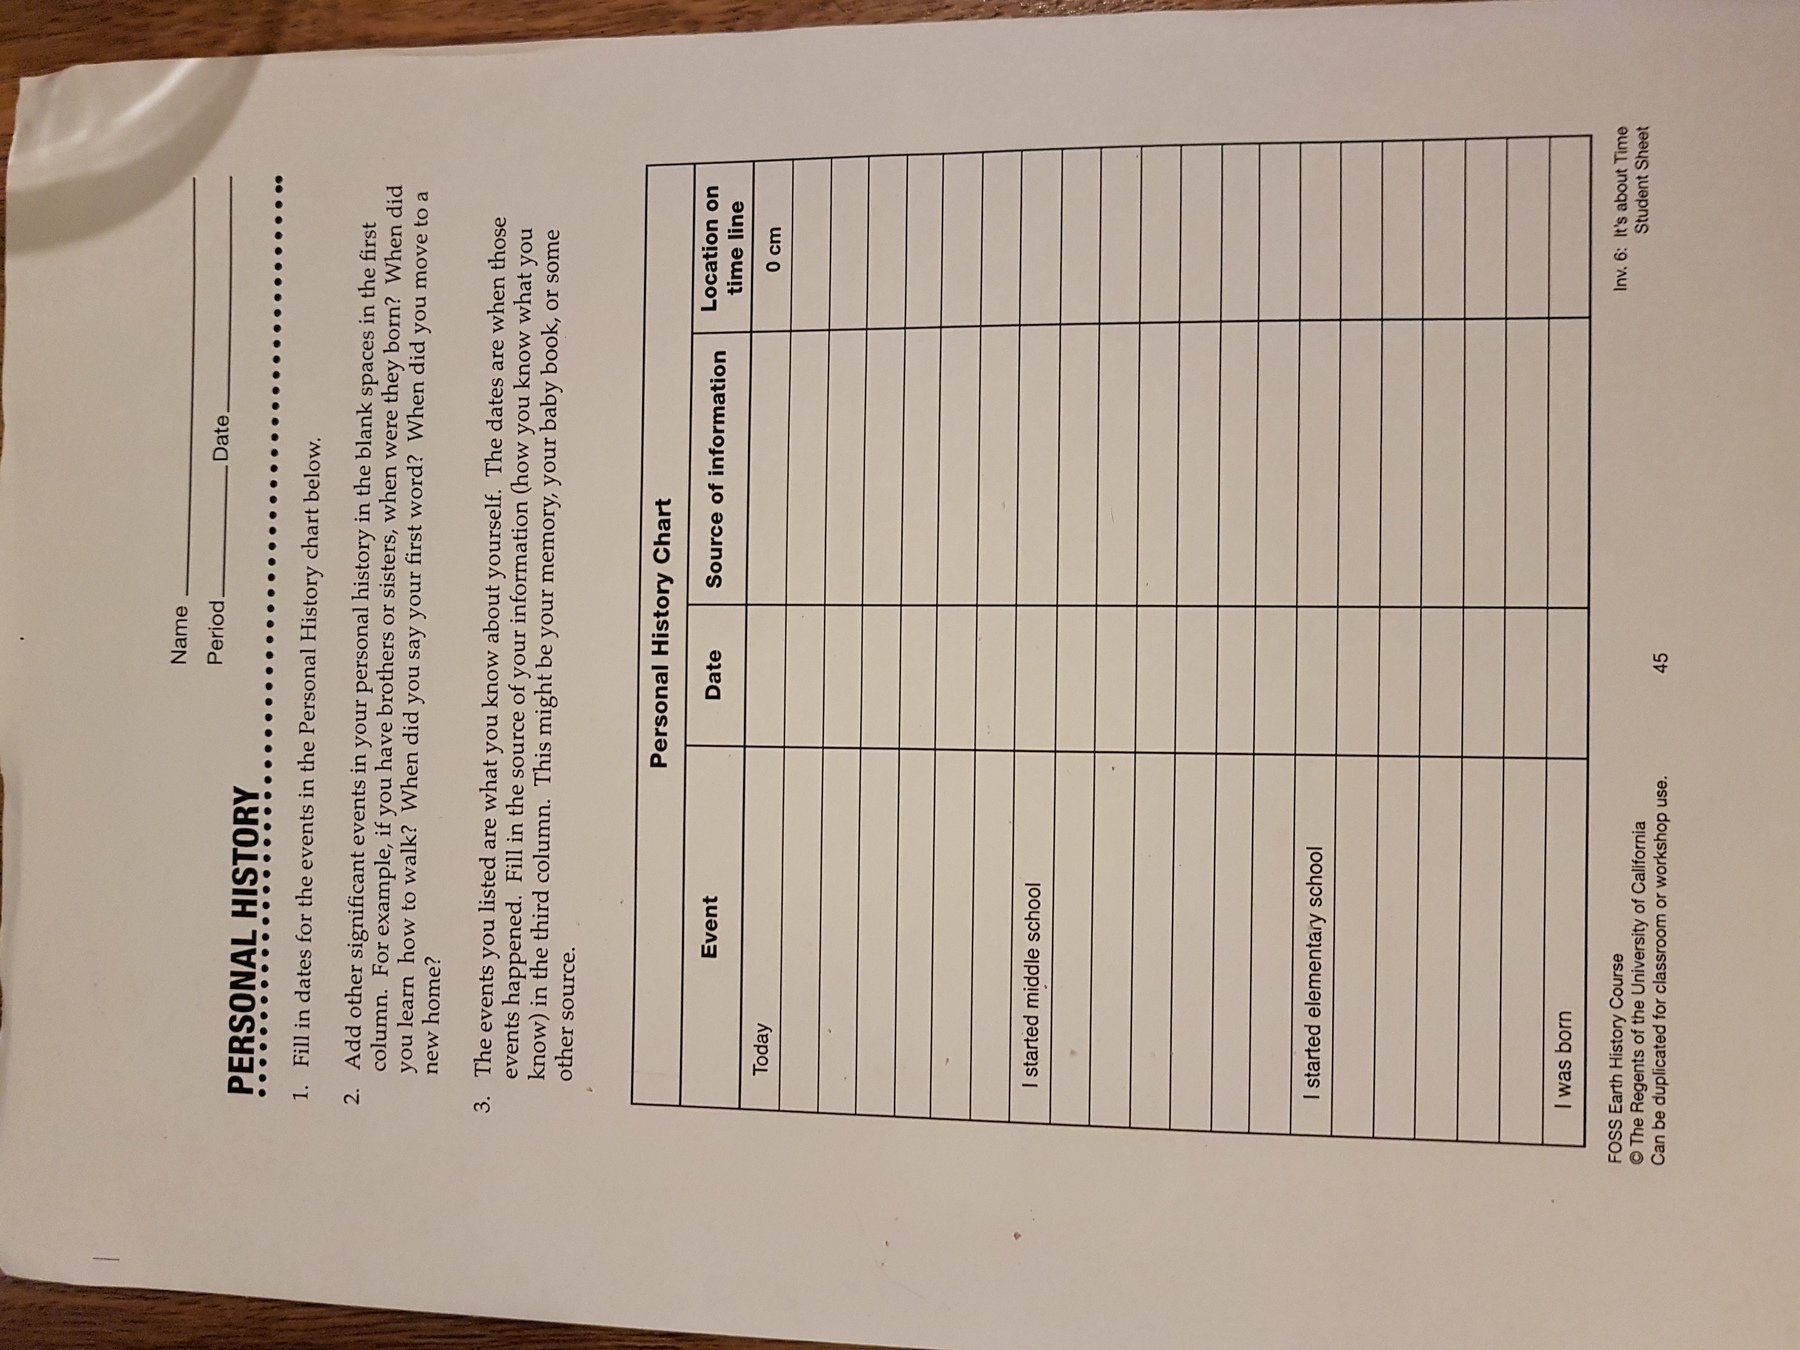
Timelines
Sixth Grade Science
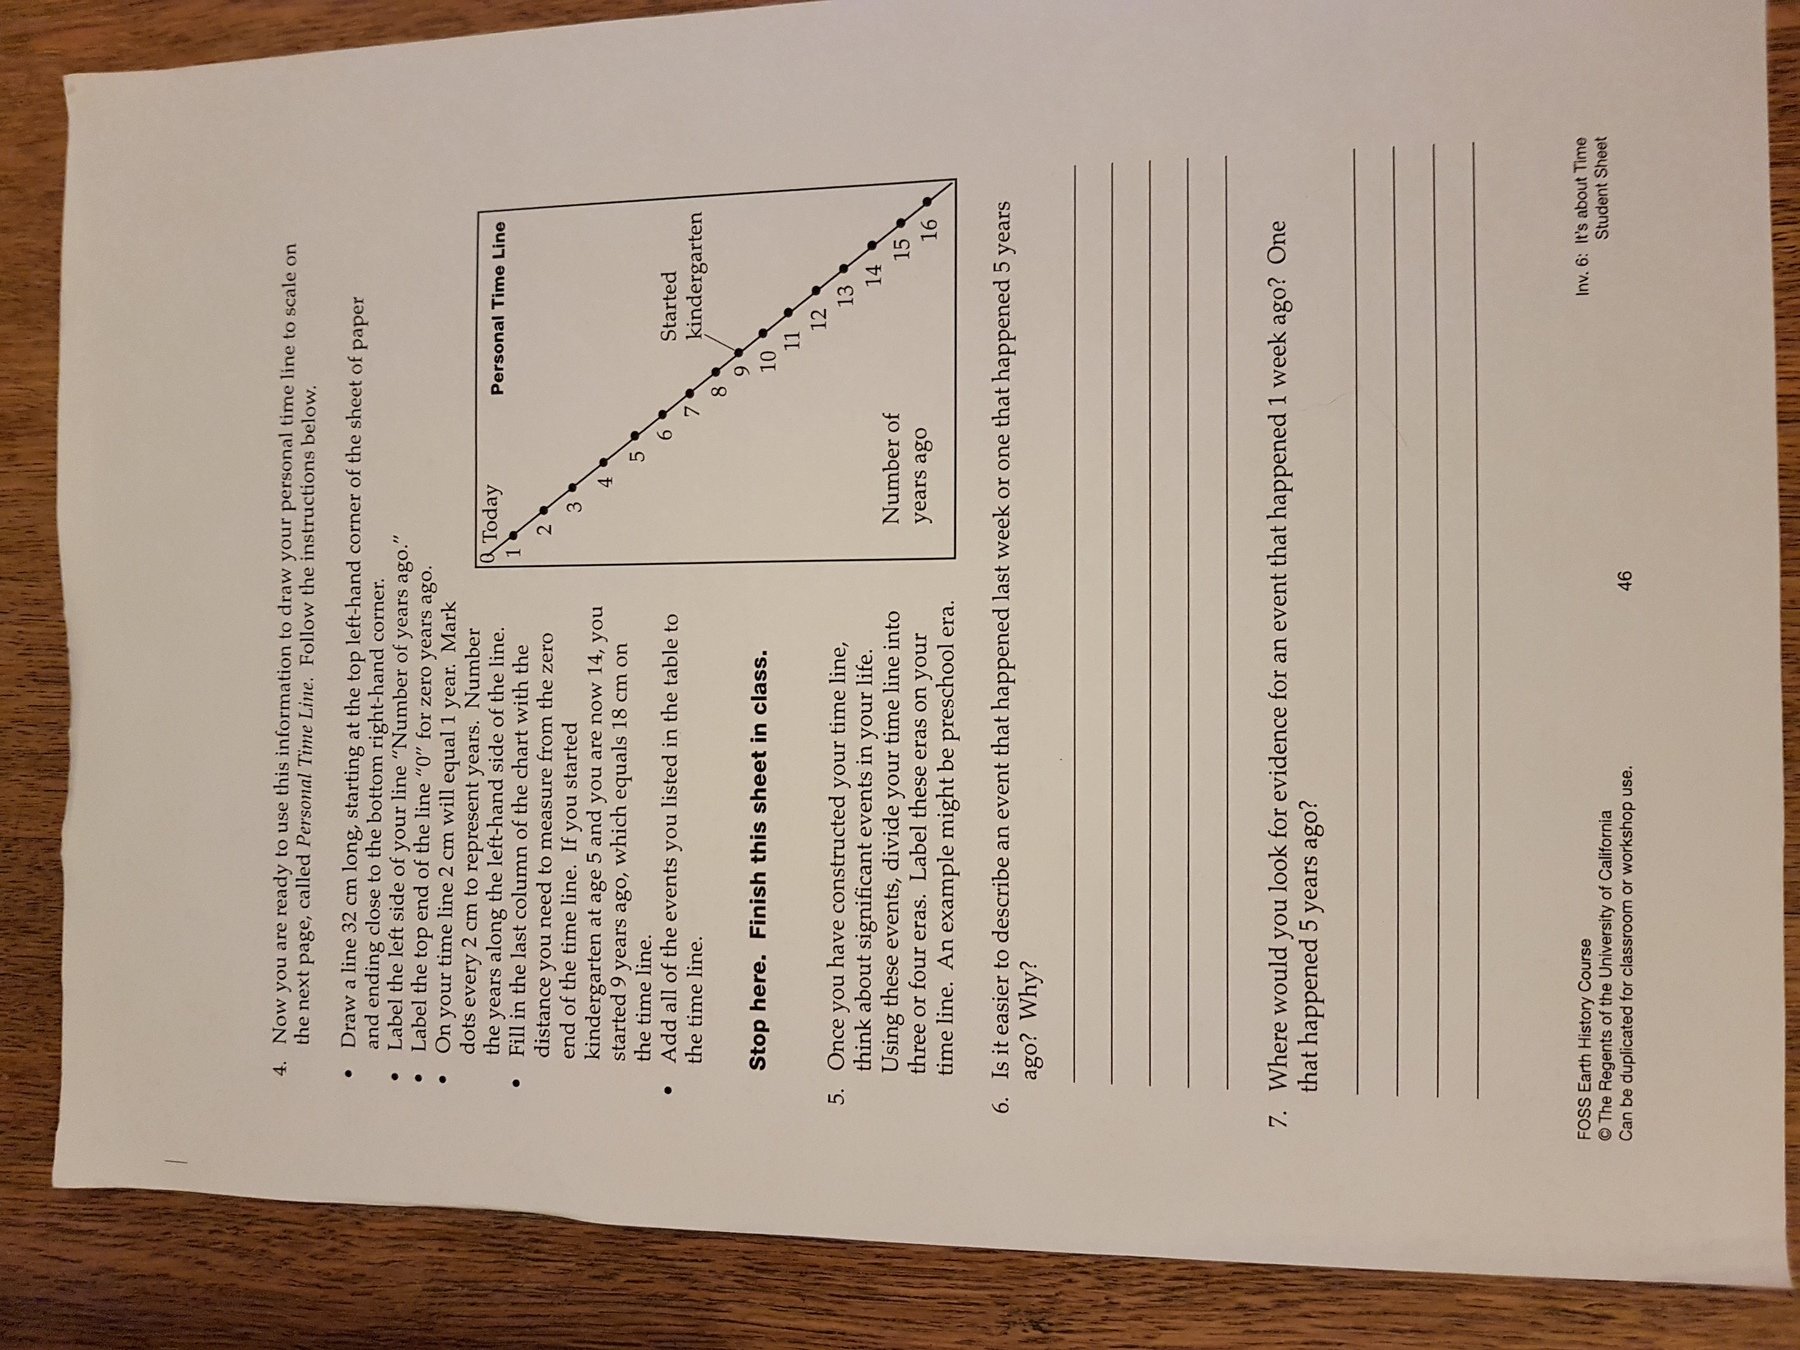
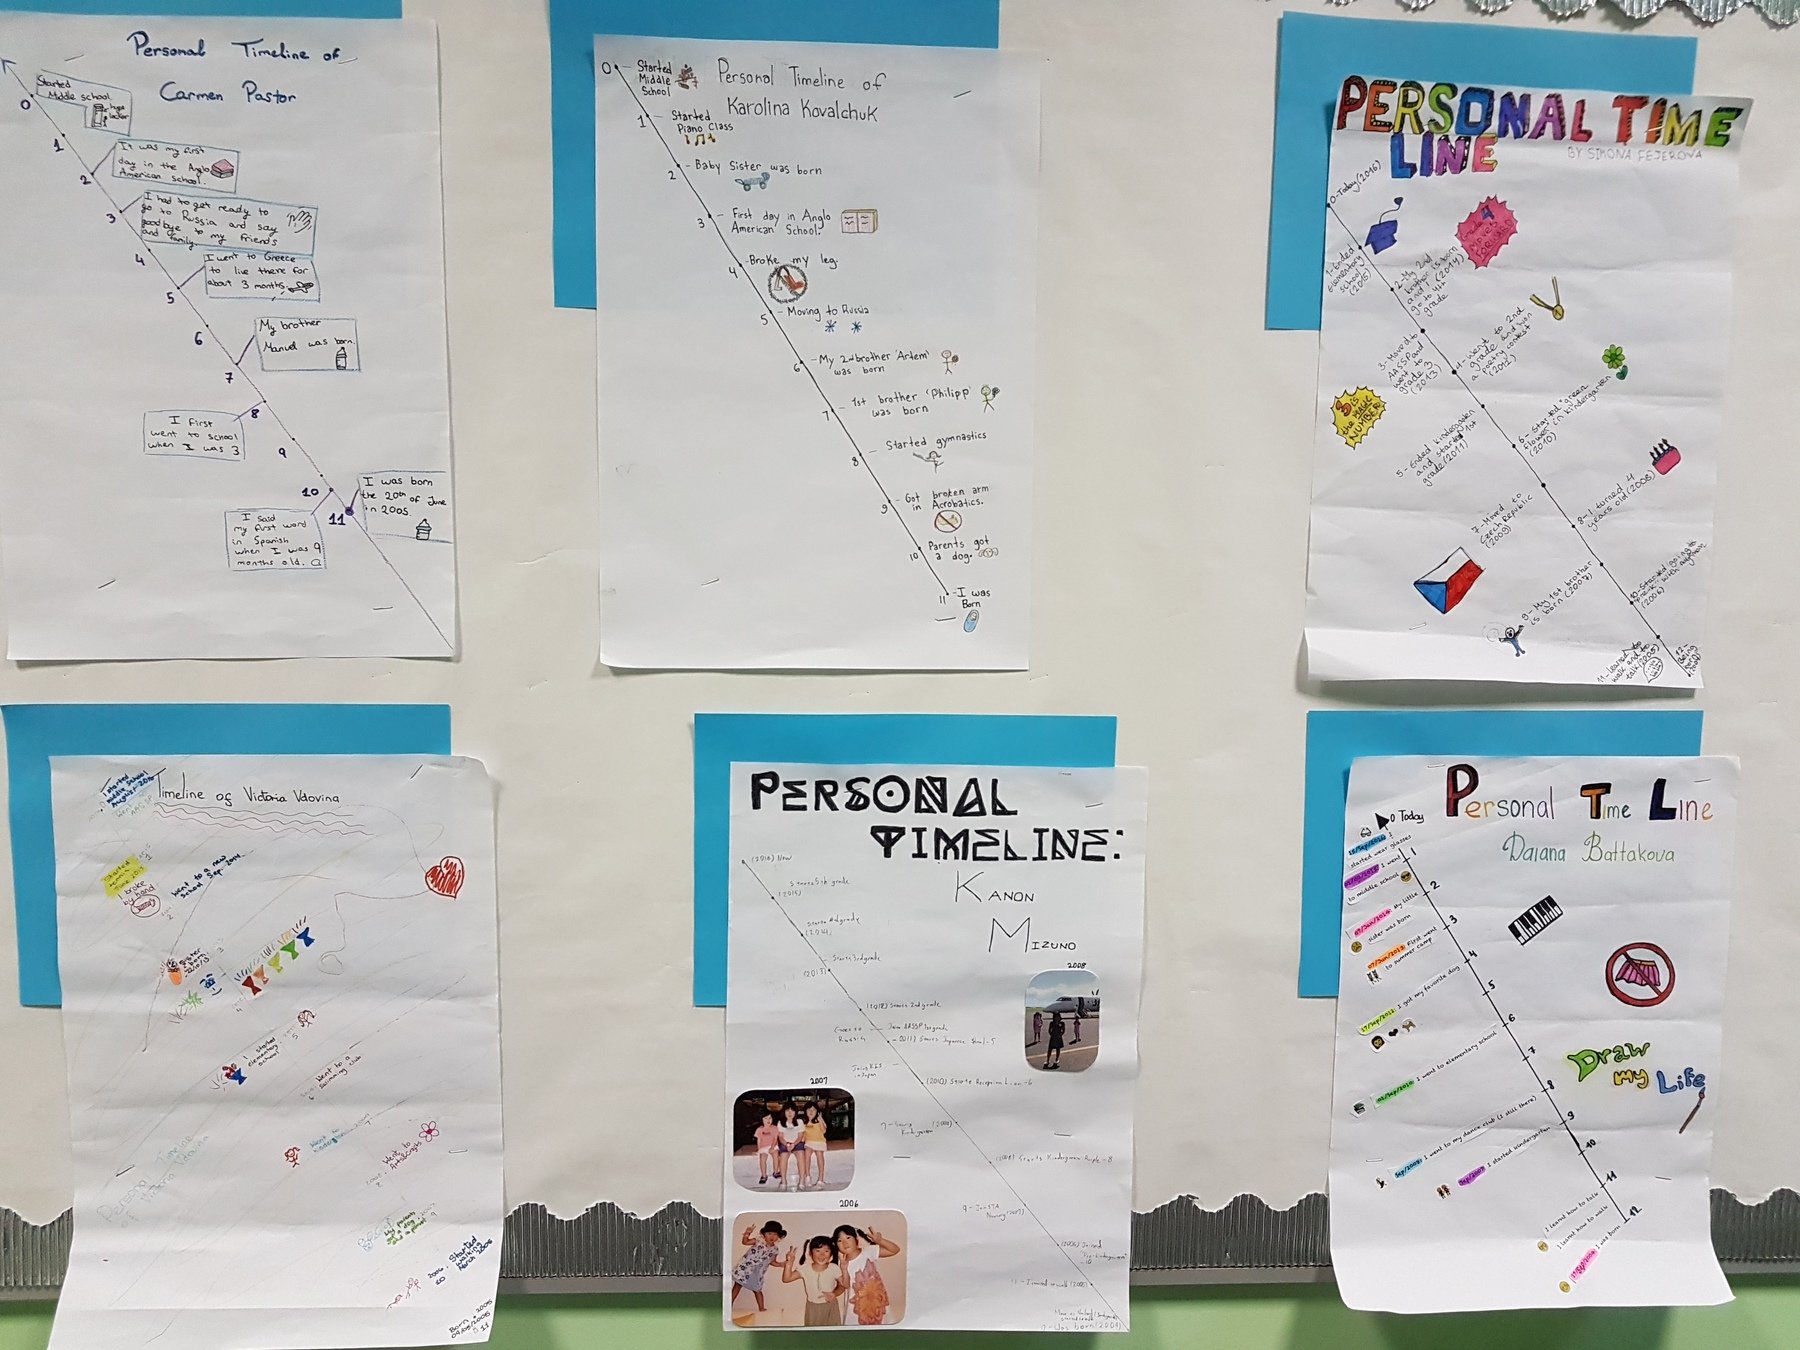
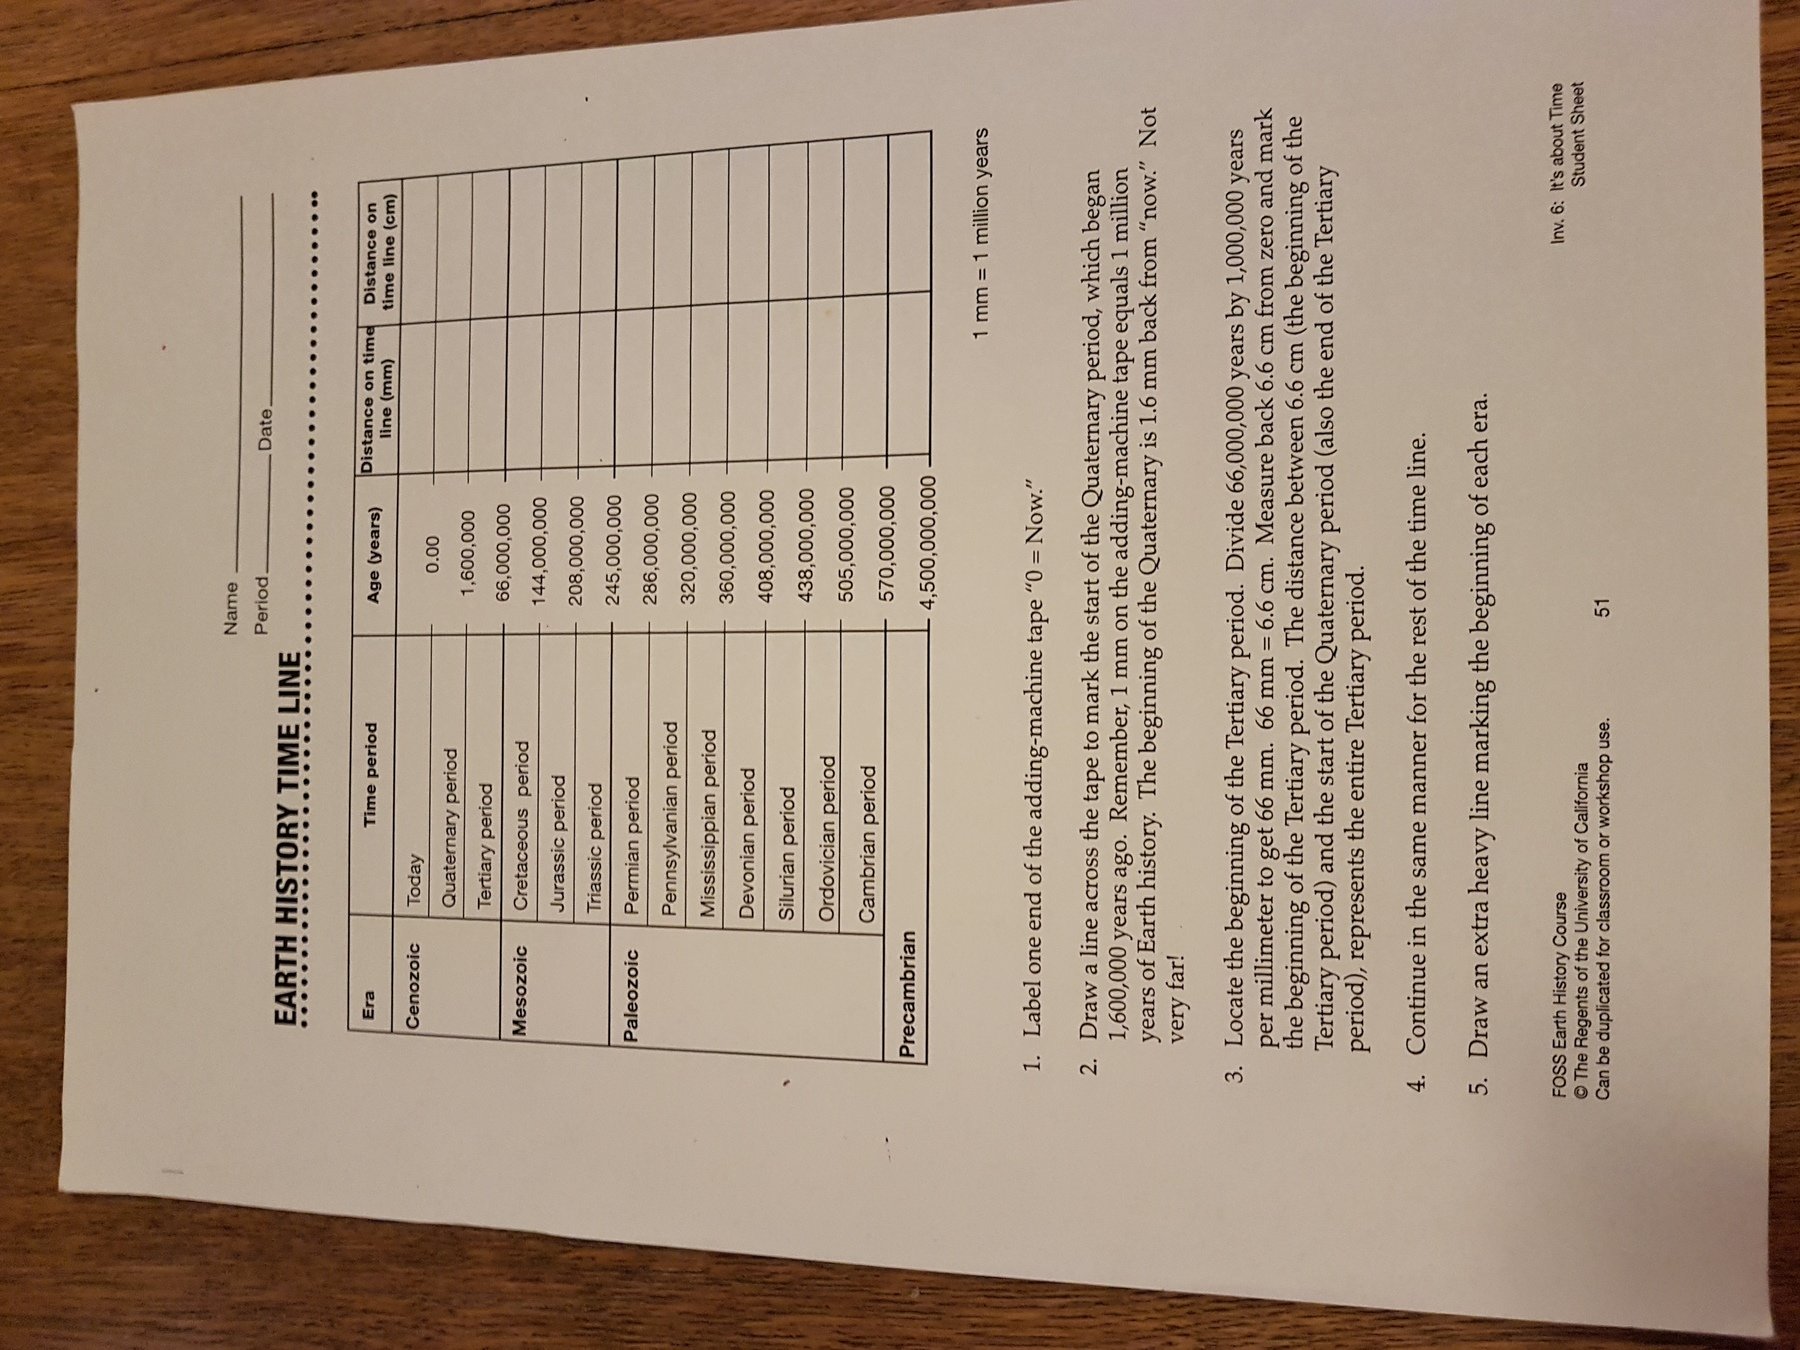
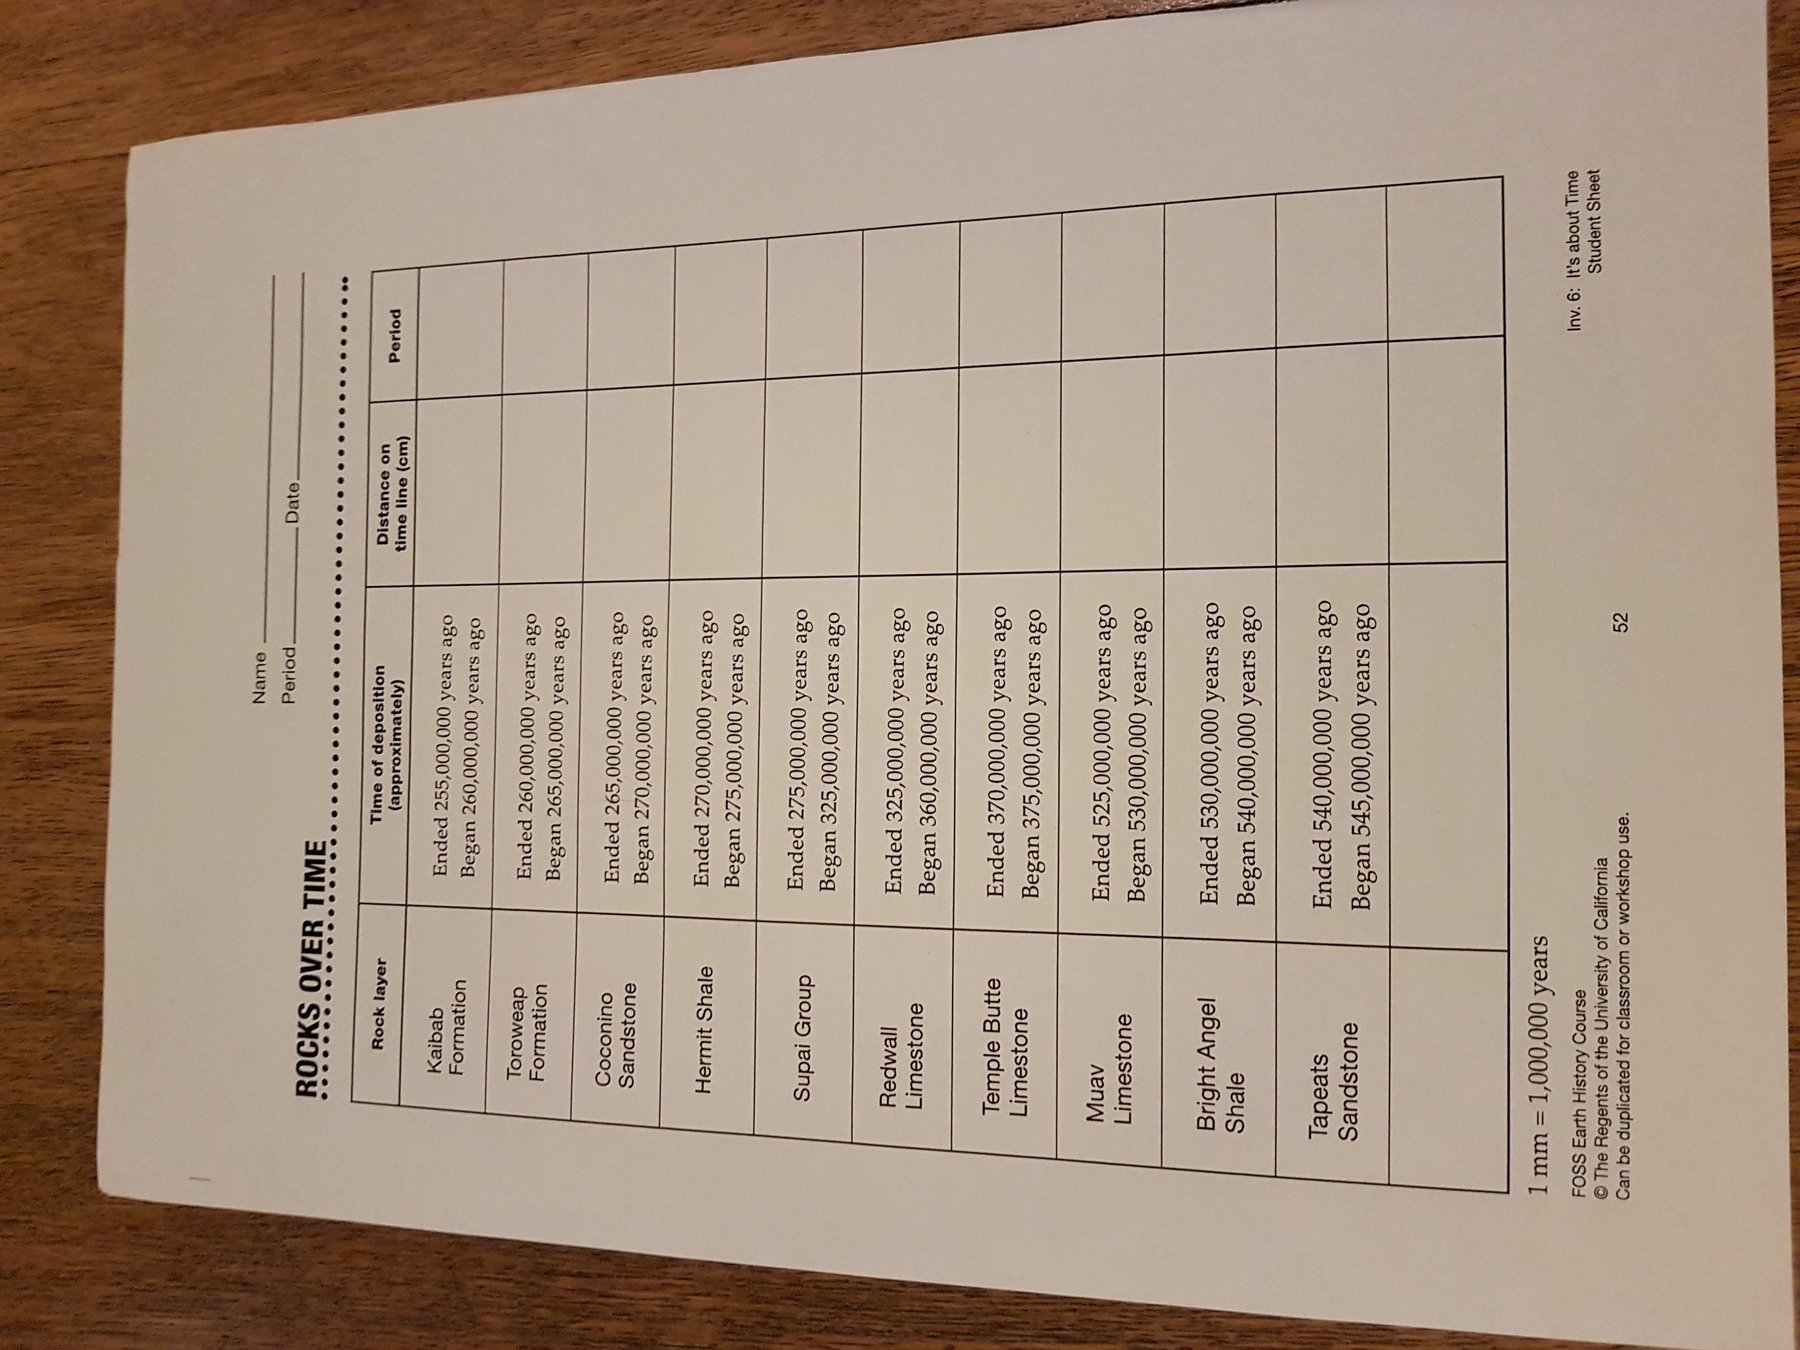
Timelines
Sixth Grade Science
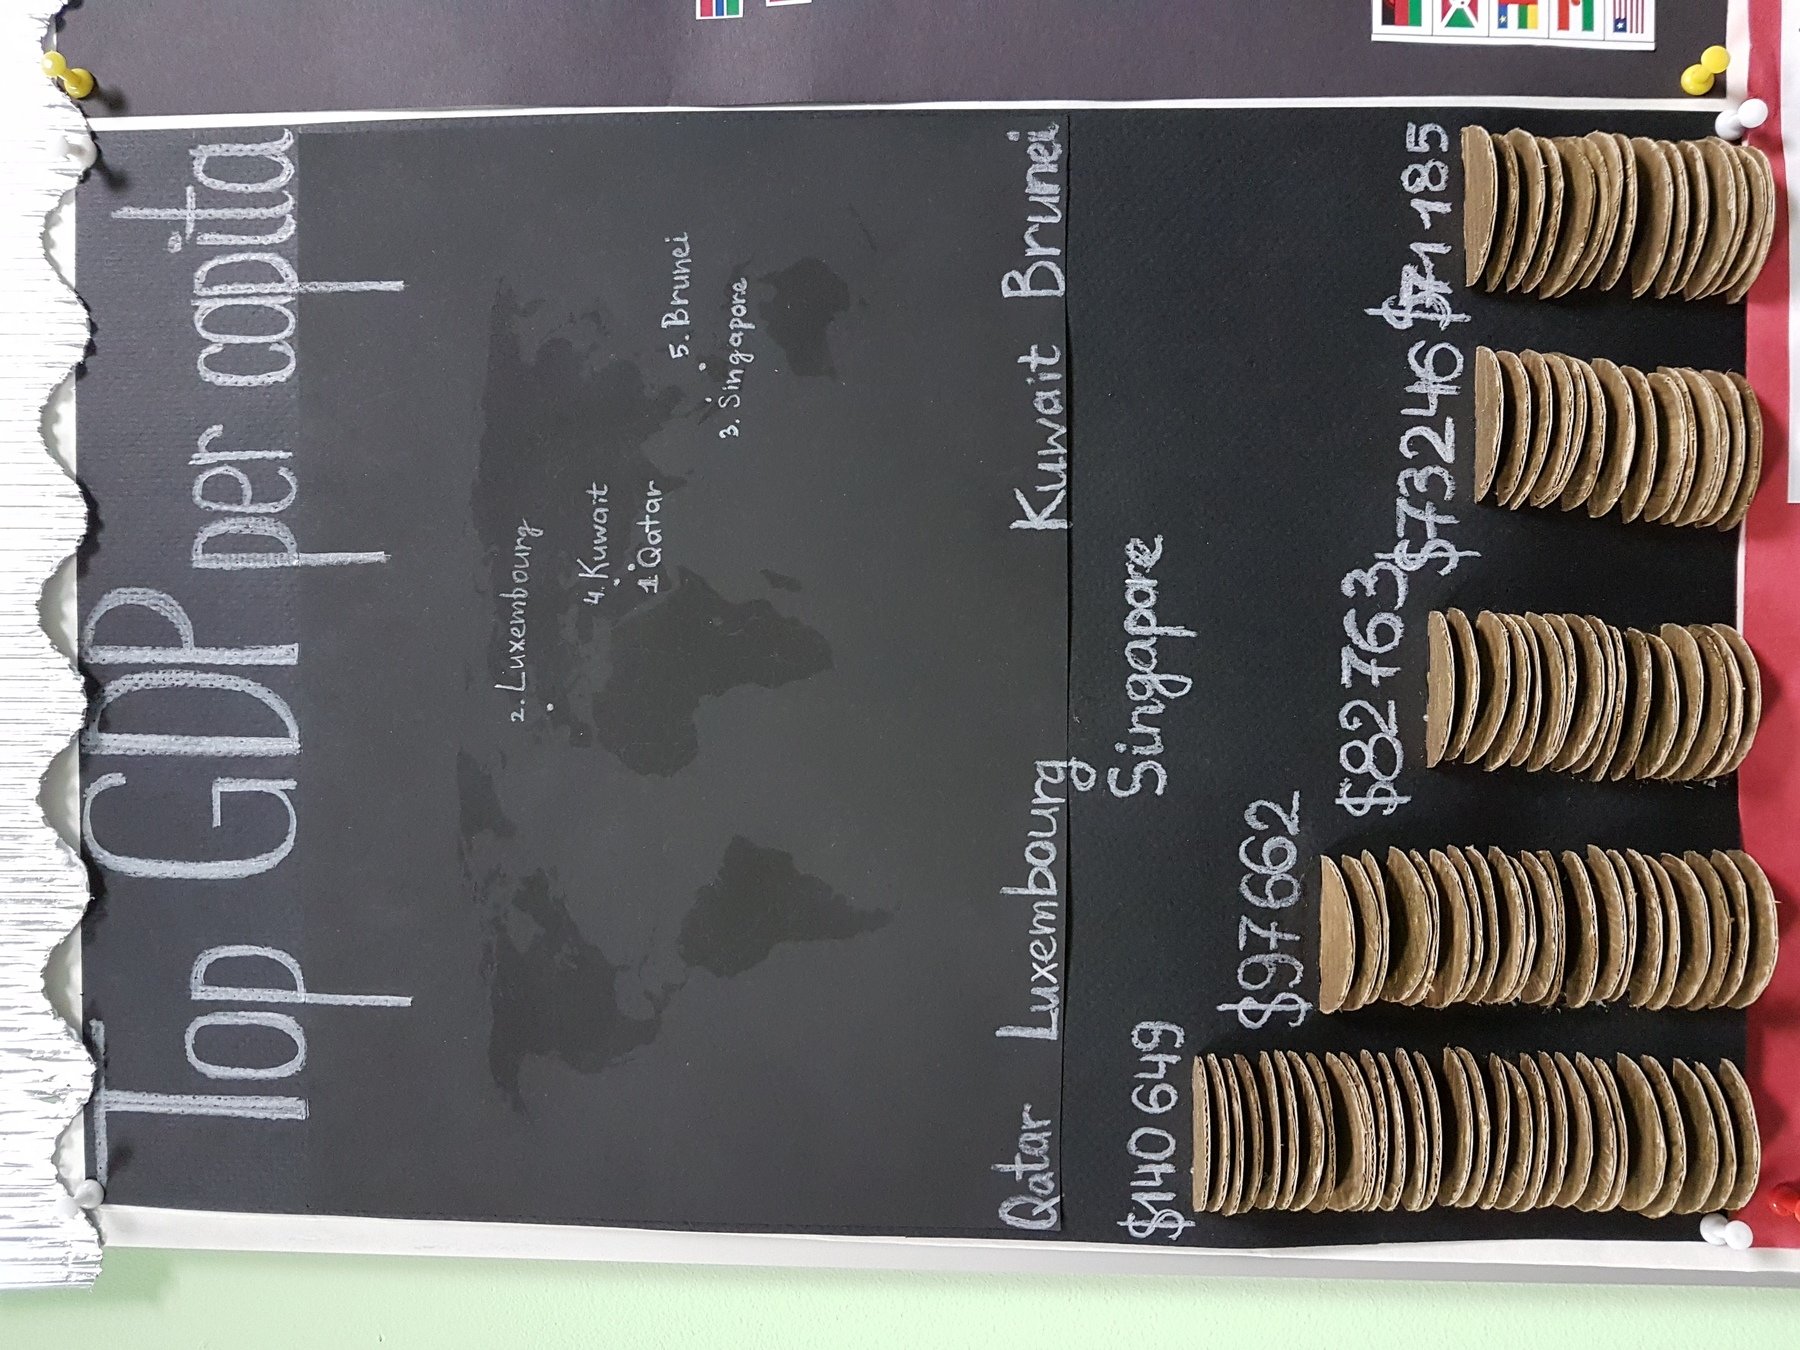
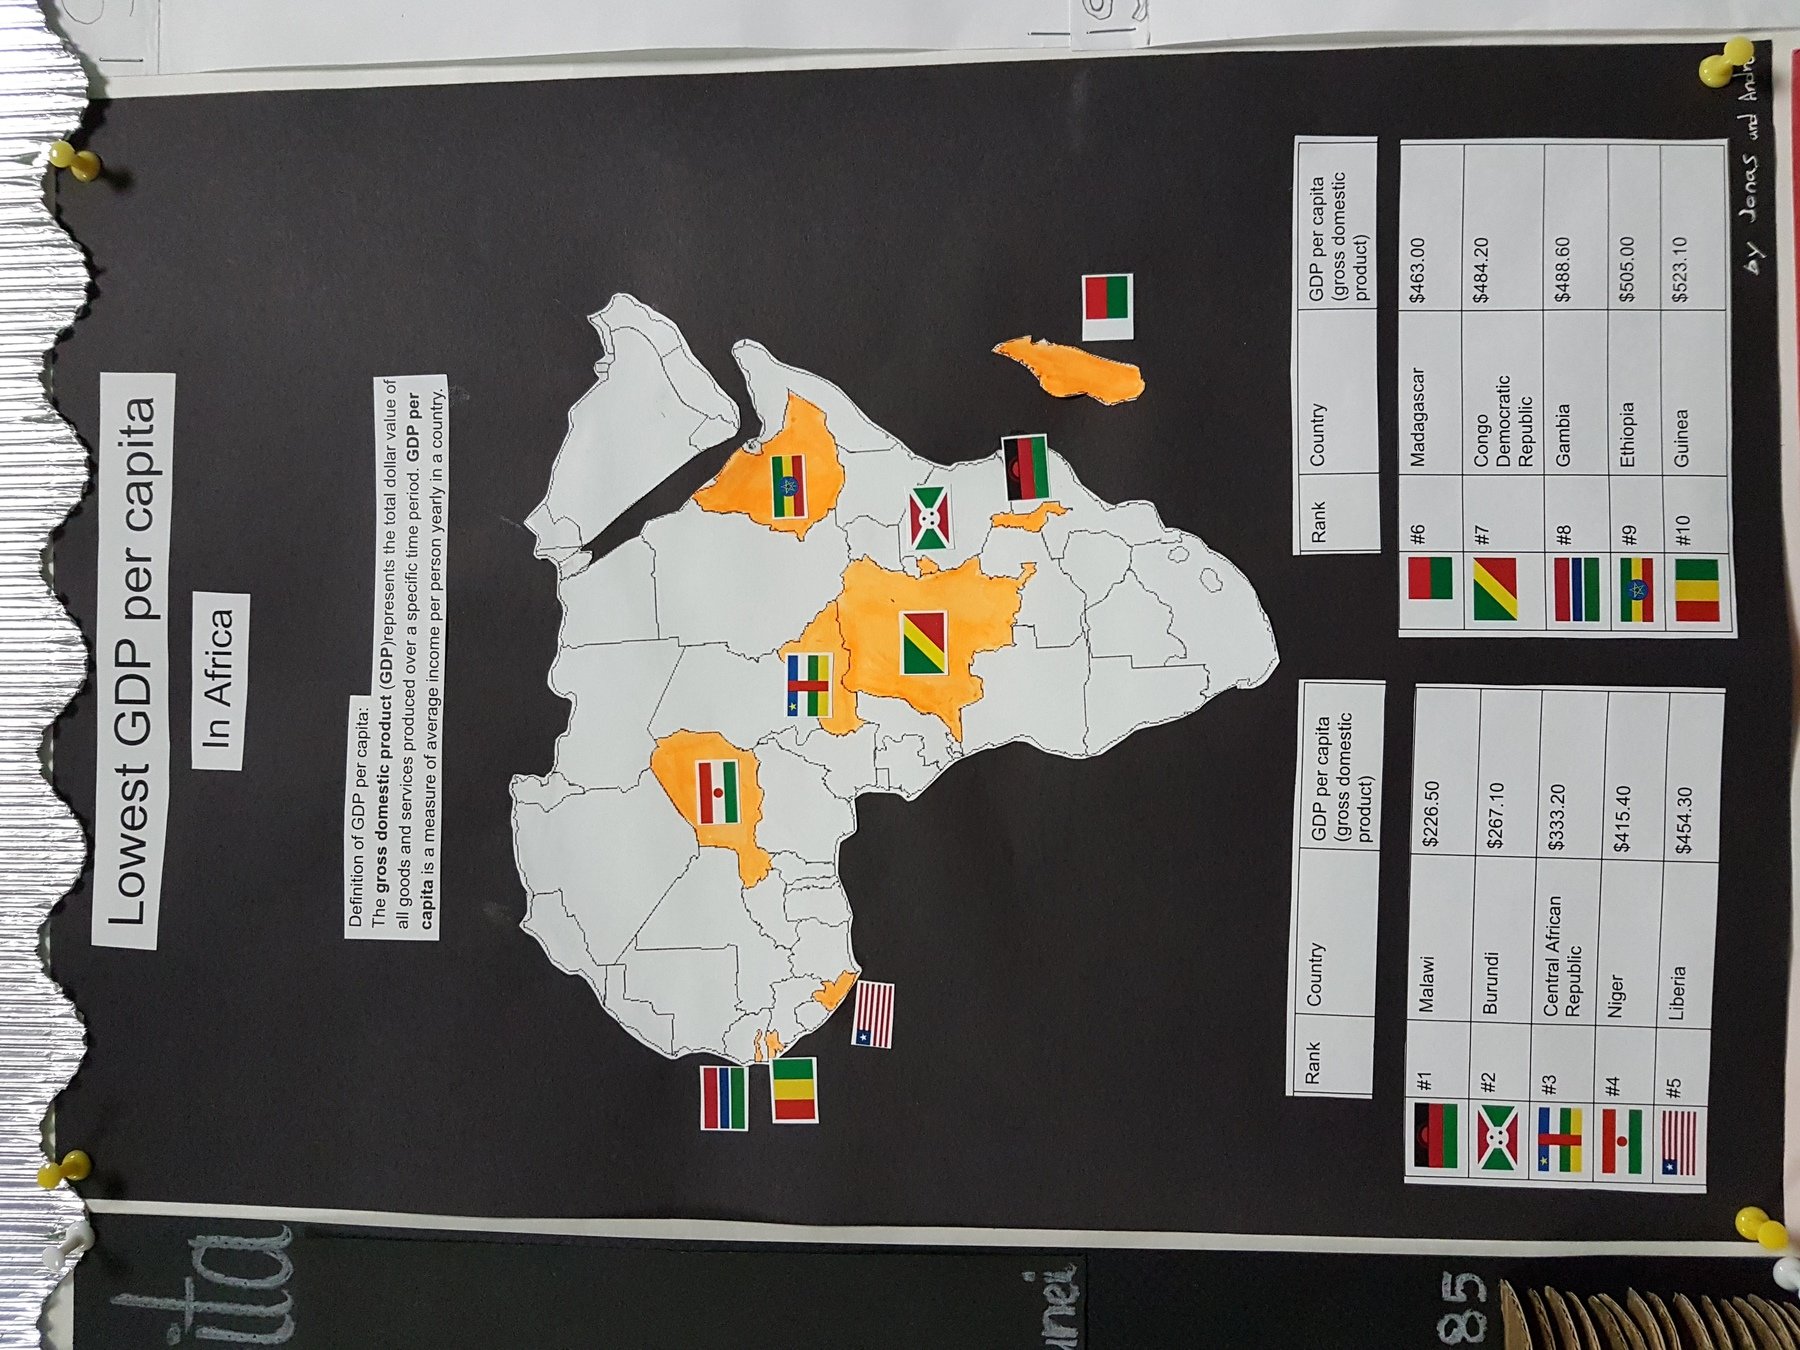
Pre-Kindergarten
Learning to Count
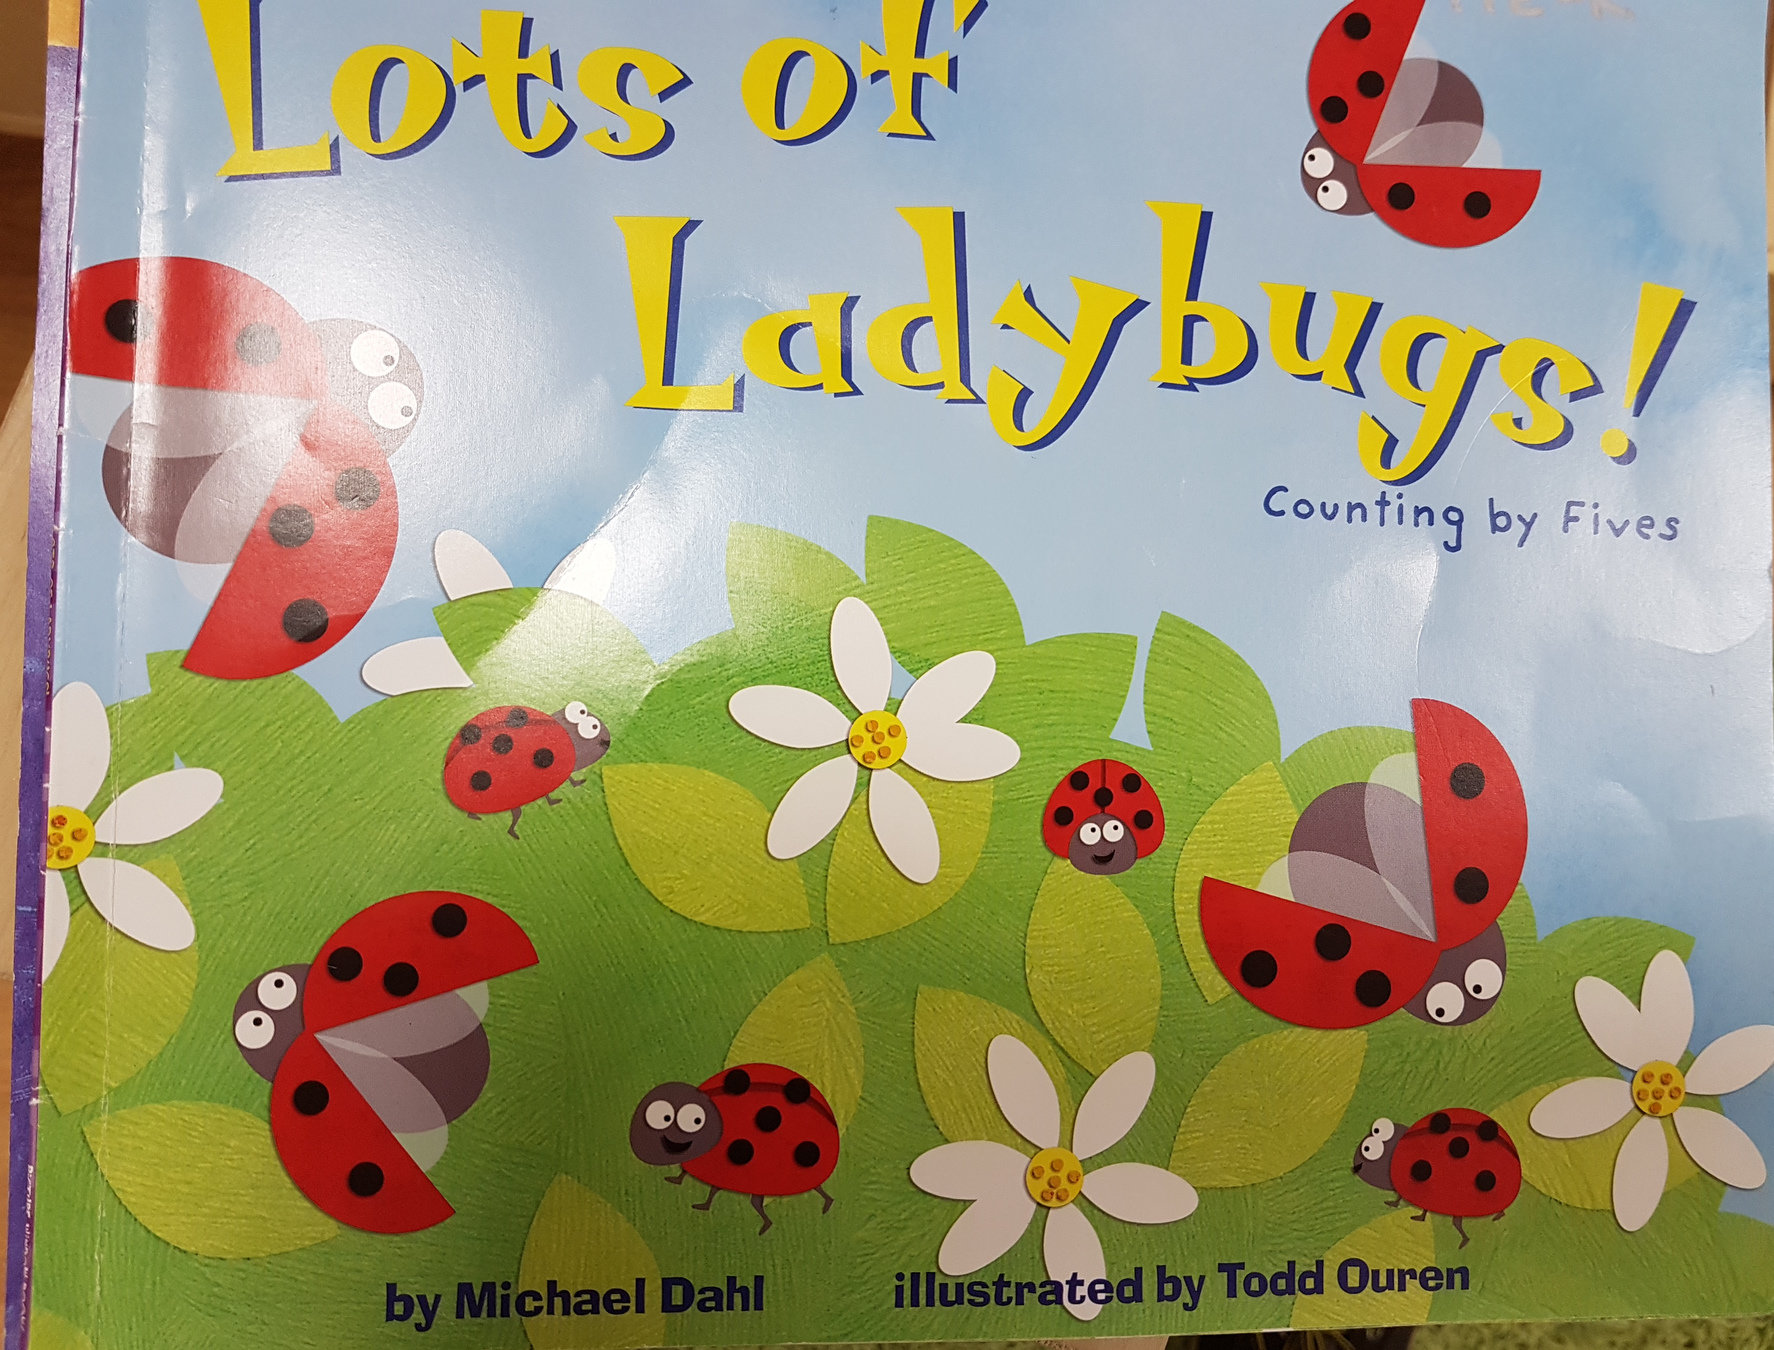

Pre-Kindergarten
Learning to Count
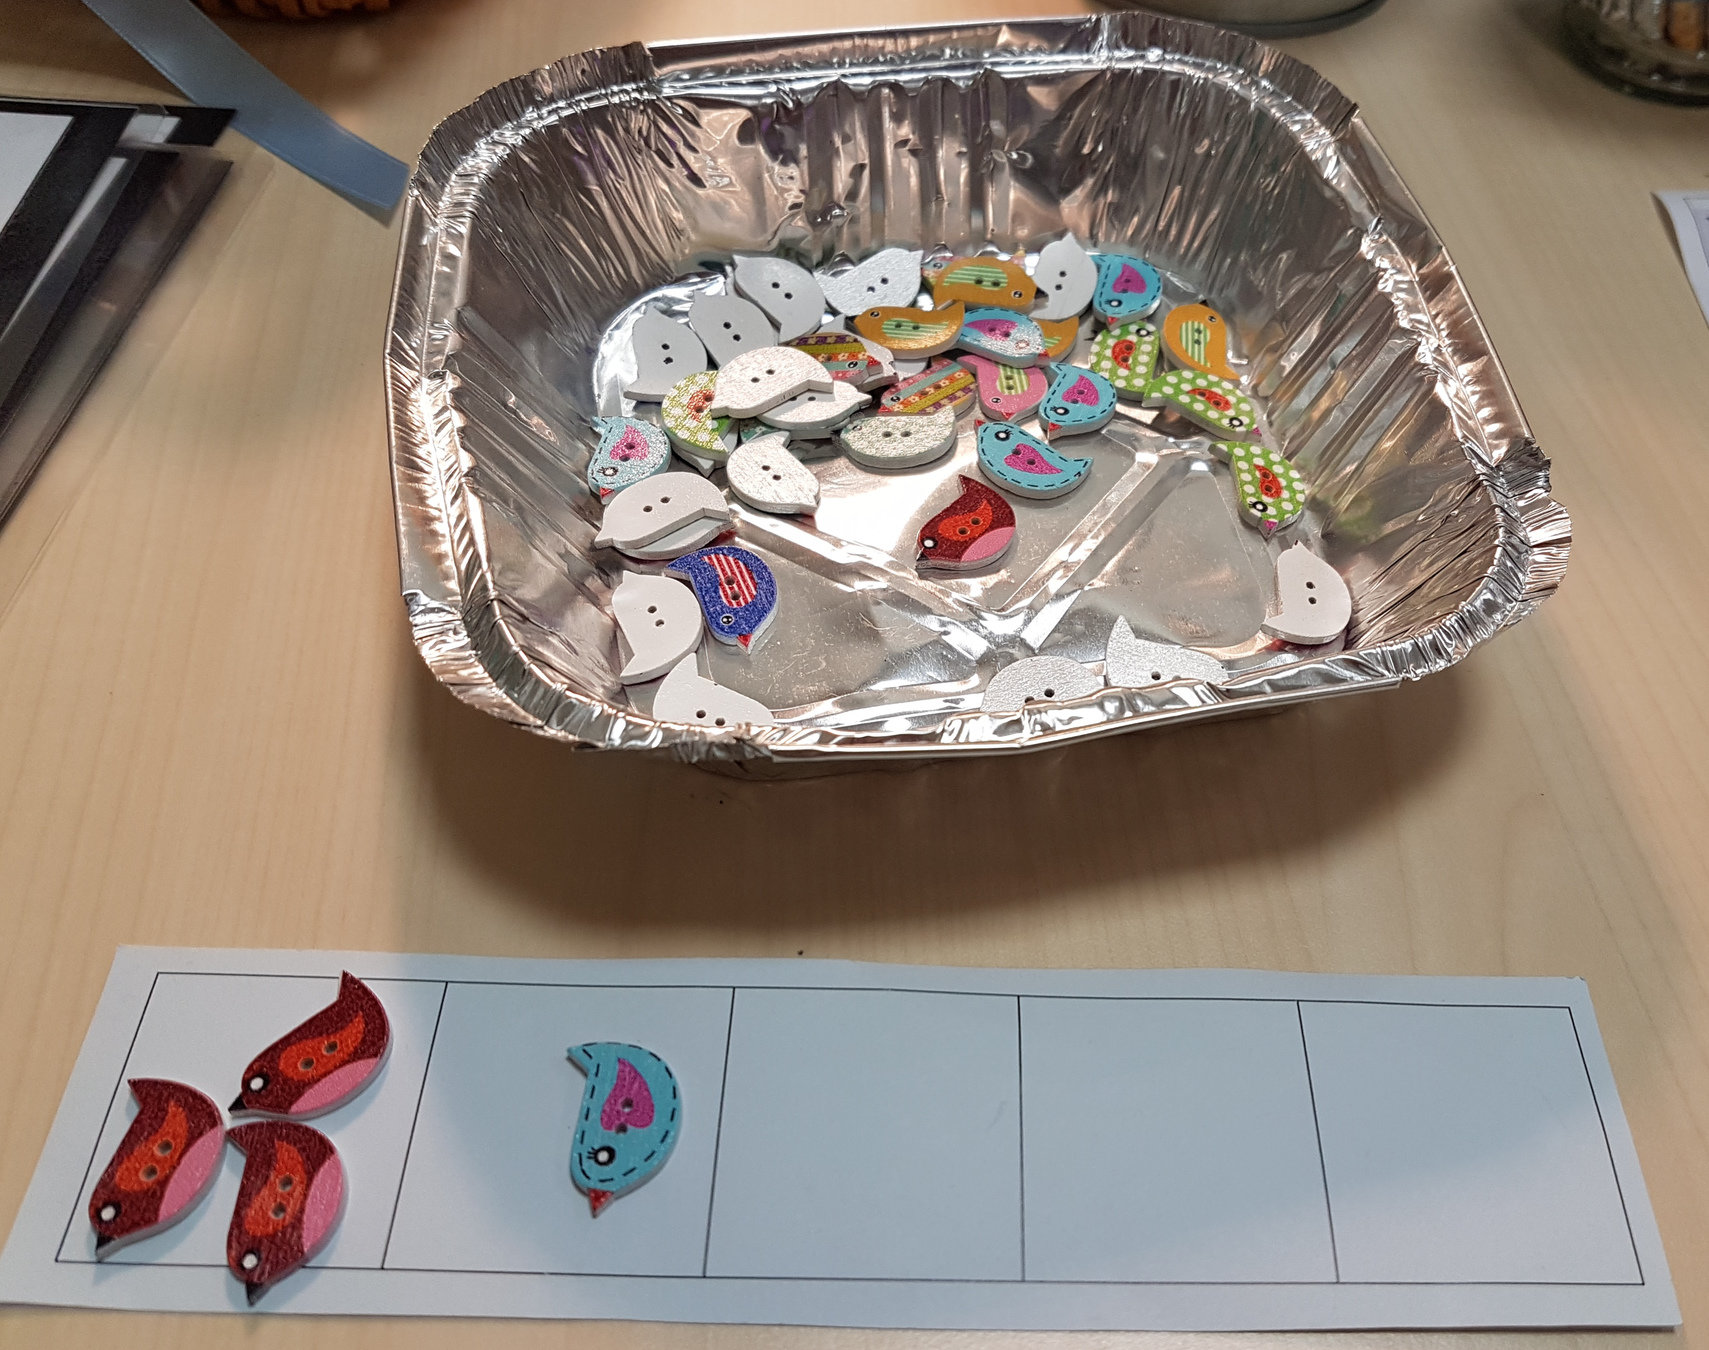
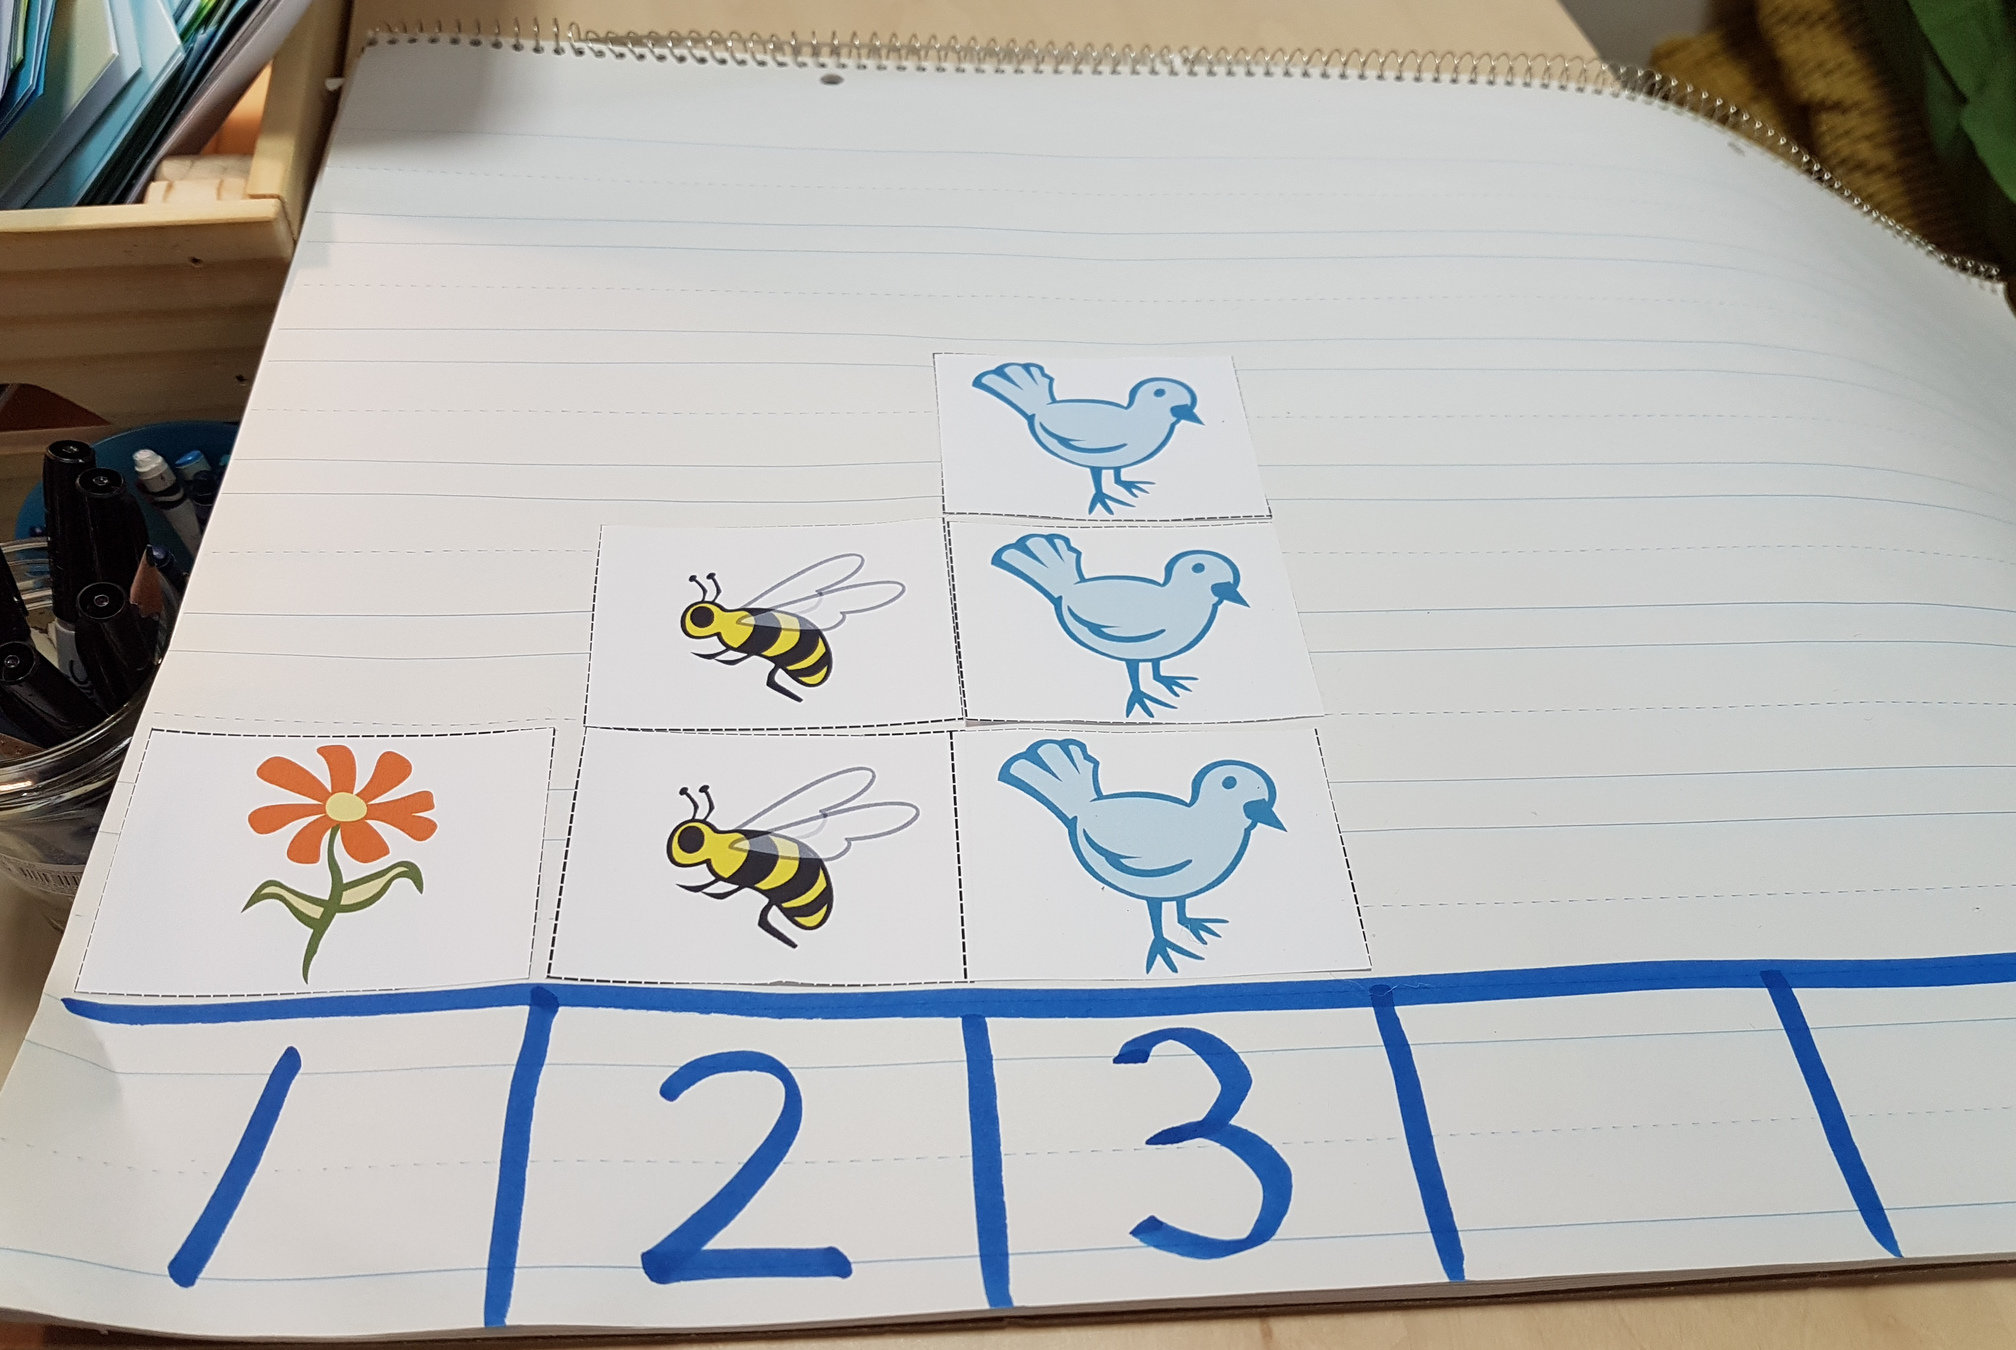
Pre-Kindergarten
Learning to Count
Common Themes
- Tactile, three-dimensional
- Relatable content and visual mediums
- Roles of scaling and order
- Large, poster format
- Instructional scaffolding
Considering a Wider Audience
Visualizations in 'Unusual' Places
Seek Different Audiences for Inspiration
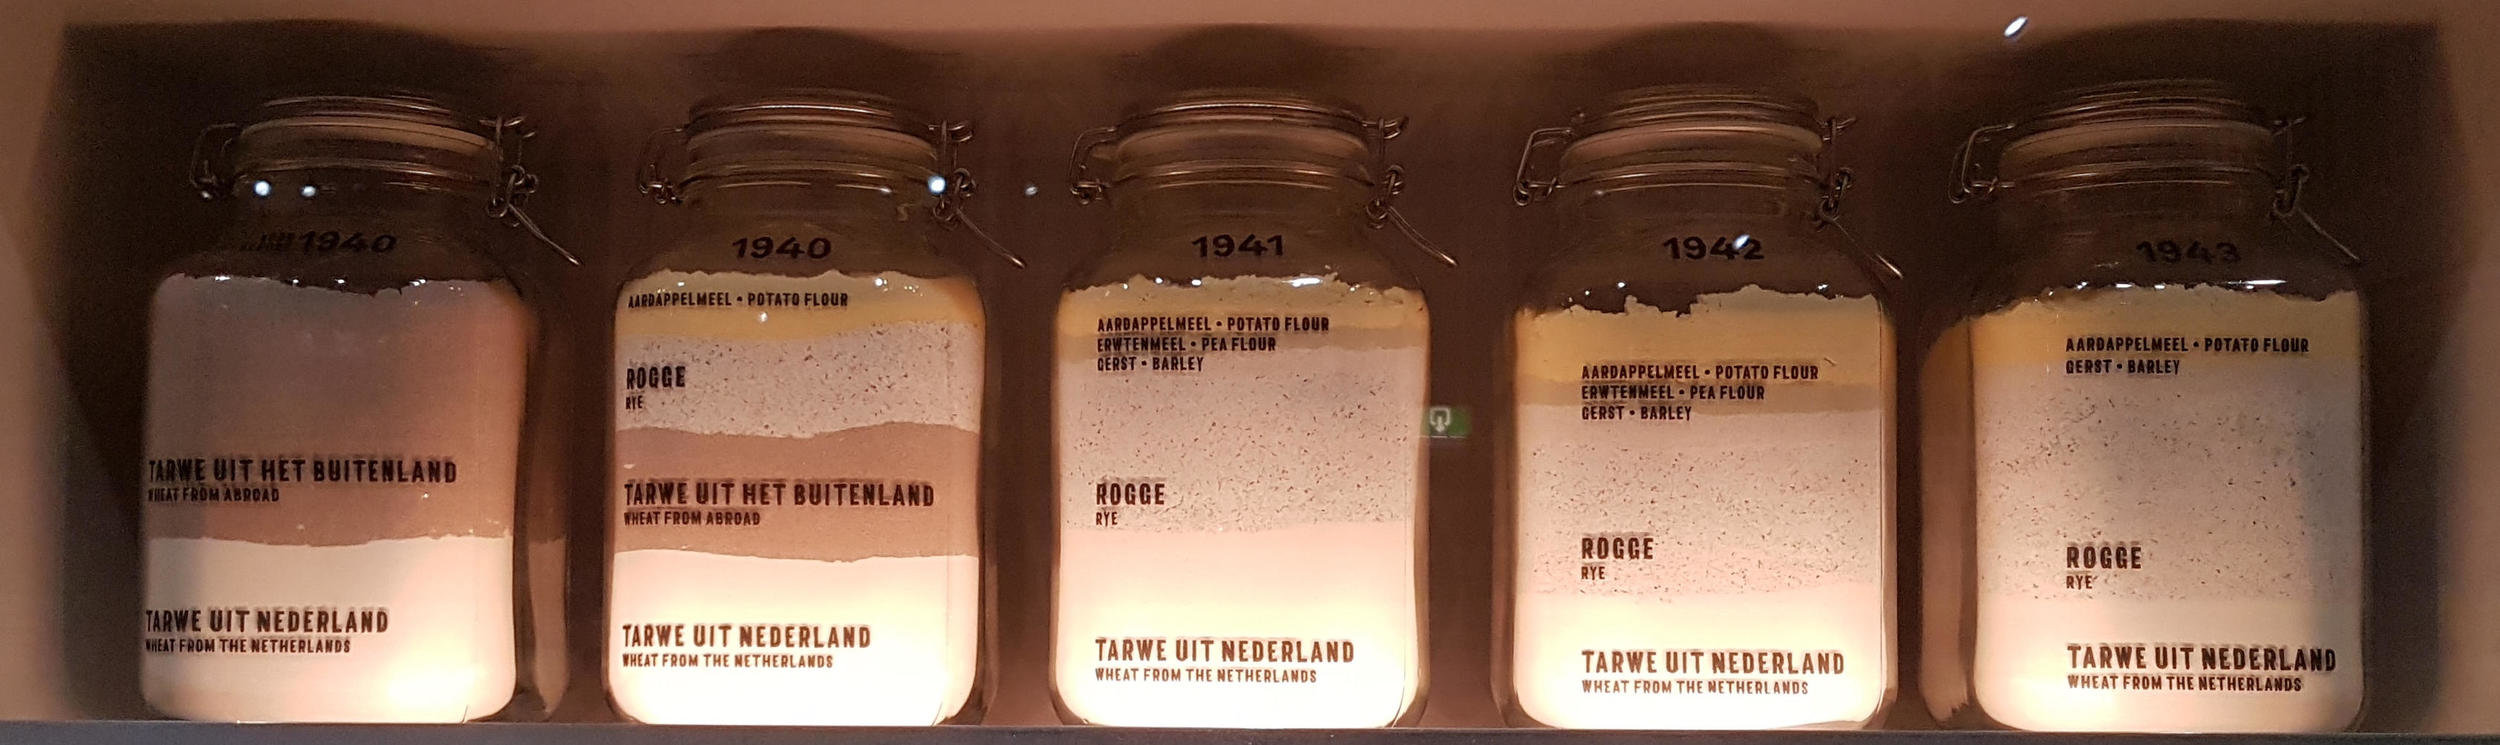
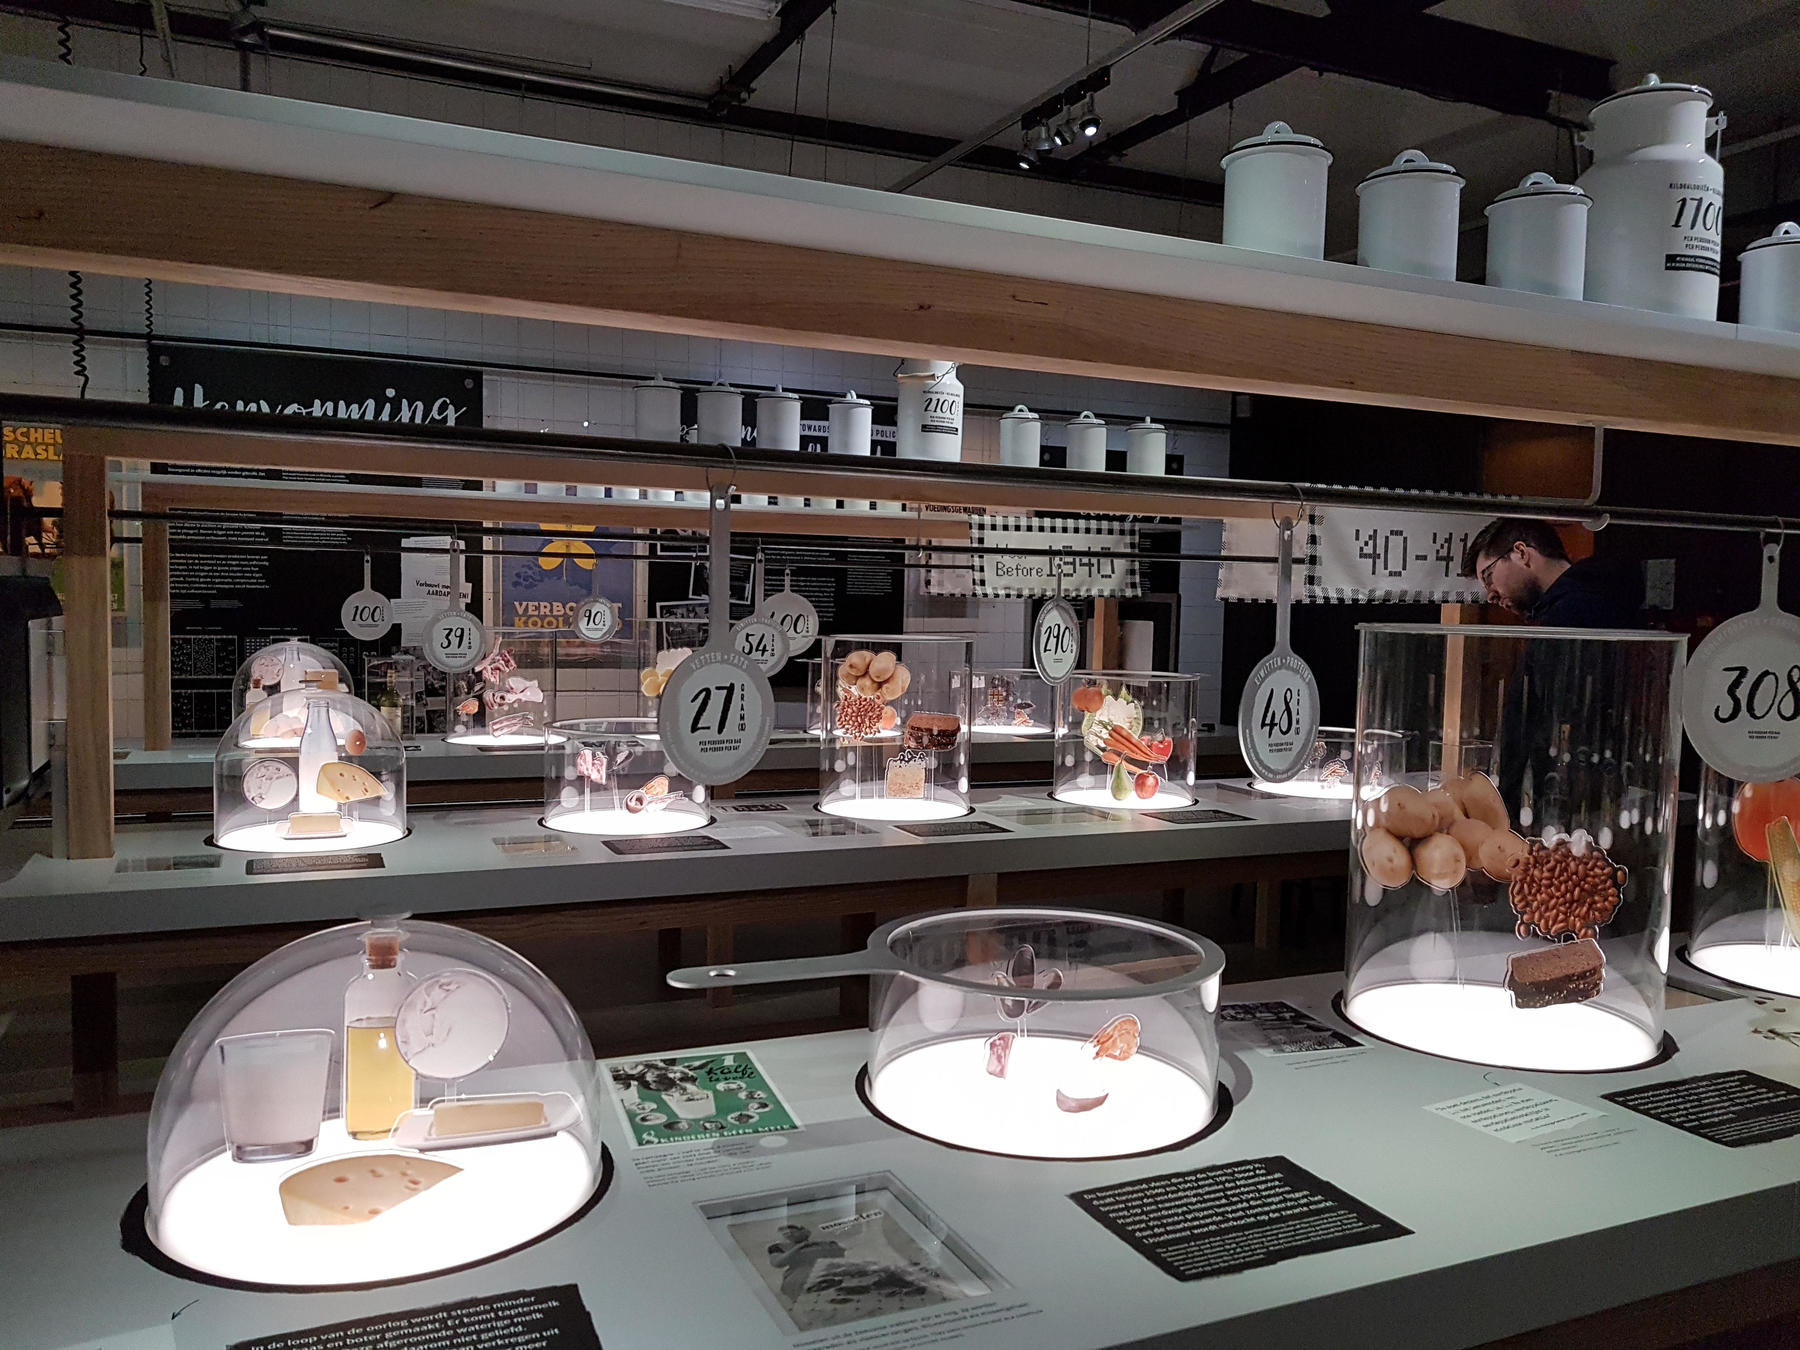
Dutch Resistance Museum
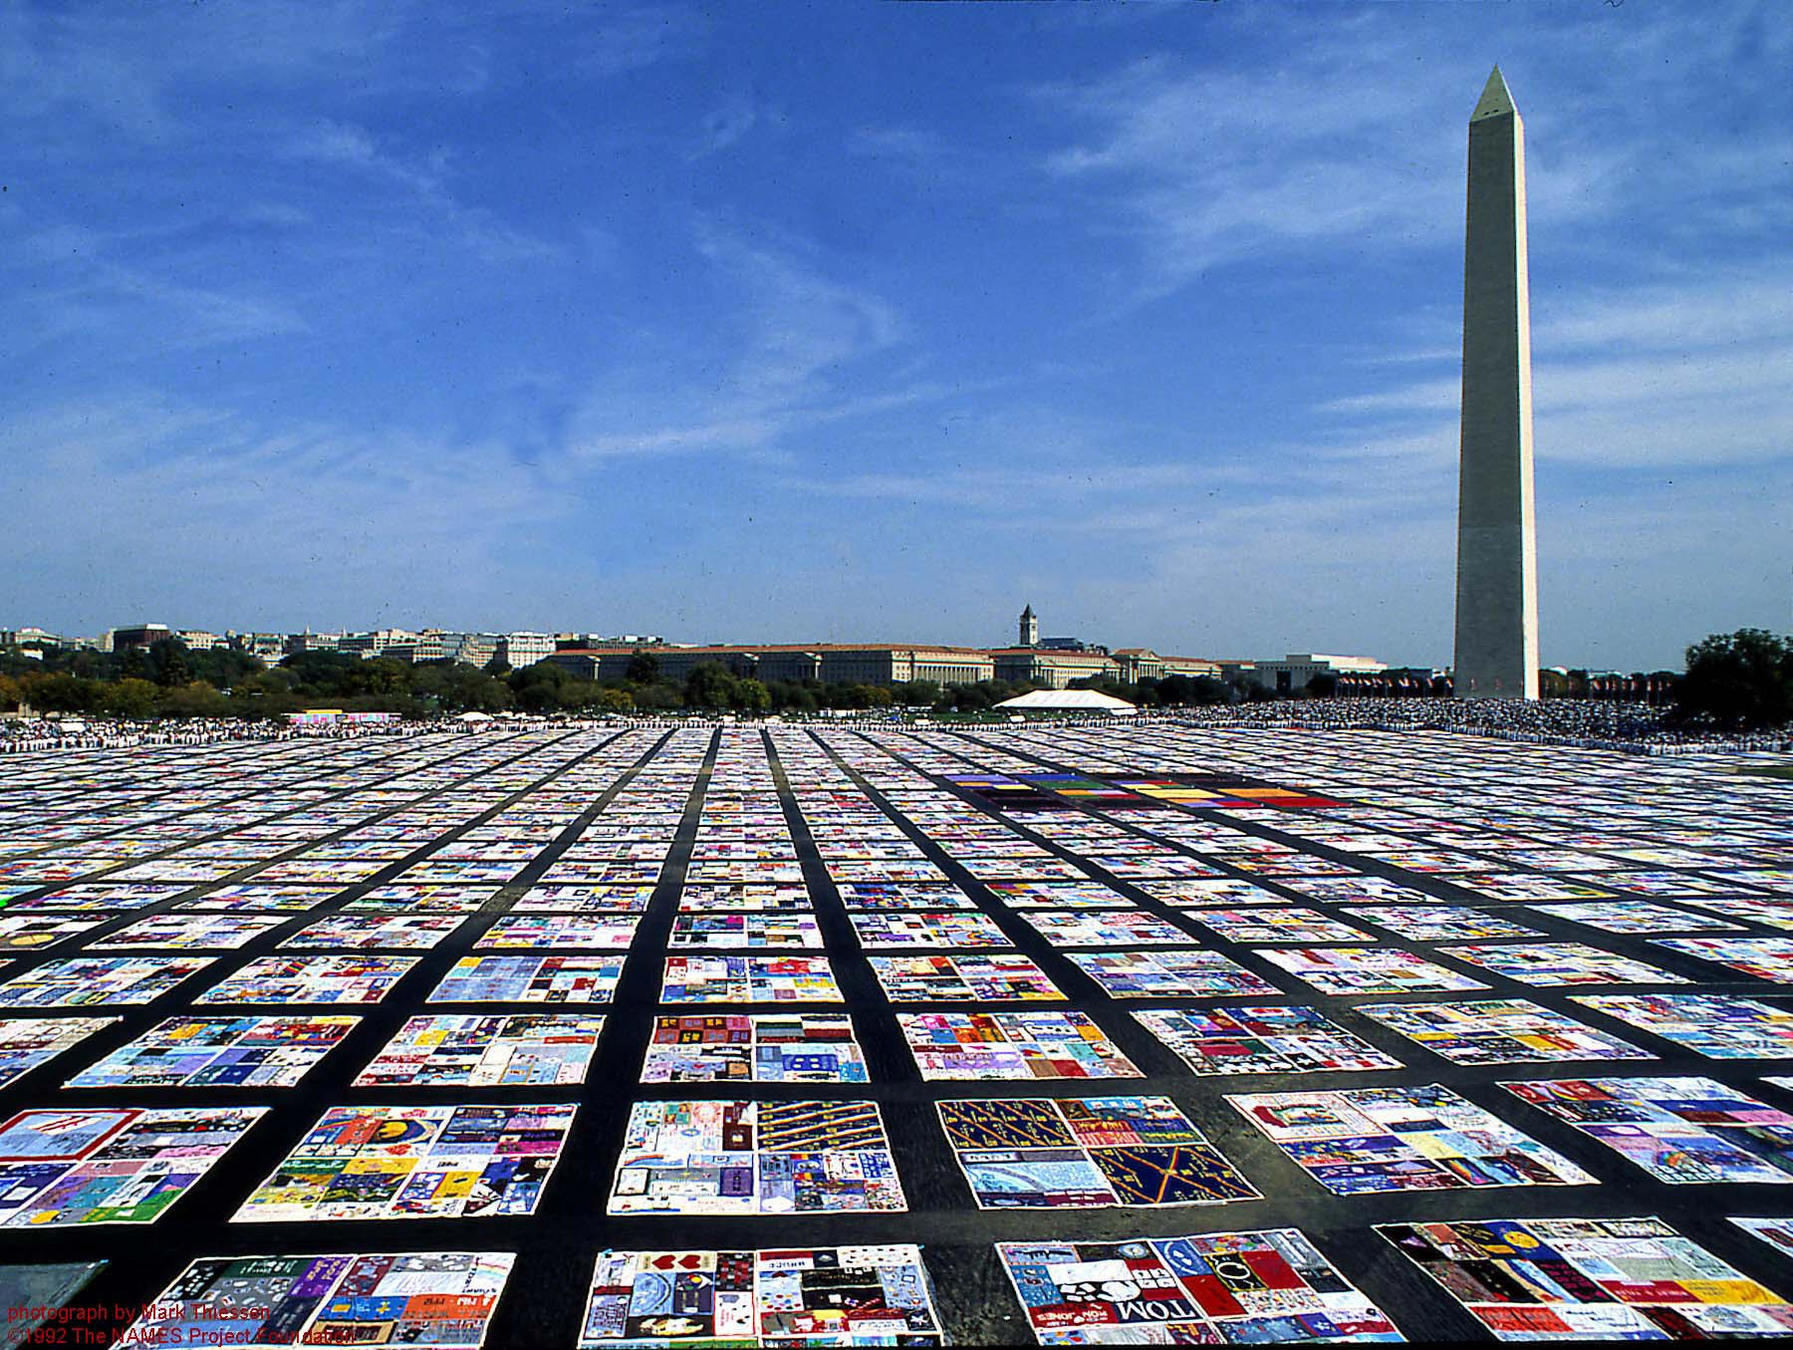
NAMES Project AIDS Memorial Quilt
Vietnam Veterans Memorial

Image courtesy of Mariordo
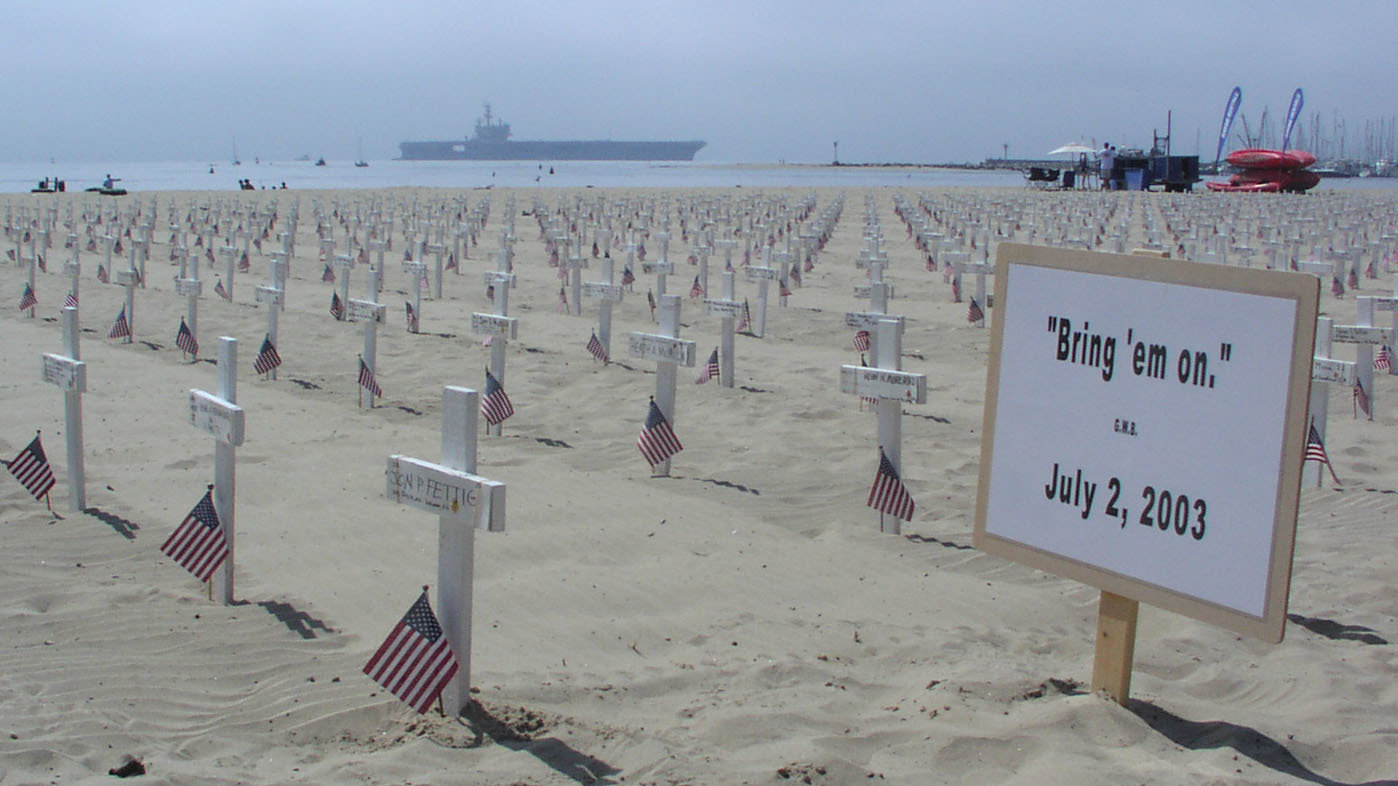
Arlington West
3D Printing
Pair with Model Building, Photography

Image courtesy of Imre Solt
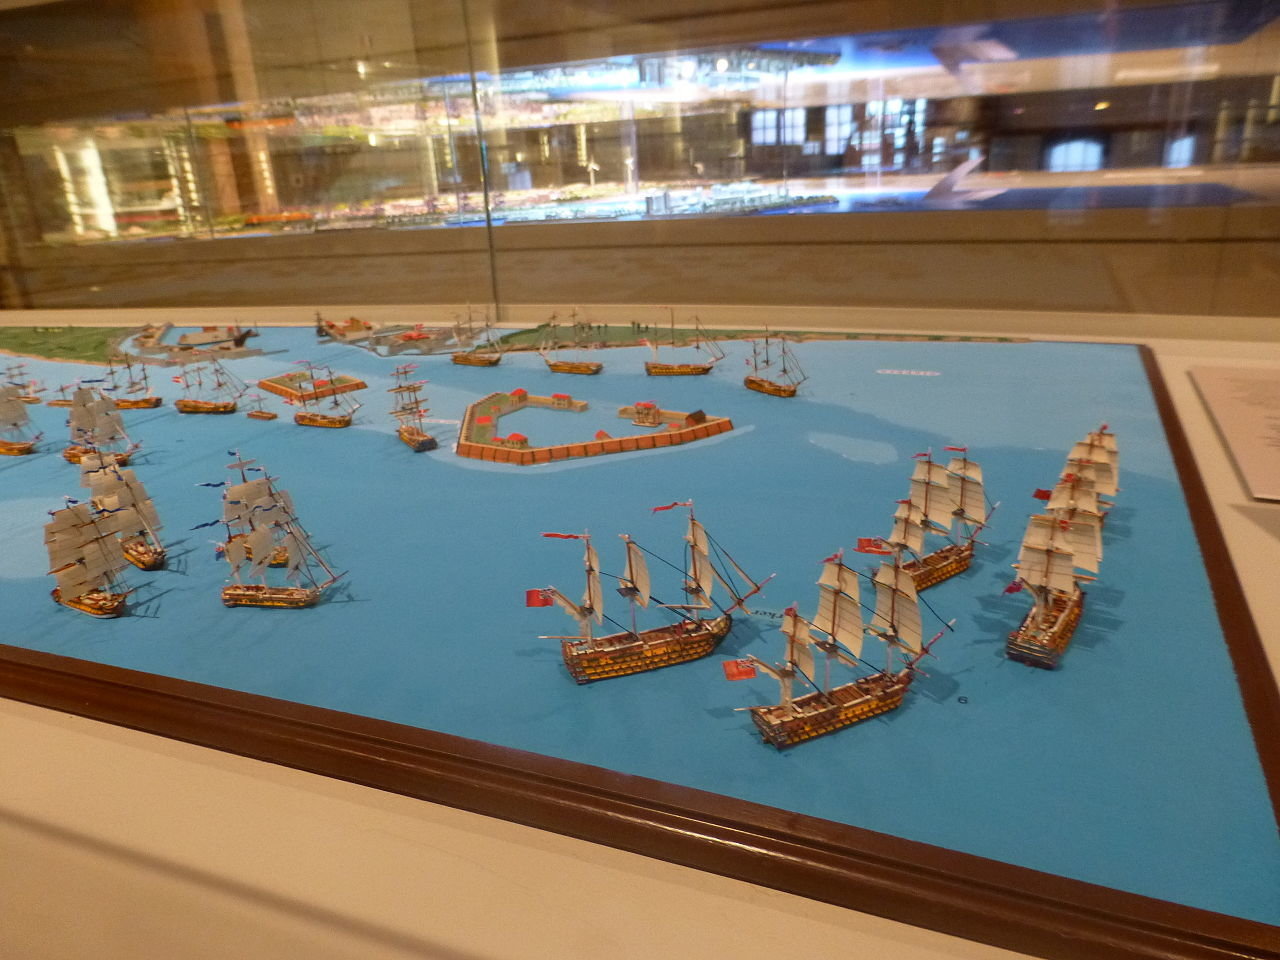
Image courtesy of Leif Jørgensen
Ongoing Challenges
- Statistical and Computational Literacy
- Dedicated Training and Background Knowledge
- Platform Limitations
- Interdisciplinarity
-
Creativity
- More diverse collaborations
- New audiences
Successes
- Data and Software Accessibility
- Open data, big data, internet of things
- Open source software
- Data Journalism and Public Fascination
Thank you!!
Data Stories 2017
By Benjamin Lind


