Exploring Spatio-Temporal Dynamics of Gene Expression using Transmodal Registration
Manan Lalit
(Jug & Tomancak Labs)


Dynamic changes in gene expression occur during early development
Embryo at 16 hpf*
Embryo at 20 hpf
?

* hours post fertilization


Building lineage trees with gene expression data requires bringing two datasets together
Live Embryo imaged with Light Sheet Microscopy: Nuclei, Membrane
In-situ Specimen at 16 hpf imaged with Confocal Microscopy: Nuclei, Pax3/7
+
=


Image Registration holds the answer
- Intensity or Feature based
- Global Transform based on Linear Models,
- Local Transform based on Non-Linear, Elastic Models
Add Image


Feature - based
Intensity - based
(Source: MathWorks)
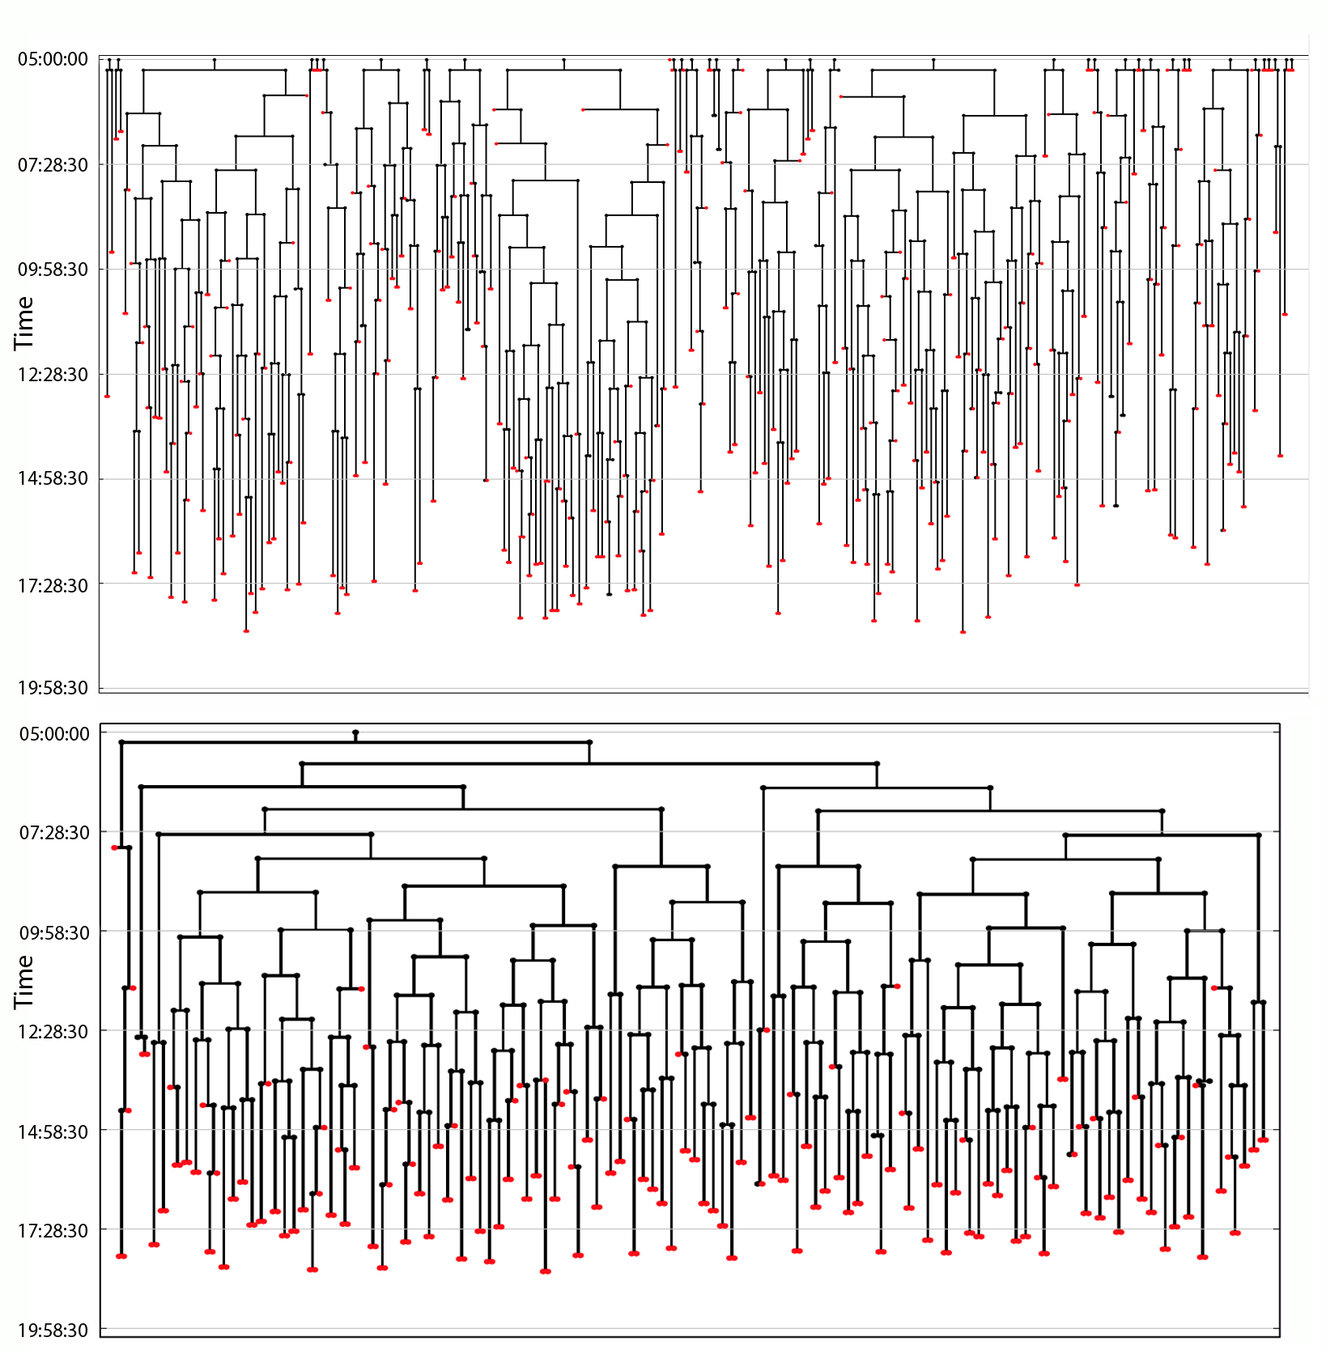
In-situ specimens for 50 genes at 3 developmental stages were imaged

Mette Handberg-Thorsager
Live imaging & tracking for three embryos was performed
Mette Handberg-Thorsager

The number of cell nuclei is used as a measure for staging the in-situ specimen

Number of cell nuclei in in-situ specimens at 16 and 20 hpf


Selection of the correct time point is based on maximum bi-partite matching


Cell nuclei in in-situ specimens are extracted


Feature Detection with Automatic Scale Selection, Lindeberg, T., International Journal of Computer Vision, 1998
Live Embryo: Nuclei. Cell nuclei positions were fitted to an ellipsoid
In-situ Specimen: Nuclei. Cell nuclei positions were fitted to an ellipsoid


Fixation introduces shrinking of the embryo
Choosing a few corresponding nuclei helps estimate the underlying transform
Live Embryo: Nuclei, Membrane
In-situ Specimen: Nuclei


T=

Maximum Bi-partite Matching helps fine-tune the transform
Live Embryo: Nuclei
In-situ Specimen AFTER transformation: Nuclei


In-situ Specimen BEFORE transformation: Nuclei


Live Embryo: Nuclei

T=
Lineage trees with gene expression data would allow cellular resolution, co-expression studies
In-situ Specimen imaged with Confocal Microscopy: Nuclei, pax3/7
In-situ Specimen imaged with Confocal Microscopy: Nuclei, pax6

Co-expression (Max z-projection ), obtained using ProSPr *
* Whole-organism cellular gene expression atlas, Vergara et al, PNAS June 6, 2017 114 (23) 5878-5885
Future: By-passing the hand-picking of corresponding nuclei
- ">50" genes times "3" time-points times ">15" replicates = >2250 in-situ images
- Similar nuclei would have similar neighborhoods
Future: Adding Single Cell RNA-Sequencing data to the mix


Developmental Cell Lineage

Mette Handberg-Thorsager
Mette Handberg-Thorsager

Bruno Vellutini
Thank you for listening! Any questions?
Tomancak Lab
Marina Cuenca
Johannes Girstmair
Mette Handberg-Thorsager
Pavel Mejstrik
Stefan Münster
Giulia Serafini
Gabriella Turek
Vladimir Ulman
Bruno Cossermelli Vellutini
Jug Lab
Tim-Oliver Buccholz
Alexander Krull
Mangal Prakash
Deborah Schmidt
Jug/ Zechner Lab
Tobias Pietzsch
Jug/ Honigmann Lab
Anna Goncharova
Jug/ Zerial Lab
Nuno Pimpao Martins
Myers Lab
Matthias Arzt
Copy of Copy of Friday Seminar
By Manan Lalit
Copy of Copy of Friday Seminar
- 234

