Debugging
- Elements
- Sources
- Network
- Timeline
- Profiles
- Resources
- Audit
- Security
- Console
- Remote Debugging
- Tracing
- Additional Chrome features
Chrome Dev Tools
Elements: Inspect and live-edit the HTML and CSS
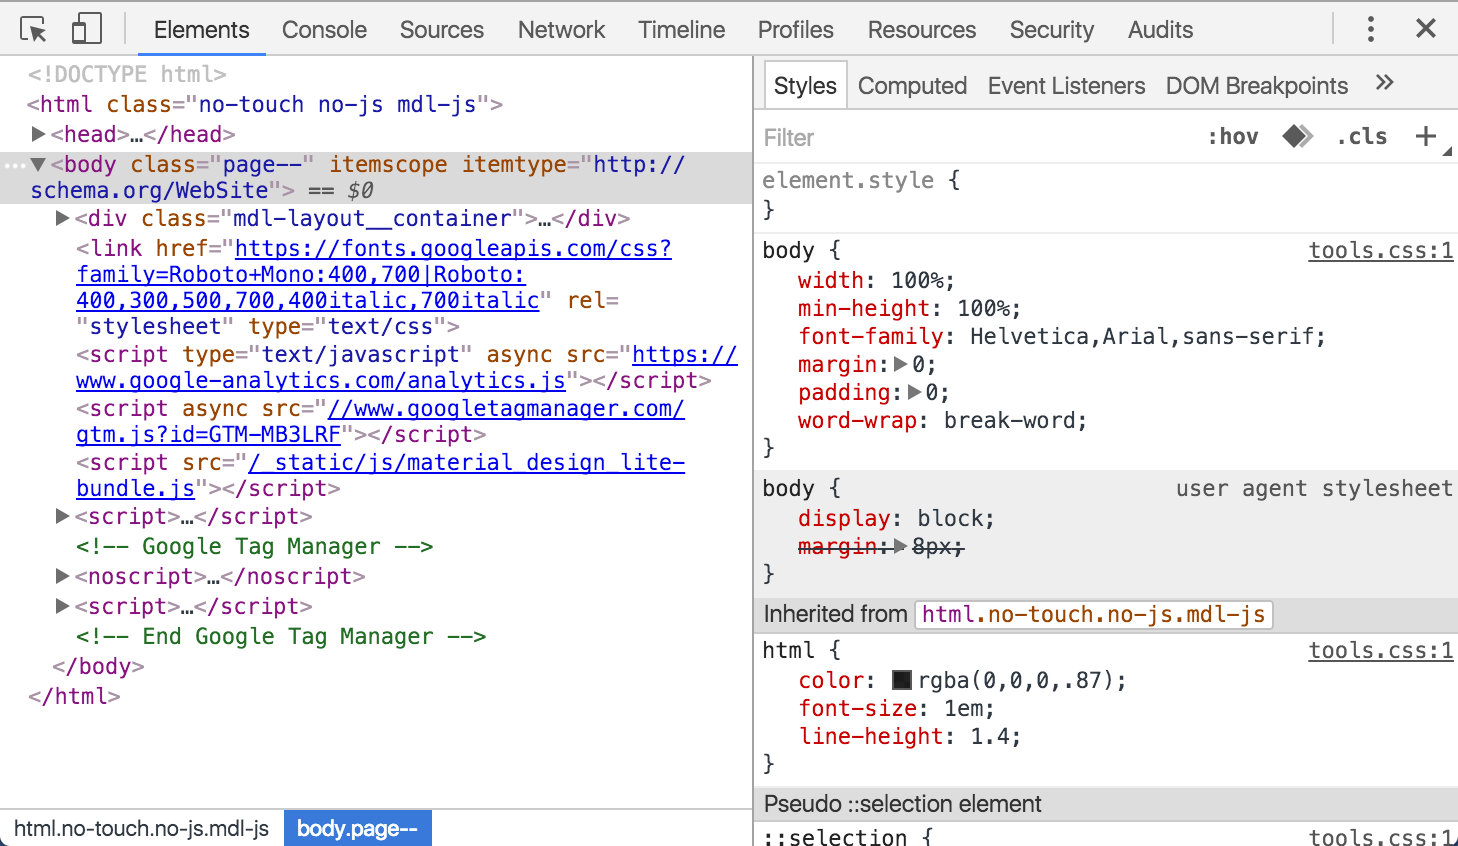
Edit property name

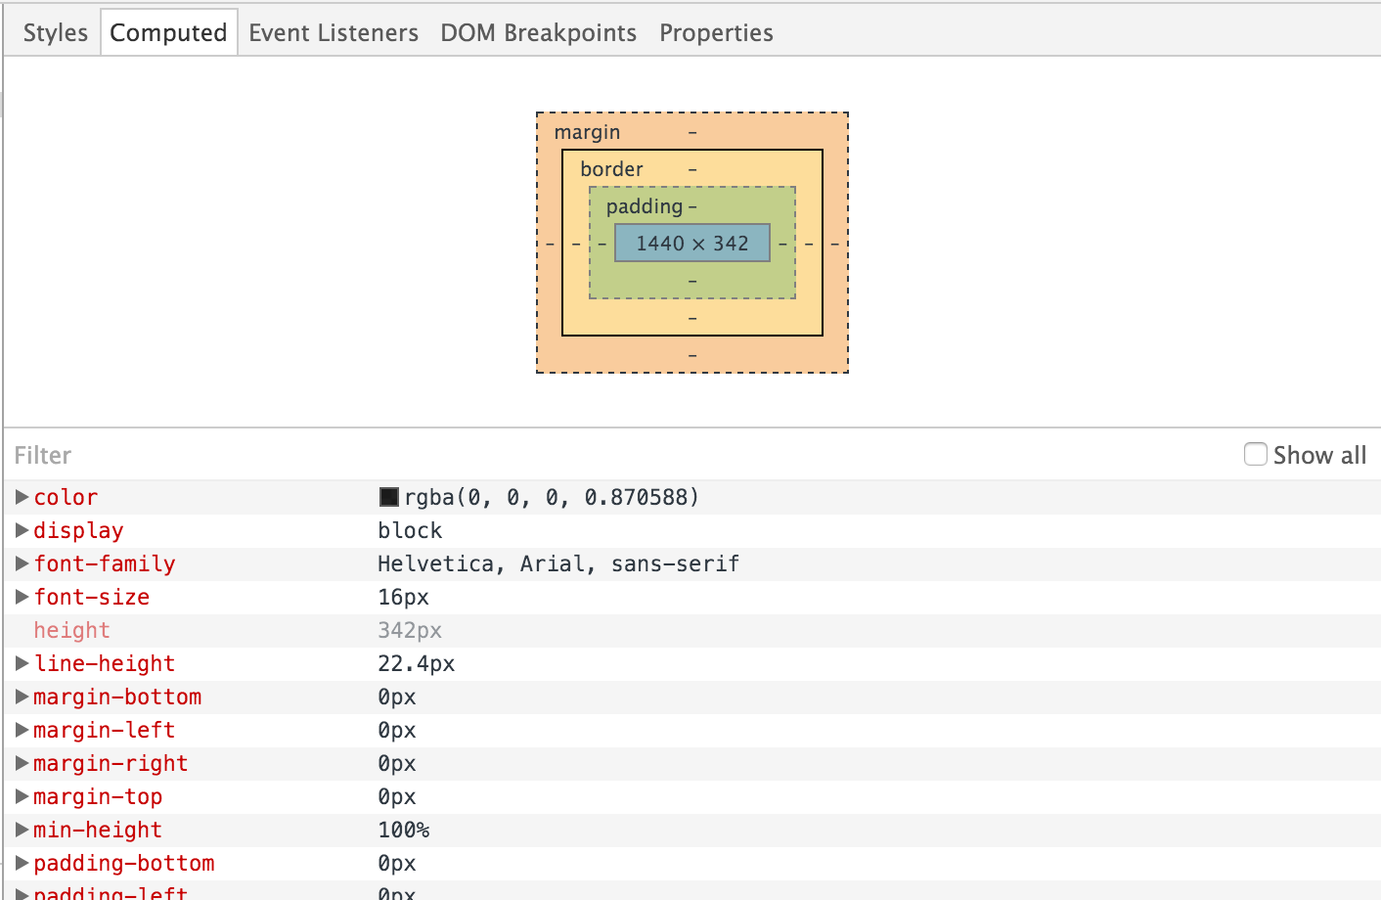
Box model parameters
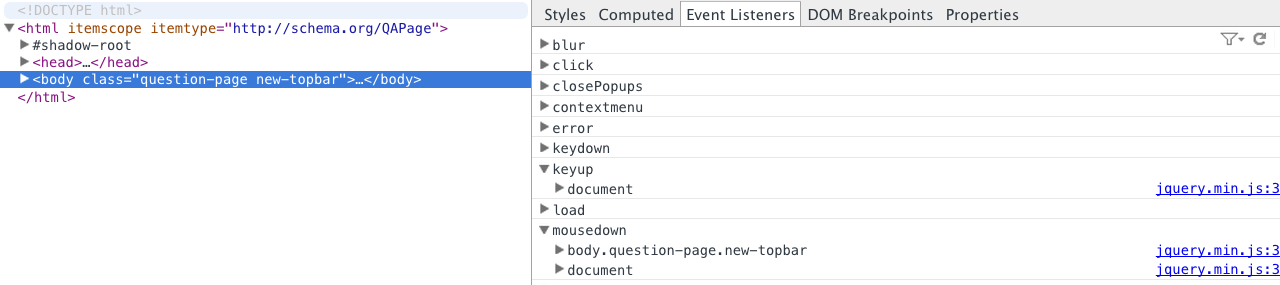
Event
monitorEvents(document.body, "click");
getEventListeners(document);
Sources
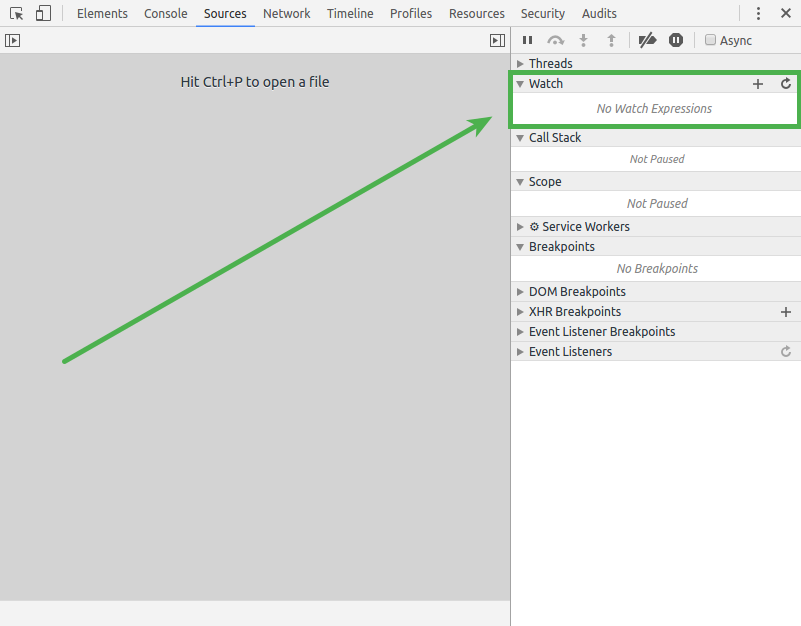
Shortcuts:
-
use Ctrl + P to quick file switching
-
use Ctrl + F to search within code
-
use Ctrl + G to quick jump go to line or :number
-
you can use pretty print button, looks like this: {} to make code not minified
- use Ctrl + D on the Sources Tab for select the next occurrence of the current word. It is helping you edit them simultaneously.
Network
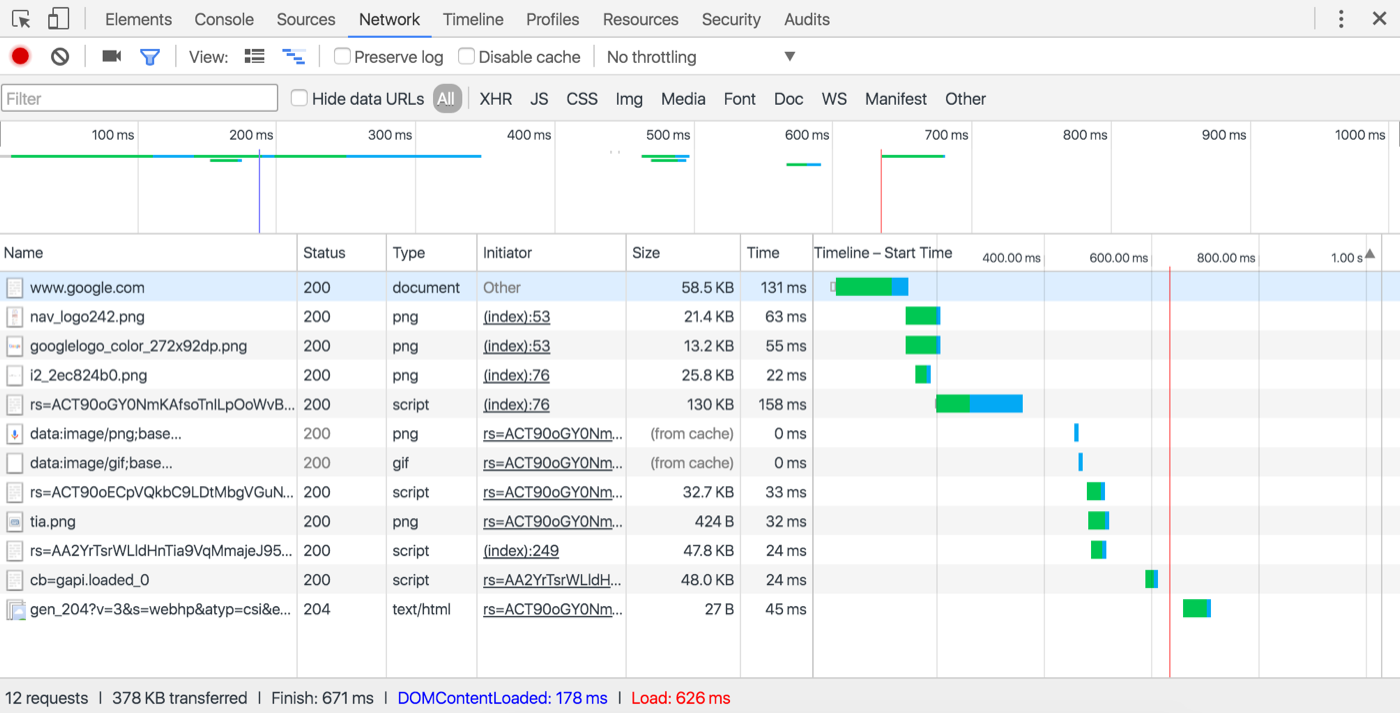
- Use the Network panel to record and analyze network activity.
- View load information in aggregate or for individual resources.
- Filter and sort how resources are dispalyed.
- Save, copy, and clear network recordings.
- Customize the Network panel to your needs.
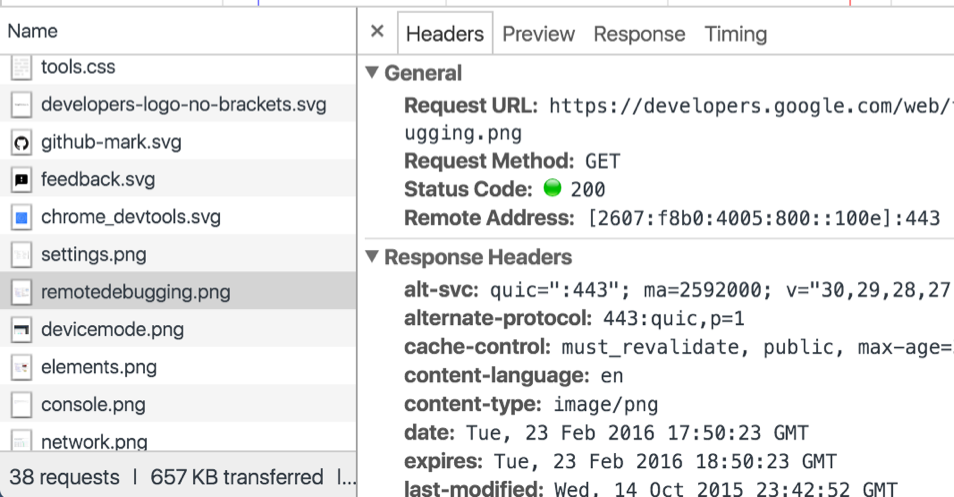
Single Resource
Timeline
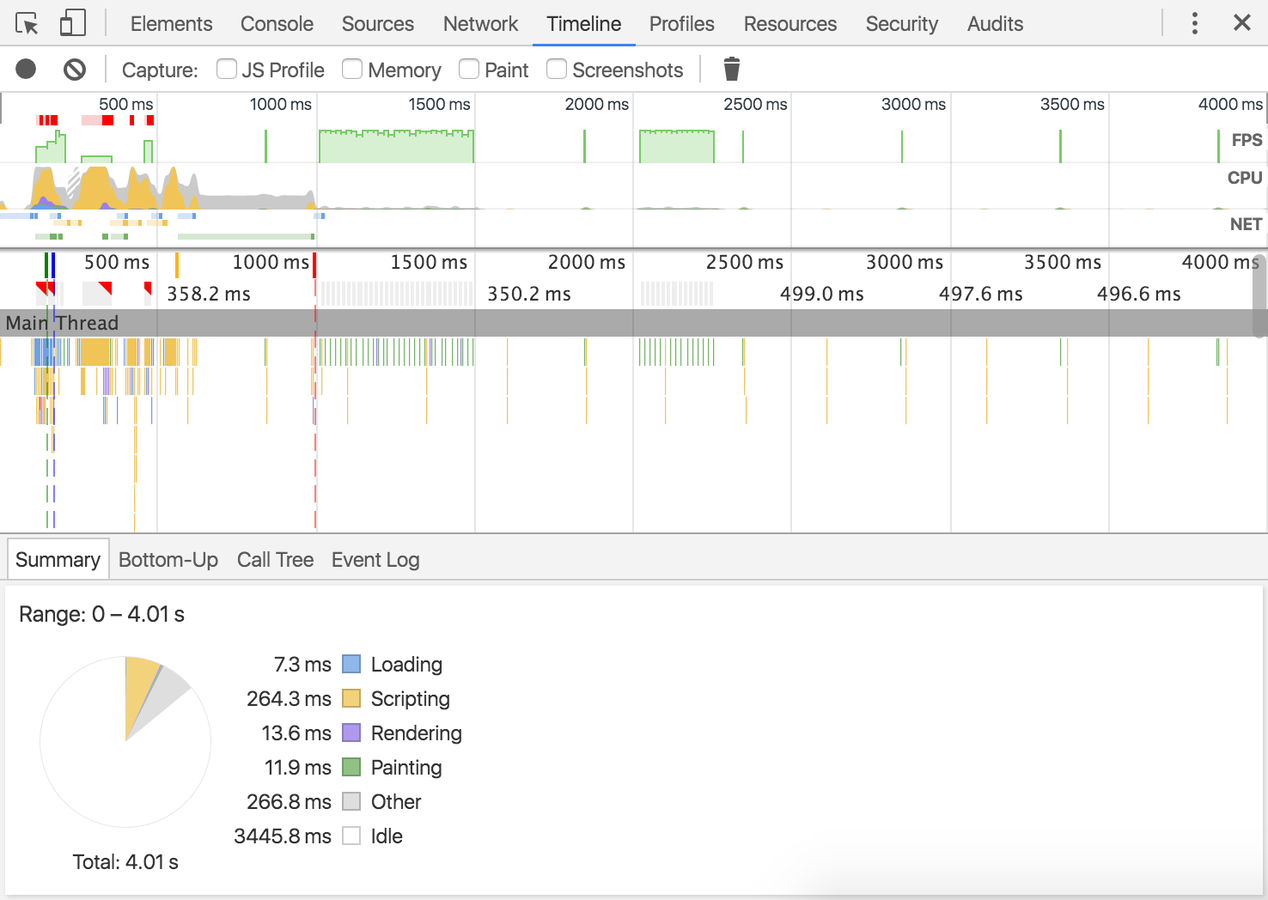
- Make a Timeline recording to analyze every event that occurred after a page load or a user interaction.
- View FPS, CPU, and network requests in the Overview pane.
- Click on an event within the Flame Chart to view details about it.
- Zoom in on a section of a recording to make analysis easier.
Profile
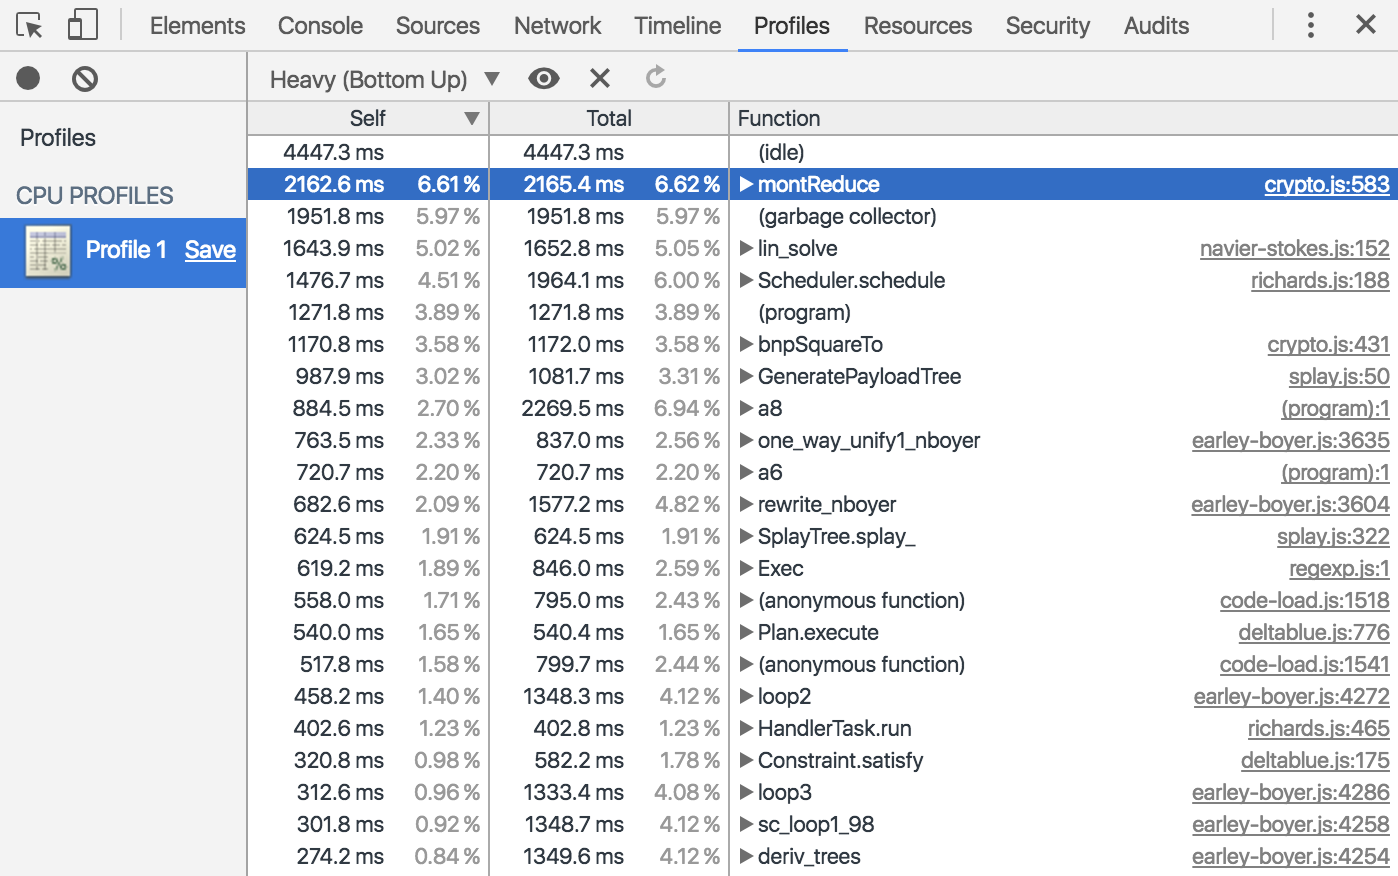
- Record exactly which functions were called and how long each took with the CPU Profiler.
- Vizualize your profiles as a flame chart.
The Profiles tab lets you profile the execution time and memory usage of a web app or page.
The Profiles panel includes two profilers: a CPU profiler and a Heap profiler.
These help you to understand where resources are being spent, and so help you to optimize your code:
-
The CPU profiler shows where execution time is spent in your page's JavaScript functions.
-
The Heap profiler shows memory distribution by your page's JavaScript objects and related DOM nodes.
- Record Heap Allocations record JavaScript object allocations over time. Use this profile type to isolate memory leaks.
Resources
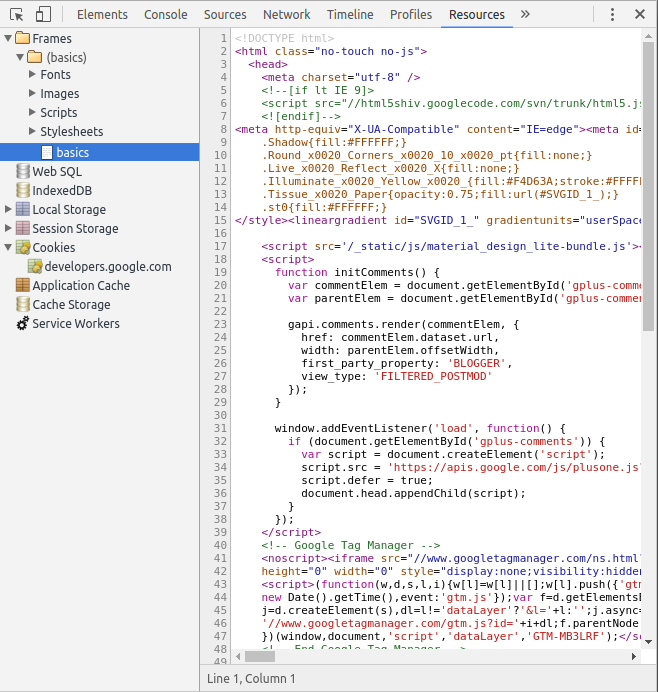
Cockies
Local Storage
Resources
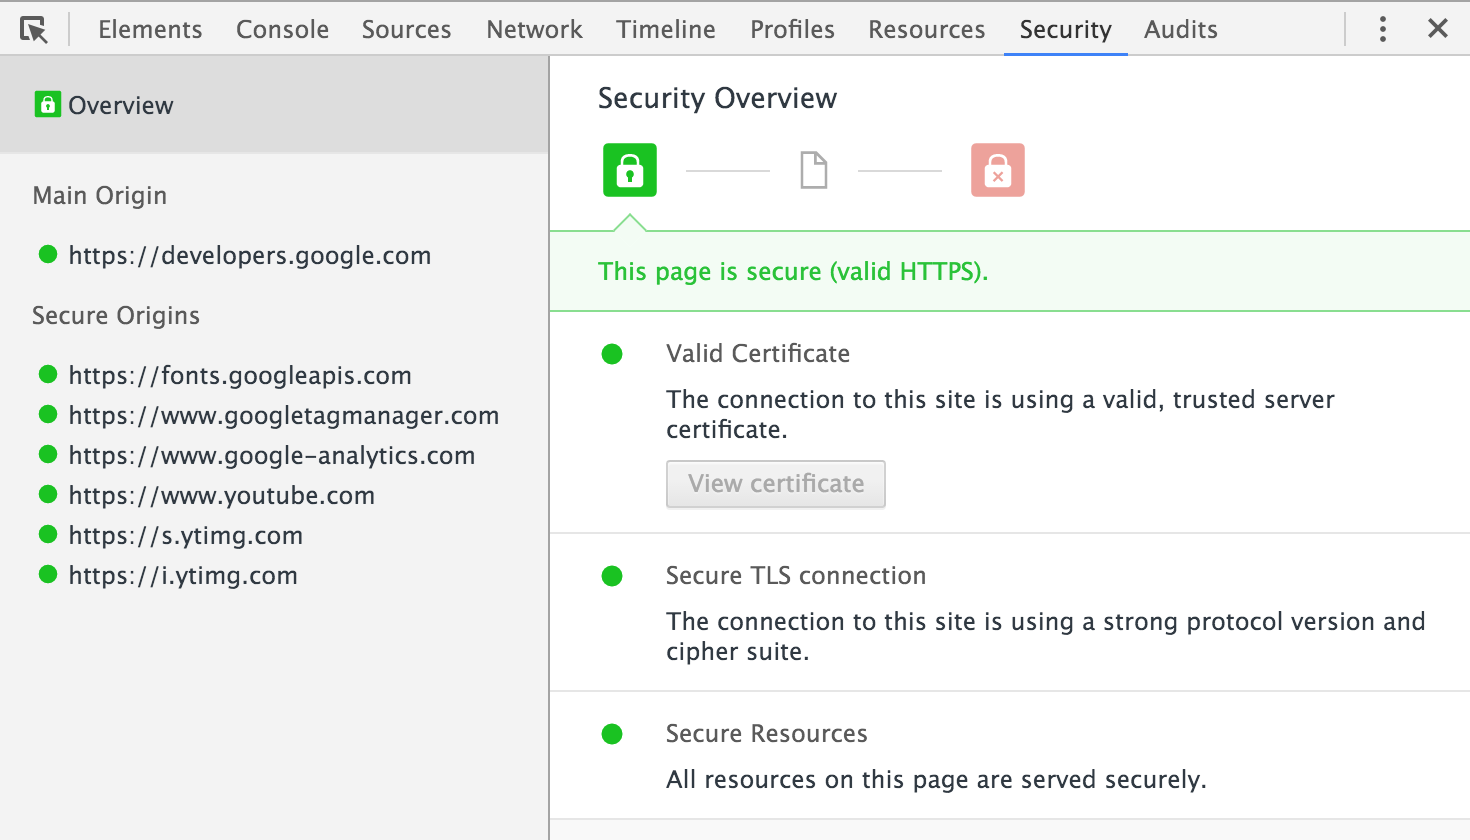
Security & Audit
Console
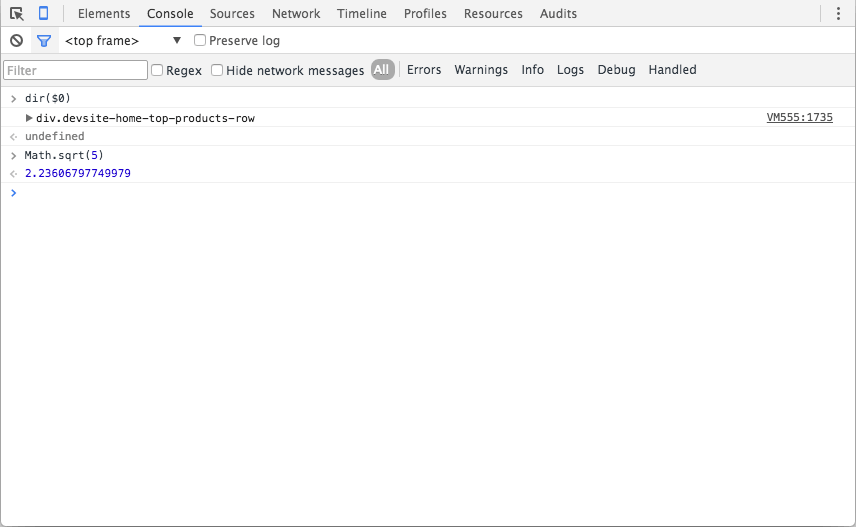
-
use $() and $$() to execute document.querySelector() and document.querySelectorAll().
-
use $0 - $4 to lock for five most recent selected elements in the DOM $0 being the last
-
use $x(xpath) for search elements with xpath
- use clear(); to clear console
Console API
- console.info, .warn, .error,
- monitorEvents()
- getEventListeners(document)
- count()
- dir()
- timeStamp
- and so on
Debug Devices
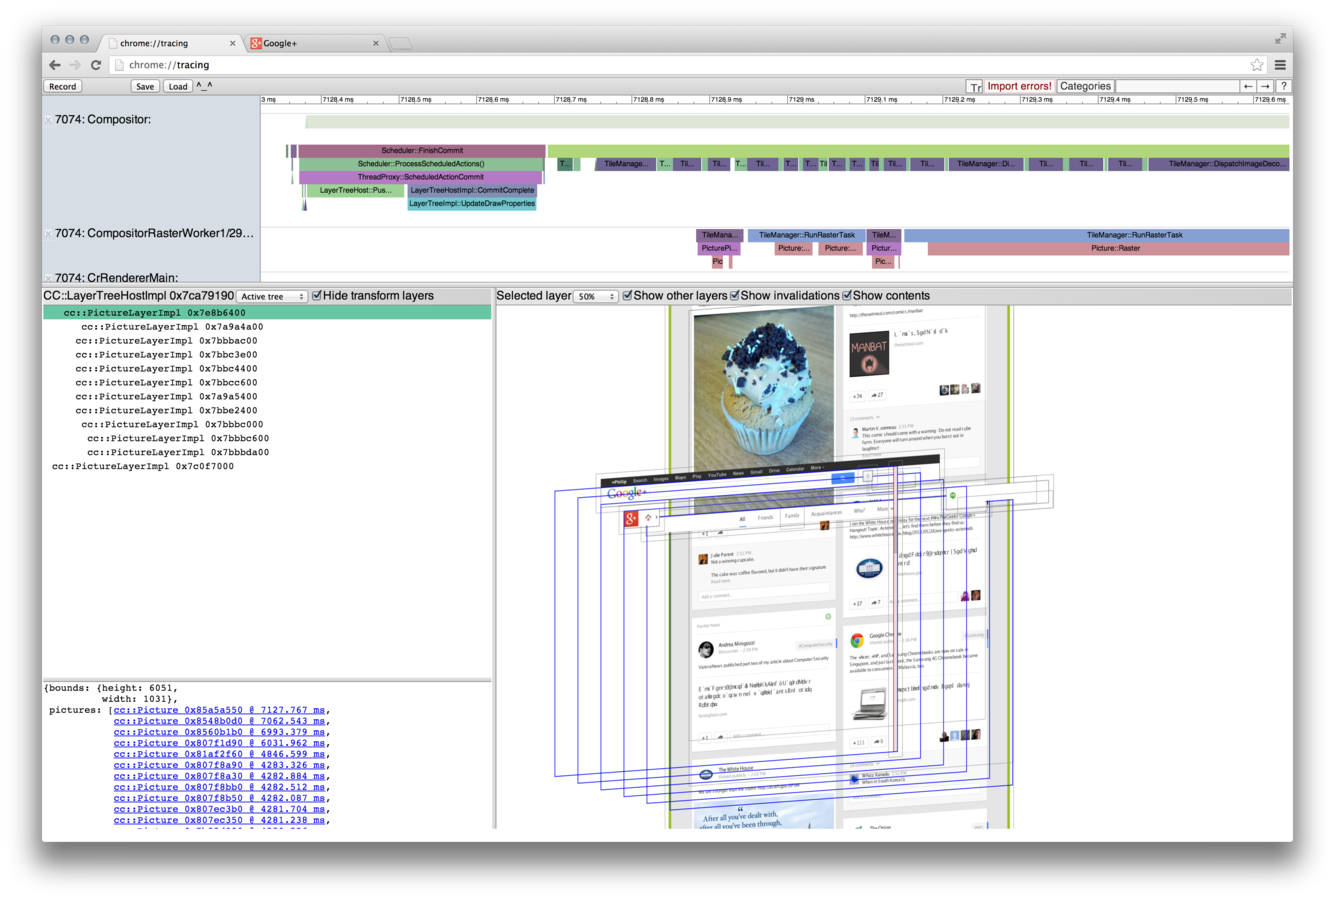
Tracing
Additional Chrome features
-
chrome://net-internals
-
chrome://sync-internals
Debugging
By Nicholas Sorokin


