Valgrind
How it work?
Valgrind Component
- Valgrind core
- vgtool
- program
Valgrind Core
Valgrind Tool
Program
JIT
- simulated CPU
- x86 -> ucode
x86 Binary
UCode Binary
Emulator
Program
Valgrind Core
Host CPU
Intermediate Representation (IR)
ucode
Tools
Machine Code
System Call
-
system call may change process memory by kernel and valgrind want to know
- Pre
- Post
- copy all program's state to real CPU
- except program counter
PRE(sys_SYNOStat)
{
   FUSE_COMPATIBLE_MAY_BLOCK();
   PRINT("sys_SYNOStat ( %#lx(%s), %ld, %#lx)",ARG1,(char*)ARG1,ARG2,ARG3);
   PRE_REG_READ3(long, "SYNOStat", const char *, file_name,
                 unsigned int, flags, struct SYNOSTAT64 *, statbuf);
   PRE_MEM_RASCIIZ( "SYNOStat(file_name)", ARG1 );
   if (ARG3 != 0)
     PRE_MEM_WRITE( "SYNOStat(statbuf)", ARG3, sizeof(struct vki_SYNOSTAT) );
}

POST(sys_SYNOStat)
{
   if (ARG3 != 0)
      POST_MEM_WRITE( ARG3, sizeof(struct vki_SYNOSTAT) );
}
Tools
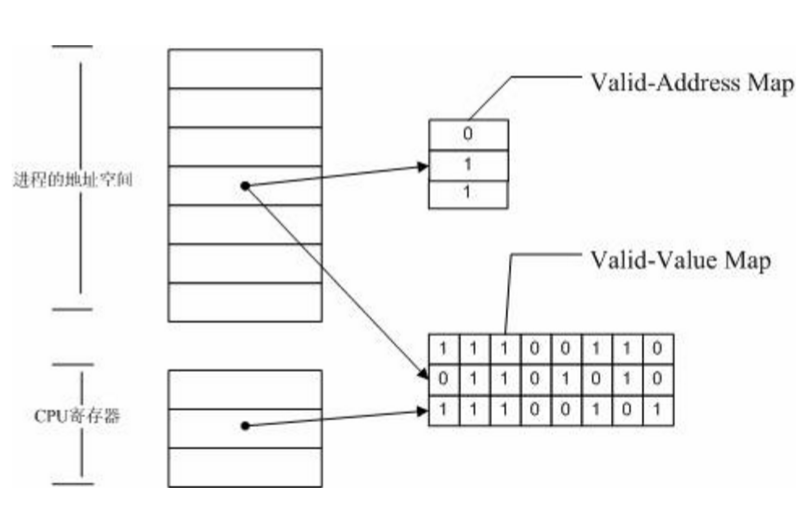
MemCheck
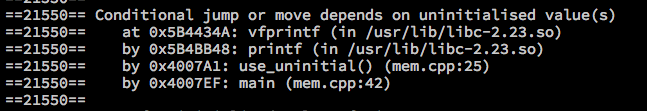
- Use of uninitialised memory
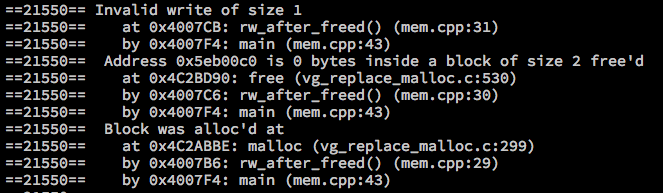
- RW after freed
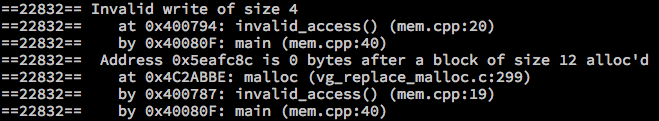
- RW over malloc space
- RW on wrong stack
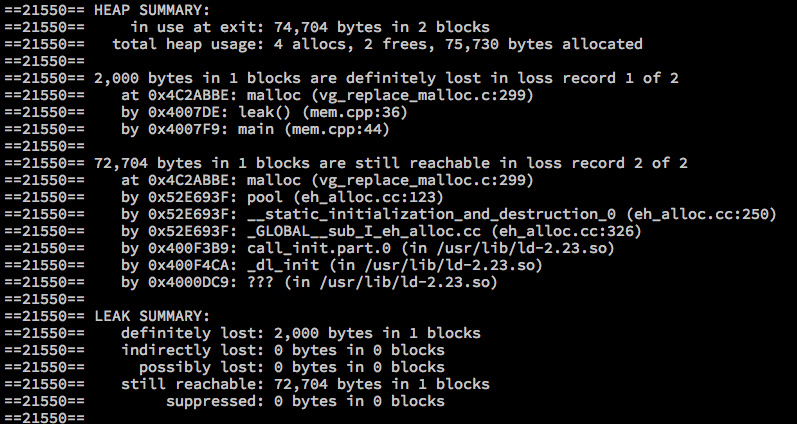
- Not free
- Valid-Value table
- validity(defined) of the bit
- Valid-Address table
- accessble of the byte
  void invalid_access() {
      int *a = malloc(3 * sizeof(int));
      a[3] = 3;
      free(a);
  }
  void use_uninitial() {
      int i;
      printf("%d\n", i);
  }
  void rw_after_freed() {
      char *a = (char *)malloc(2*sizeof(char));
      free(a);
      a[0] = '1';
  }
  void leak()
  {
      malloc(2000);
  }
  int main(void)
  {
      invalid_access();
      use_uninitial();
      rw_after_freed();
      leak();
      return 0;
  }
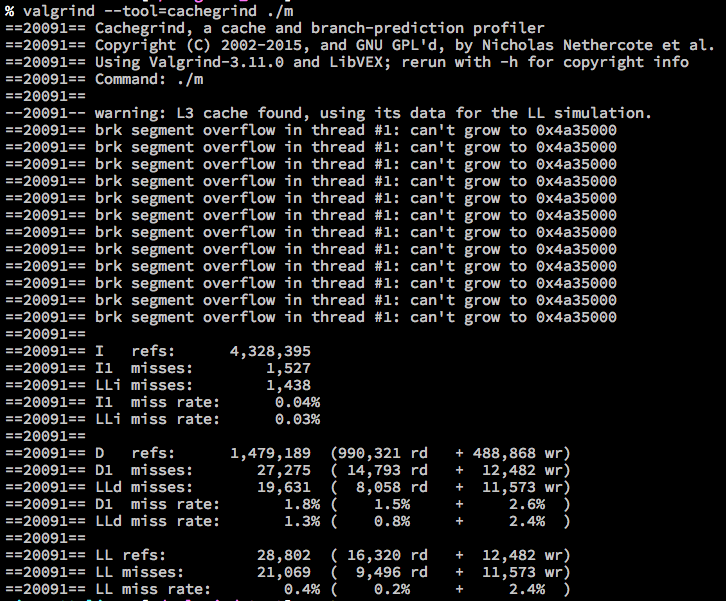
Cachegrind
- Simulate first and last cache
- l1: instruction cache
- D1: data cache
- LL: last level instruction cache
- Branch prediction
Callgrind
- record call history
- coolect number of instructions executed
% valgrind --tool=callgrind ./m
% python gprof2dot.py -f callgrind -n10 -s callgrind.out.19576 > valgrind.dot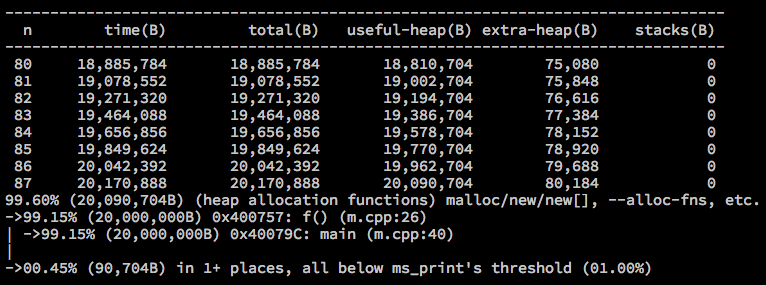
% dot -Tpng valgrind.dot -o valgrind.pngMassif
- Heap profiler
- mesures heap memory usage
void g(void)
{
    malloc(4000);
}
void f(void)
{
    for (int i=0; i < 10000; i++) {
        malloc(2000);
    }
    g();
}
int main(void)
{
    int i;
    int* a[10];
    for (i = 0; i < 10; i++) {
        a[i] = (int *)malloc(1000);
    }
    f();
    g();
    for (i = 0; i < 10; i++) {
        free(a[i]);
    }
    return 0;
}
% valgrind --tool=massif ./m
% ms_print massif.out.18981
Helgrind/DRD
- Detect data races in mult-threads programs
- Inconsistent lock order
Monitor all access to memory location if accessed by different threads check if two accesses are ordered by happen-before relations.
Means there is some chain of inter-thread synchronisation operations only correctly handle POSIX condition variables. Ex: pthread_conf_wait, pthread_cond_signal ...
Demo
Valgrind
By nit nit