Title Text
Let's make some maps!!
to follow along go to - https://bit.ly/maptimeLA-qgis101
Thanks to
- Metro For hosting
- theworksLA for the noms
So what are we going to do?
- Introductions
- Quick exploration of QGIS with some secrets
- Adventures with data from
- LACITY and LACOUNTY Open Data Portals
- Getting your maps ready to print
- Venture out with your fresh map
Can this be done in 2 hours? Stay tuned...

QGIS!
A free and Open Source Geographic Information System
Q = Quantum
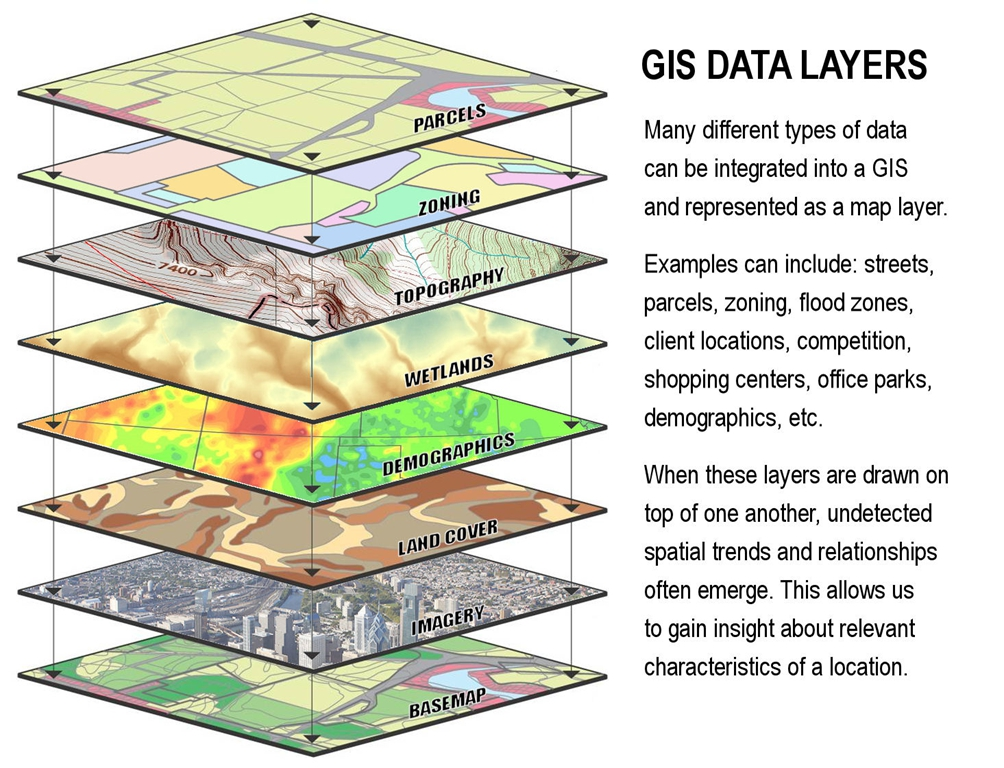
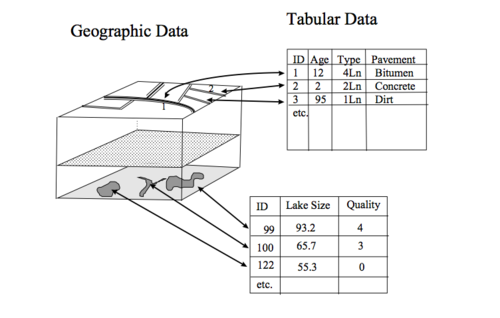
what is GIS?
(Geographic Information System)
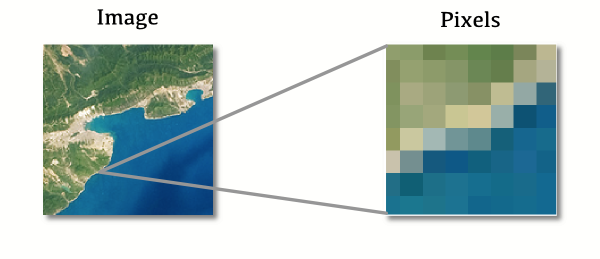
Raster
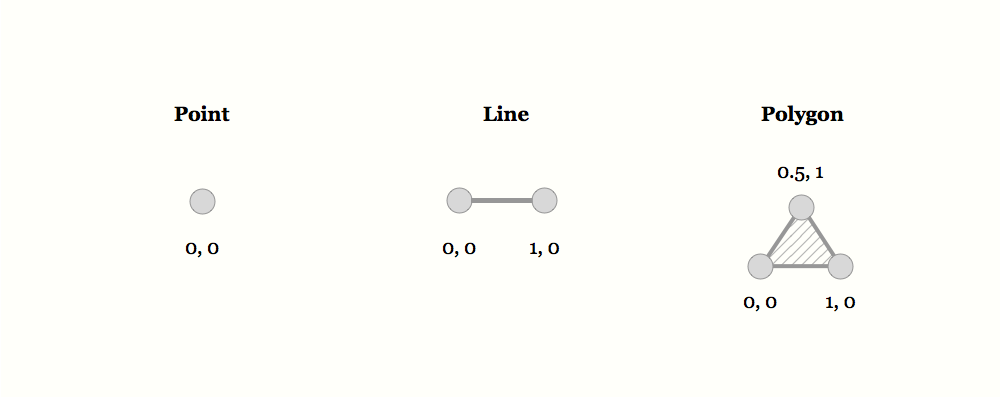
Vector
Vector
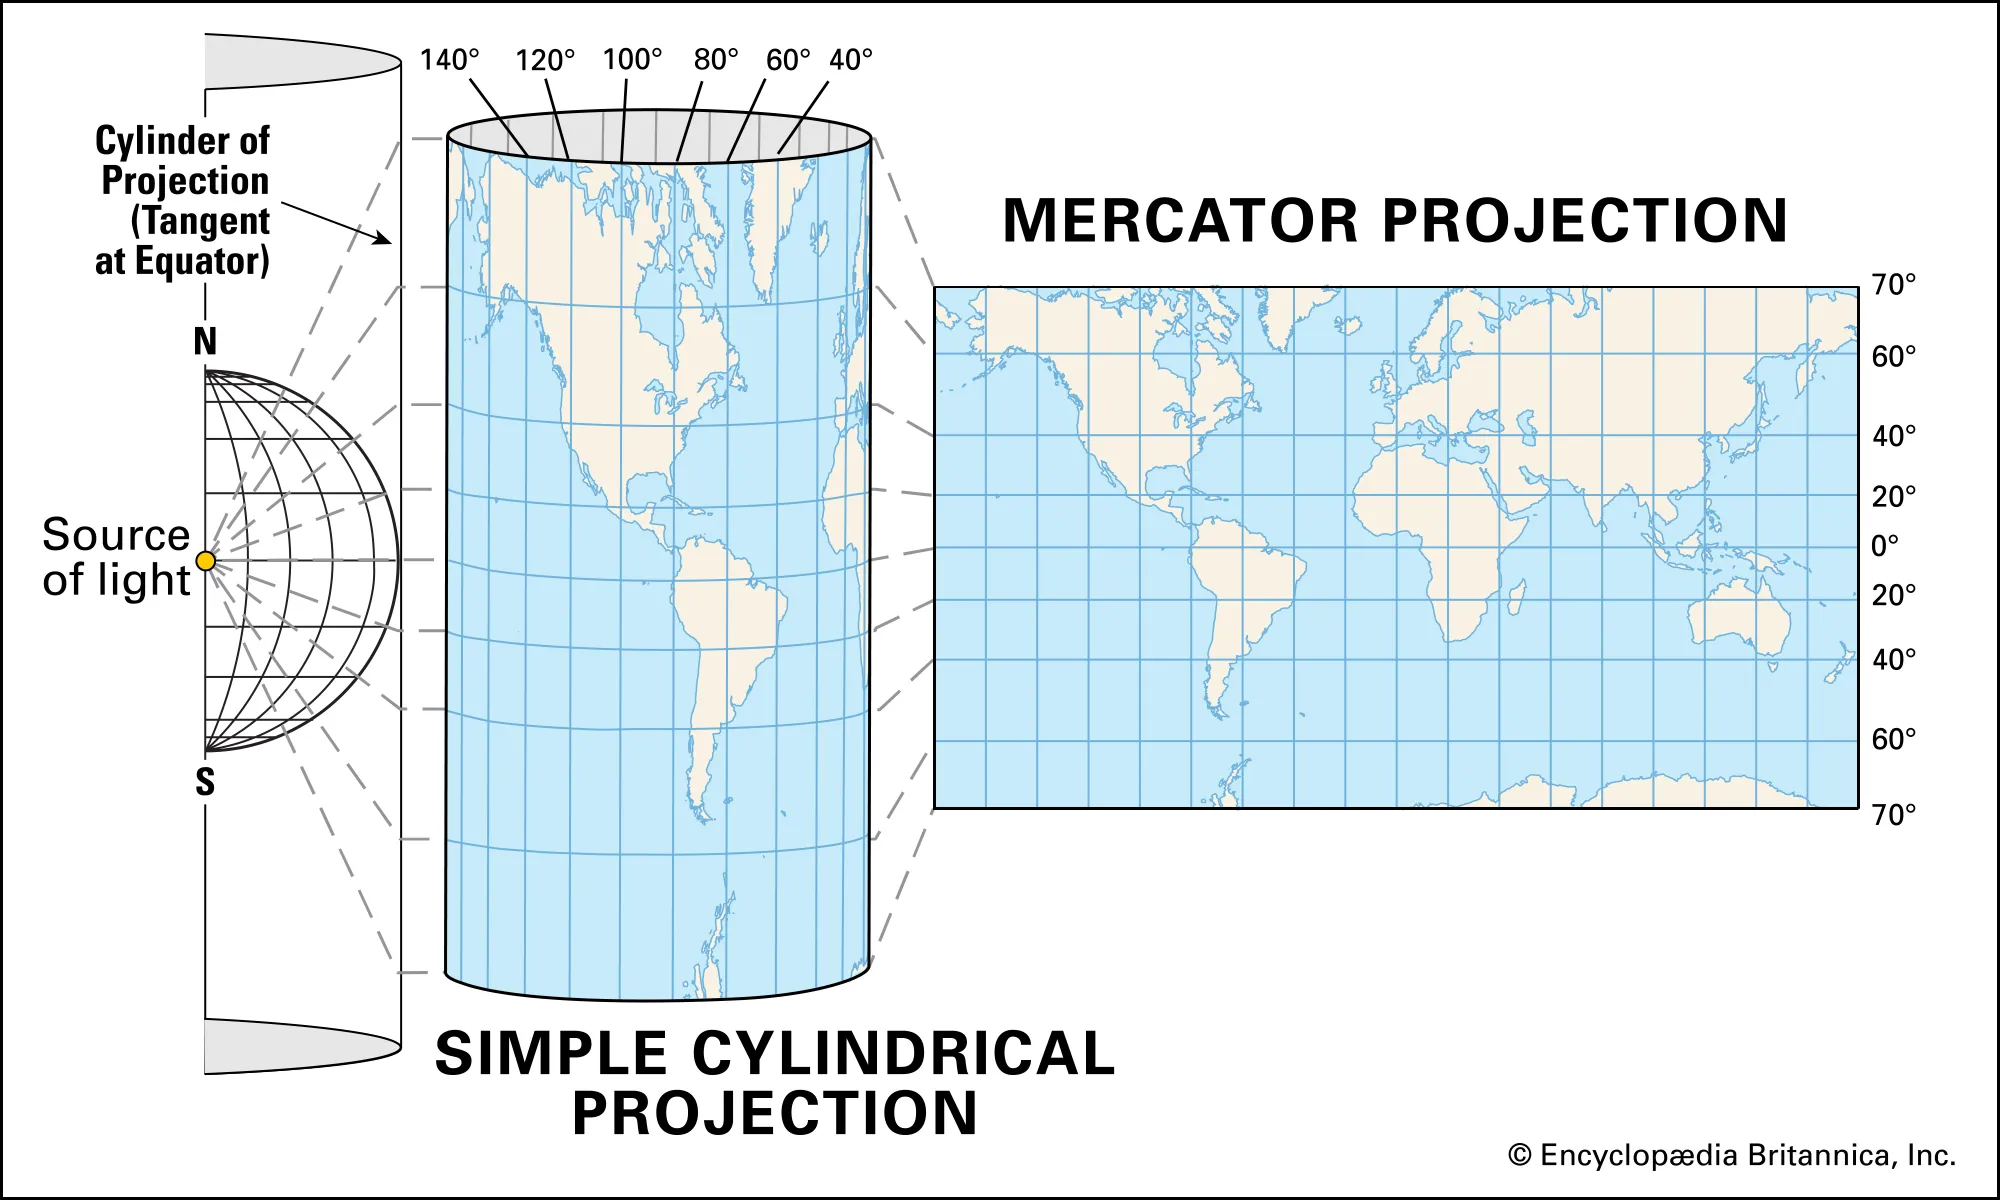
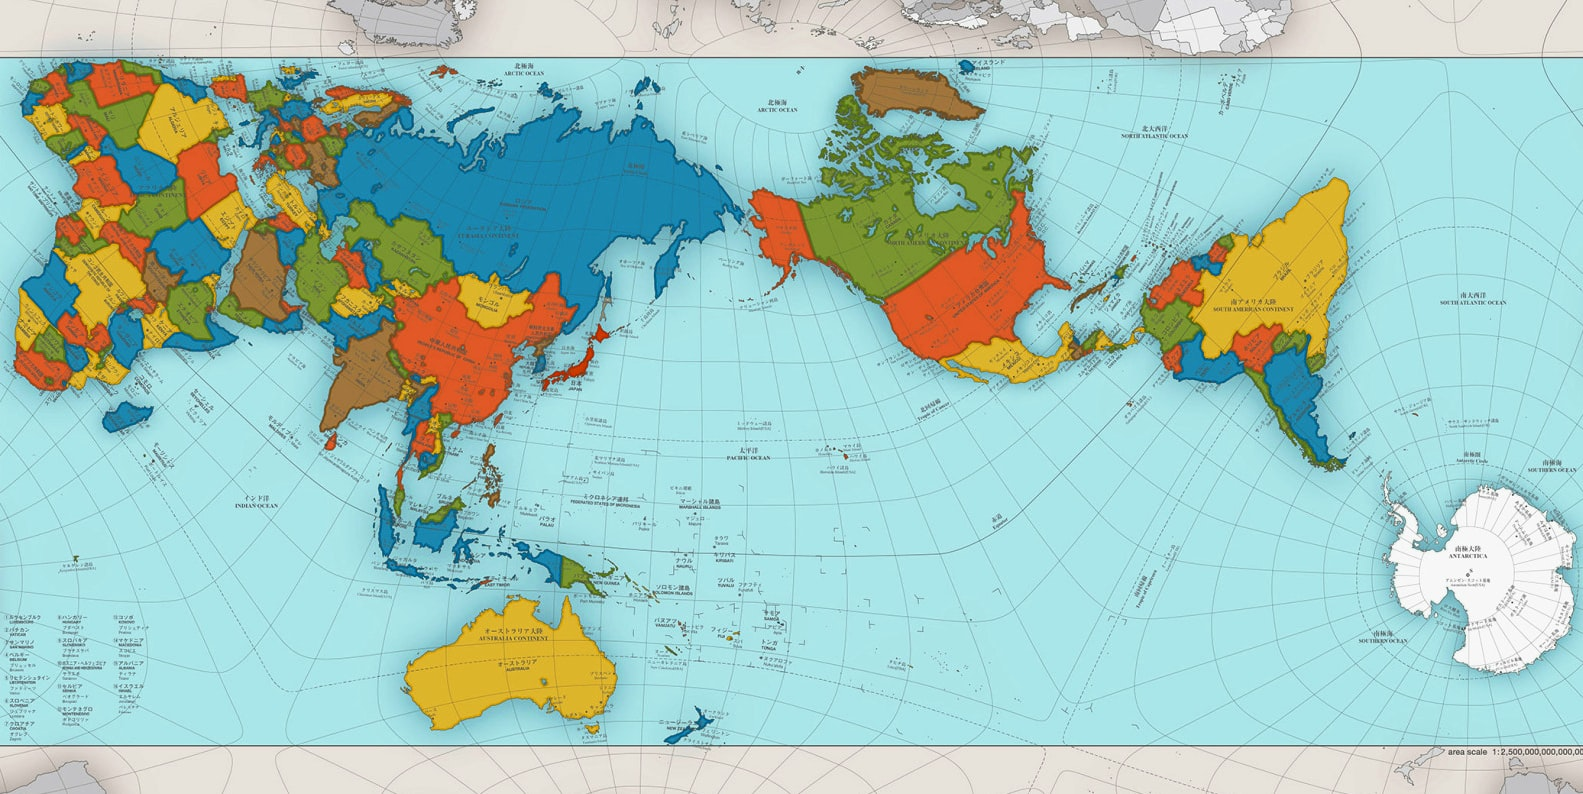
Projections
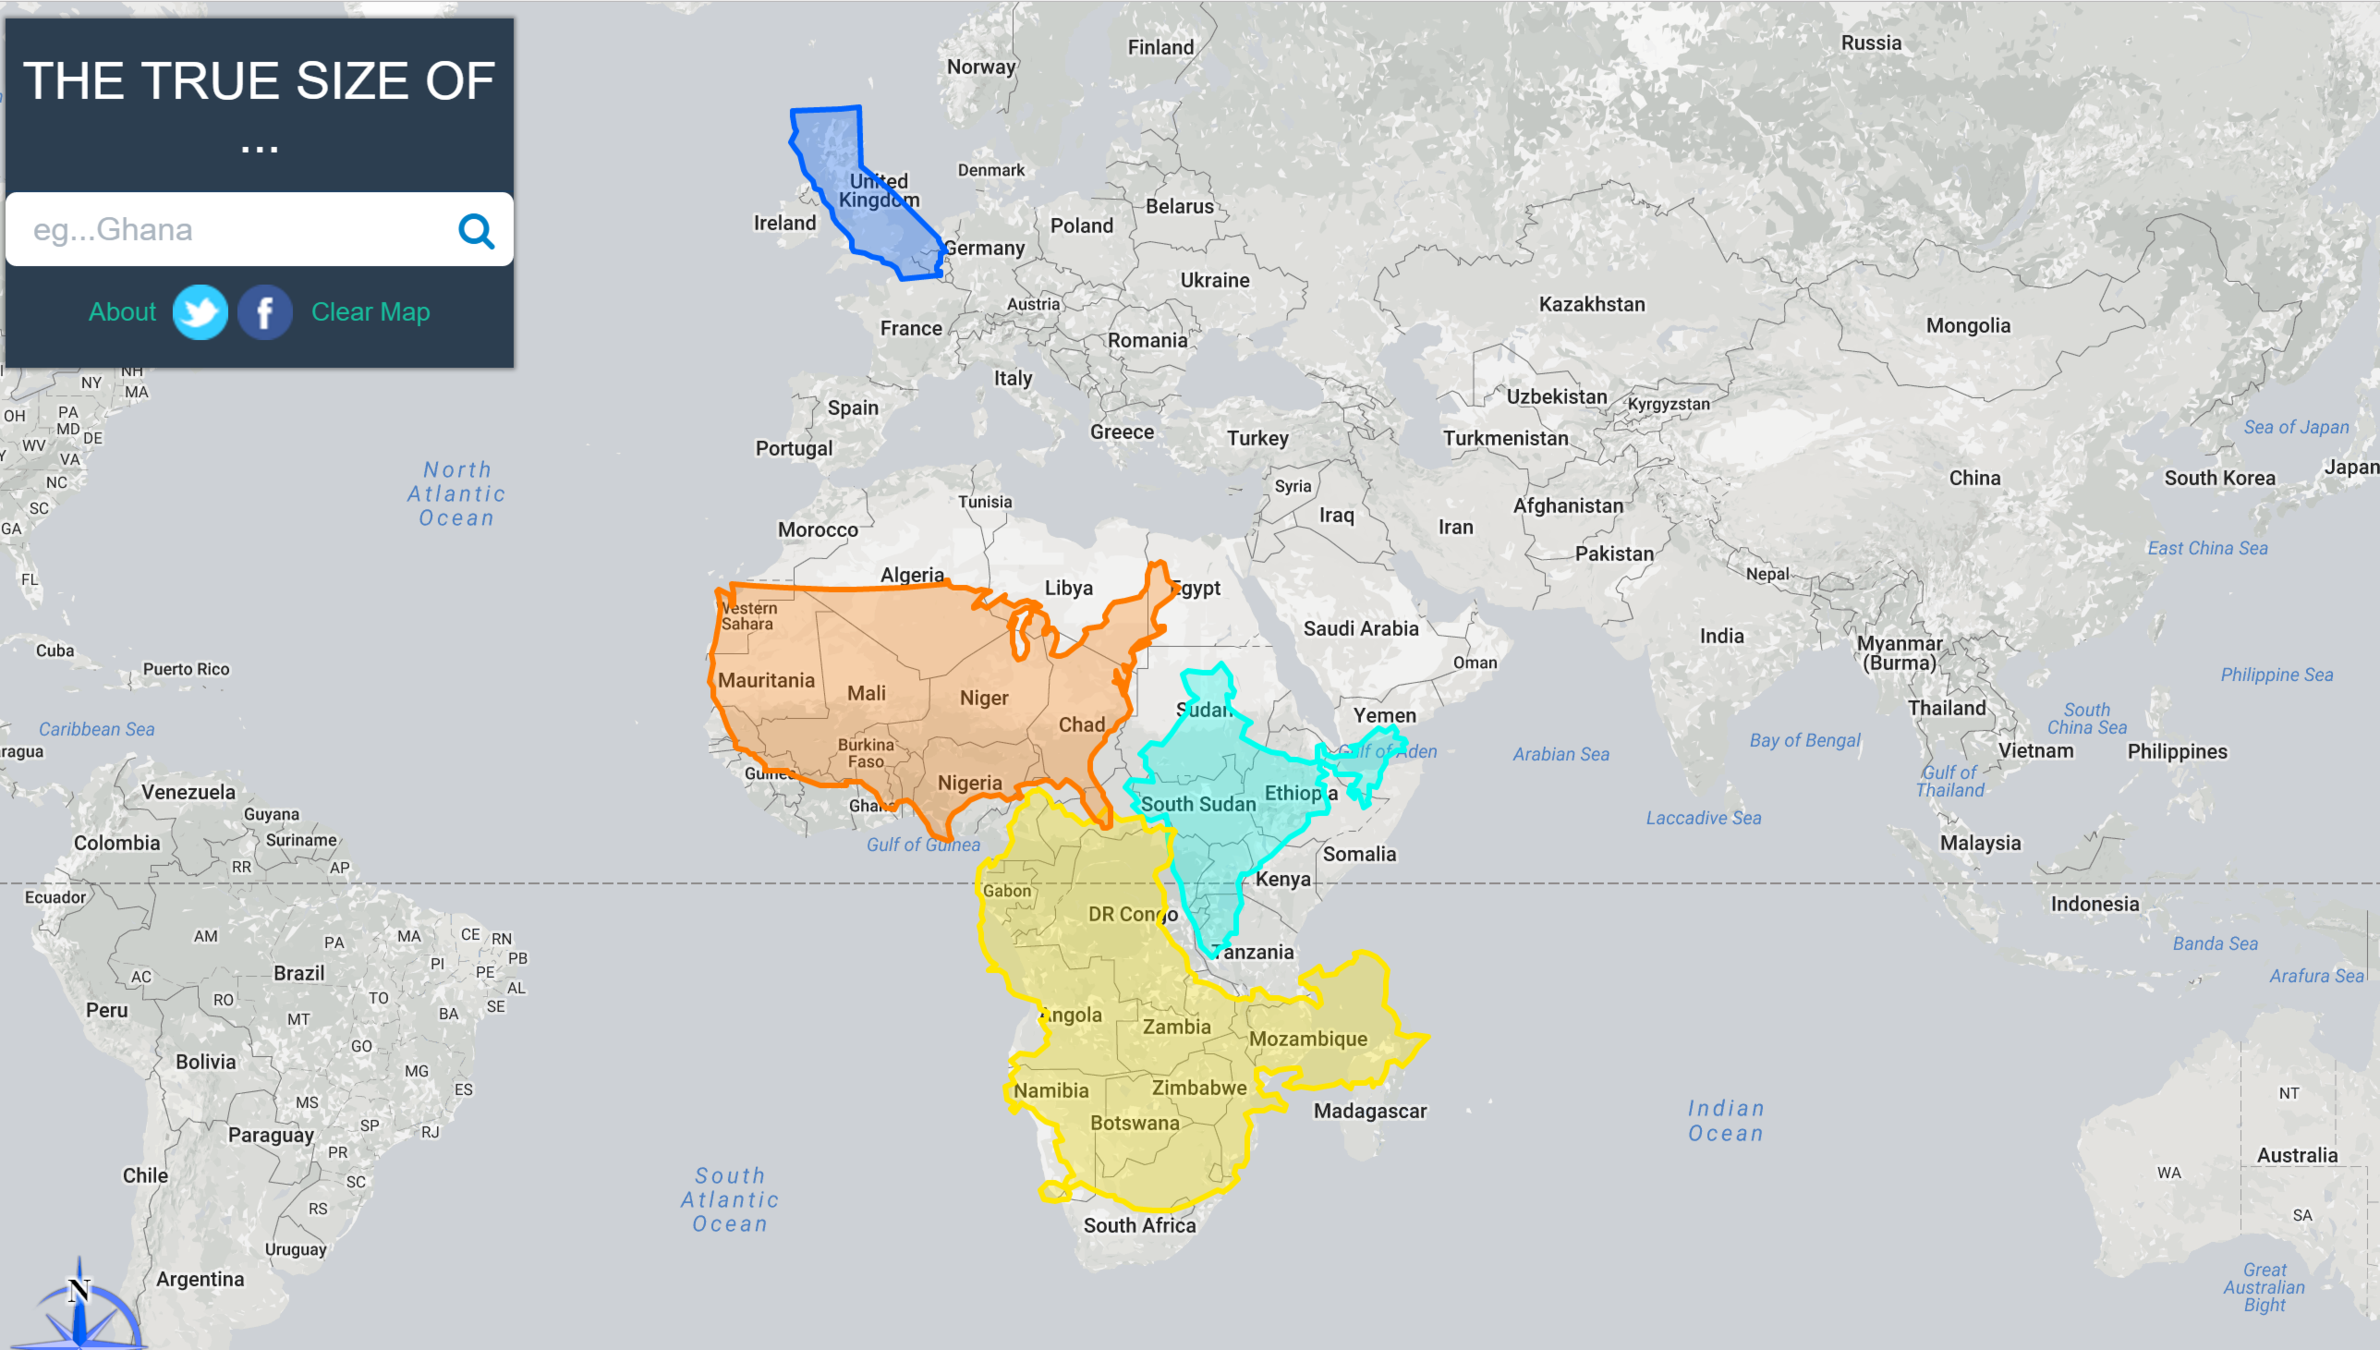
The True Size of... (in Mercator)
Resources on Install and Training
-
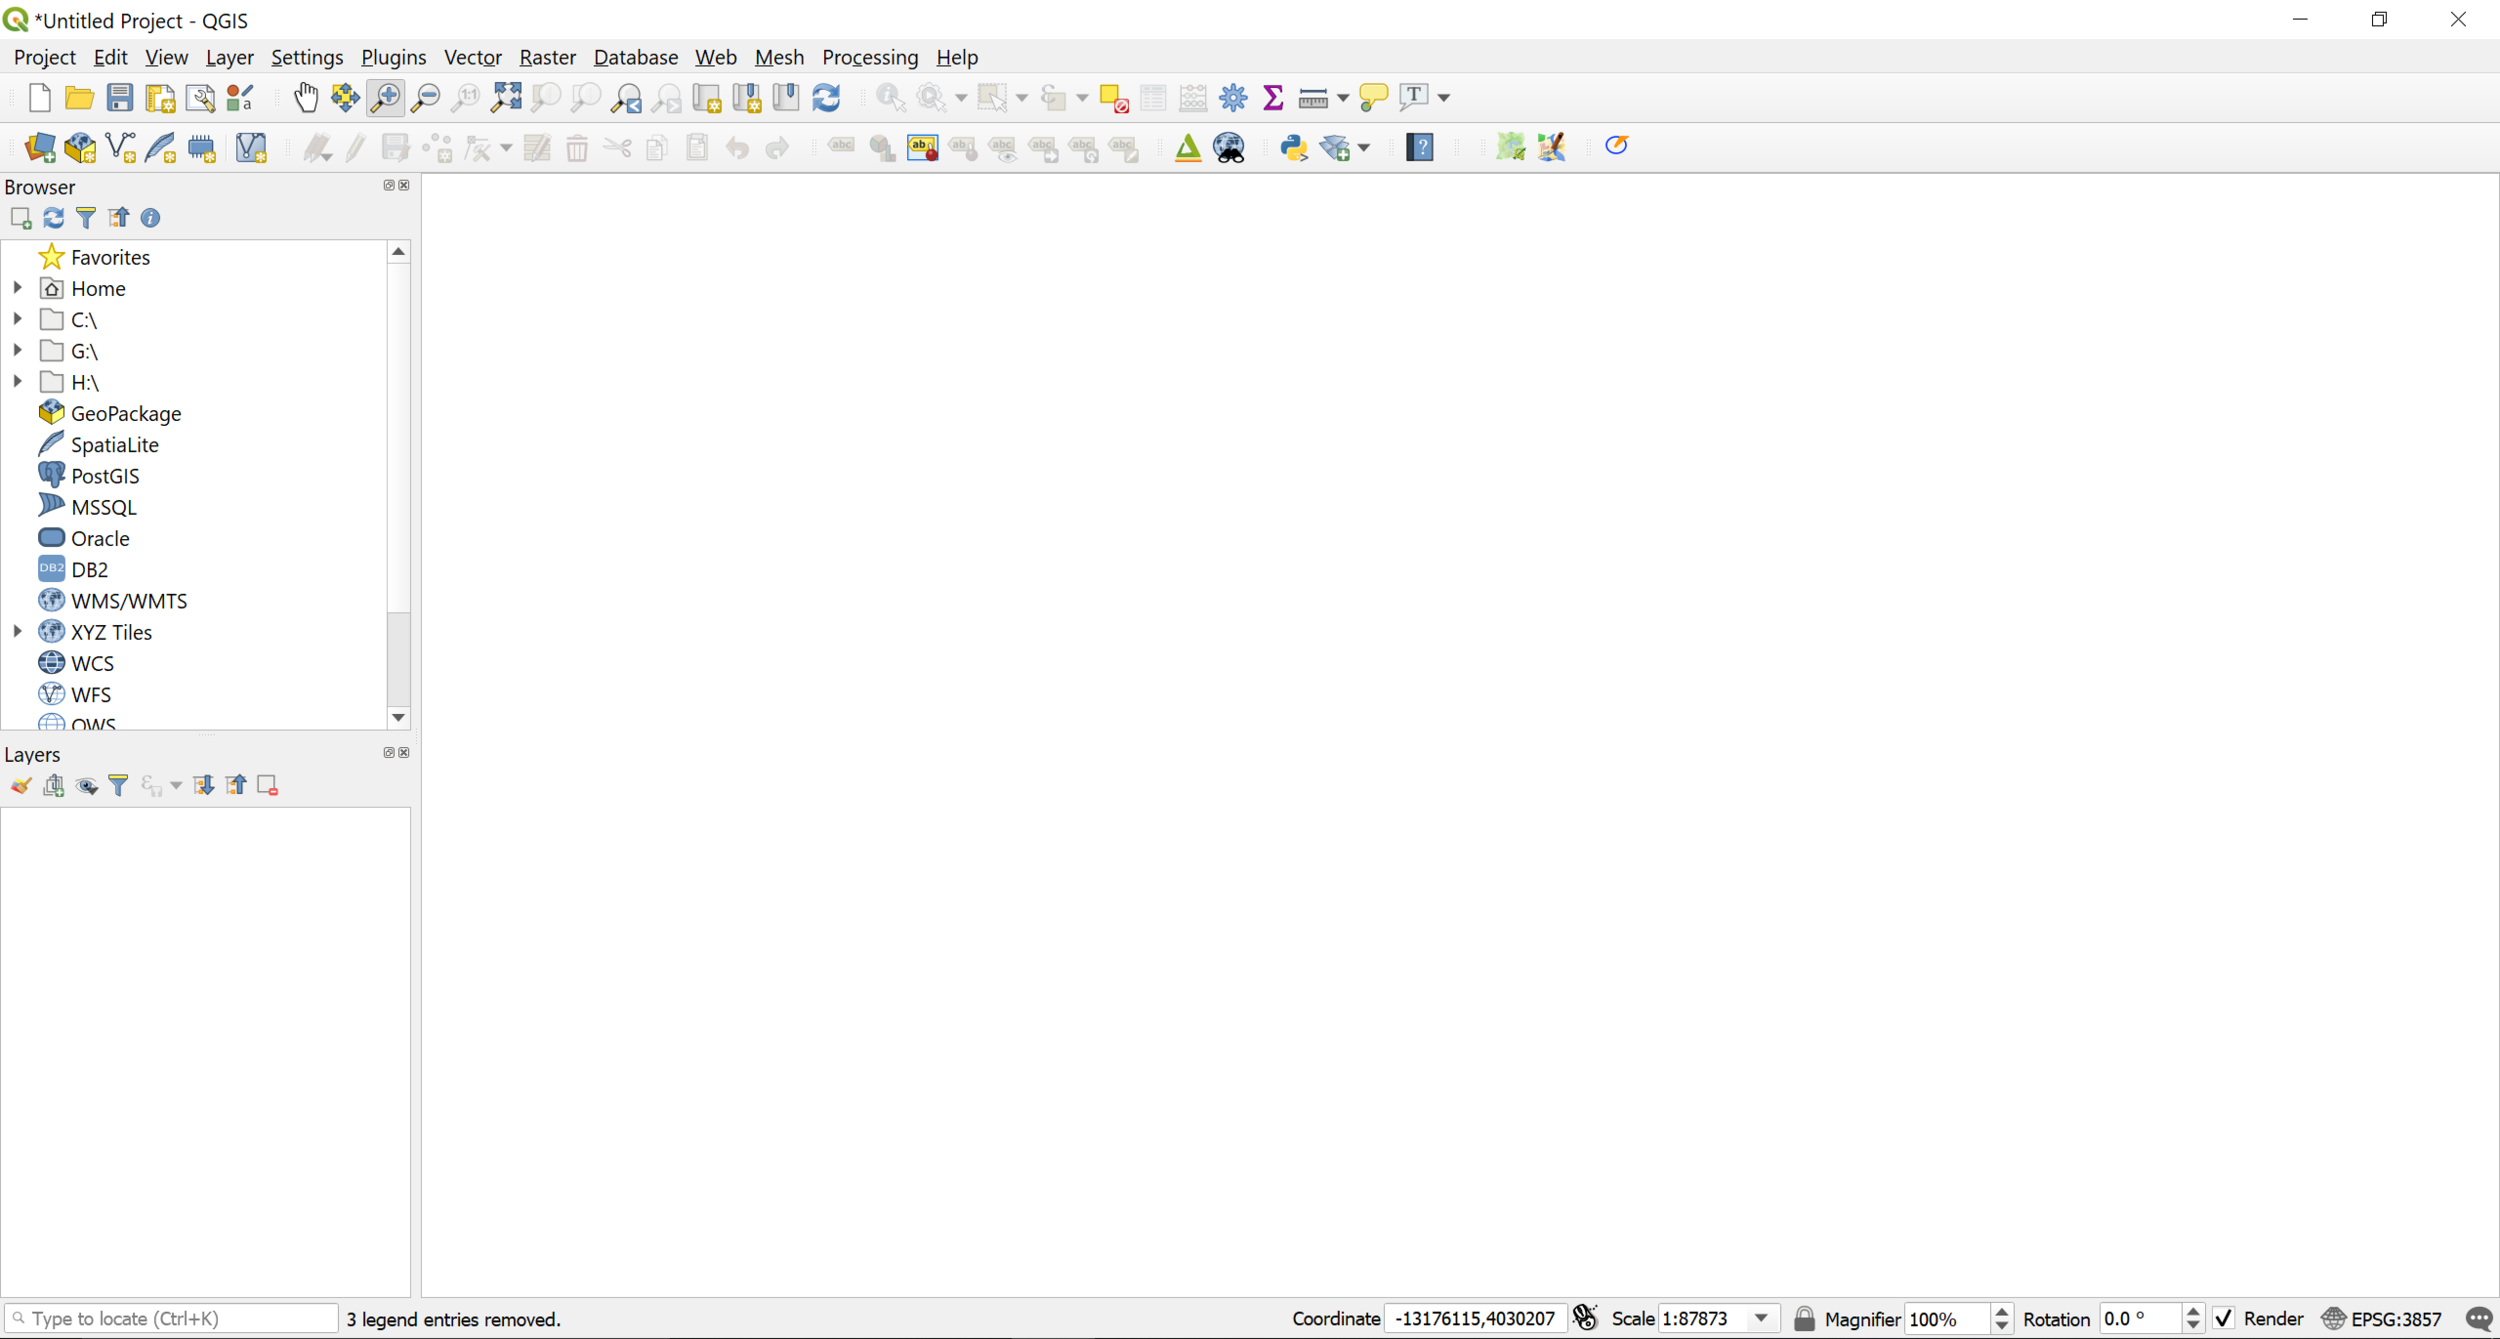
Layers List / Browser Panel
-
Toolbars
-
Map canvas
-
Status bar
-
Side Toolbar
QGIS Interface
Yea that's cool, but what if I want maps now....like now now and maybe add some data on top of it?
So let's add some basemaps!
Two ways (but could be more)
- Adding plugins like OpenLayers
2. Using a python script for more maps
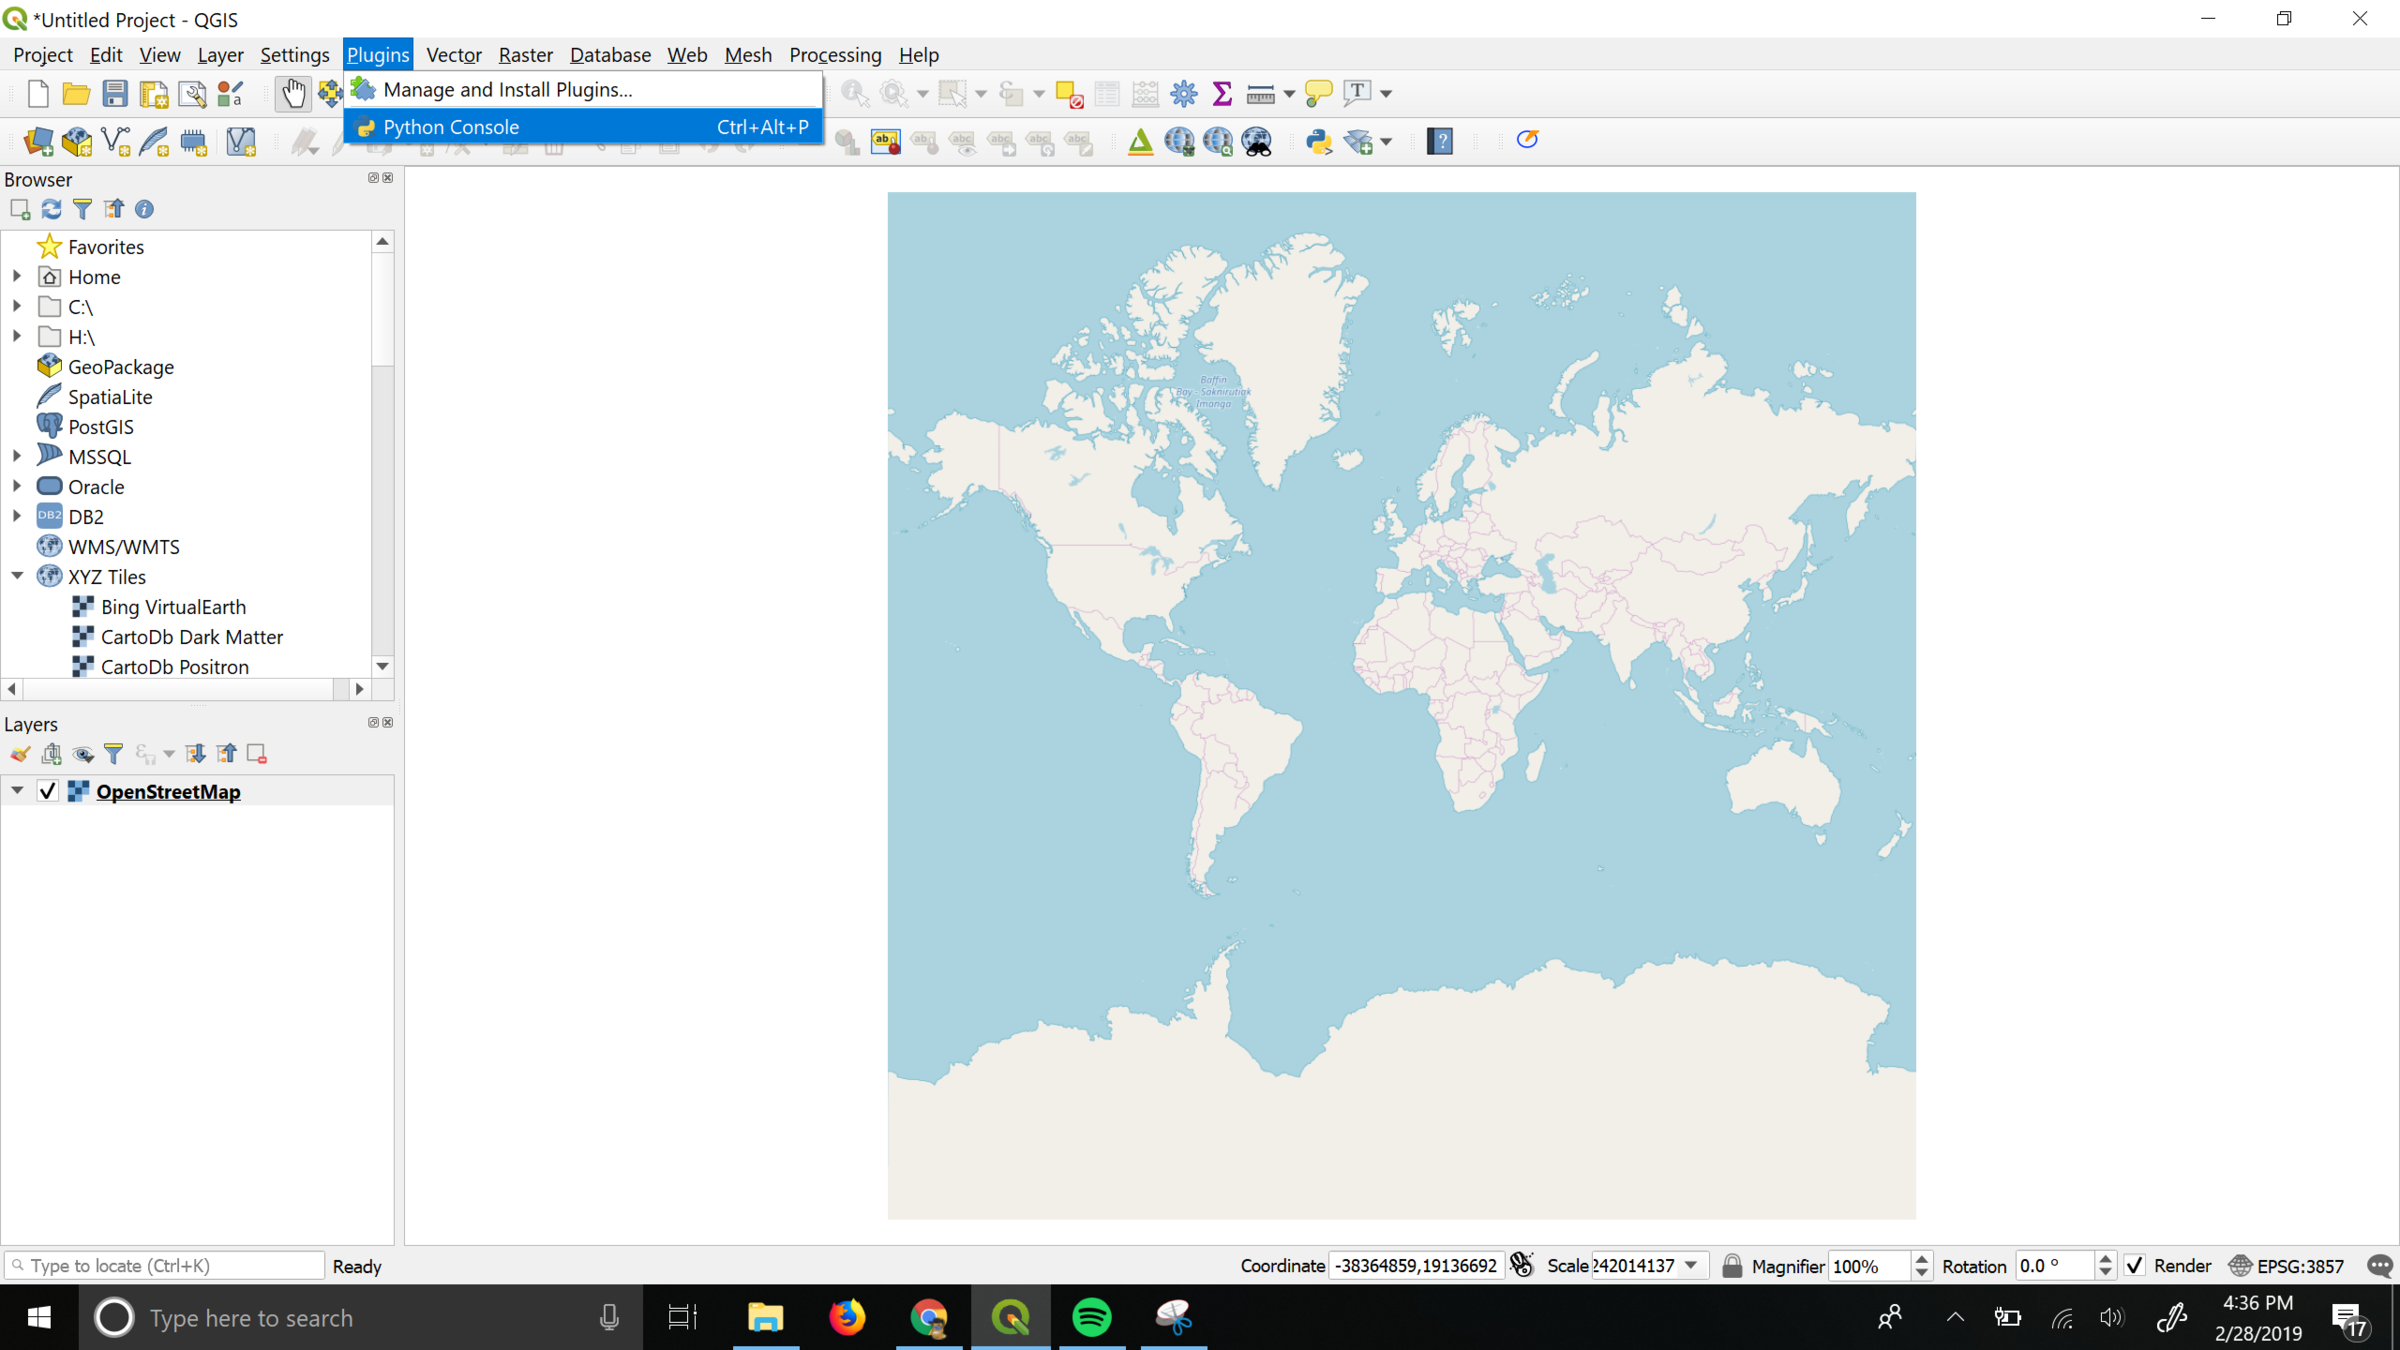
Adding Plugins
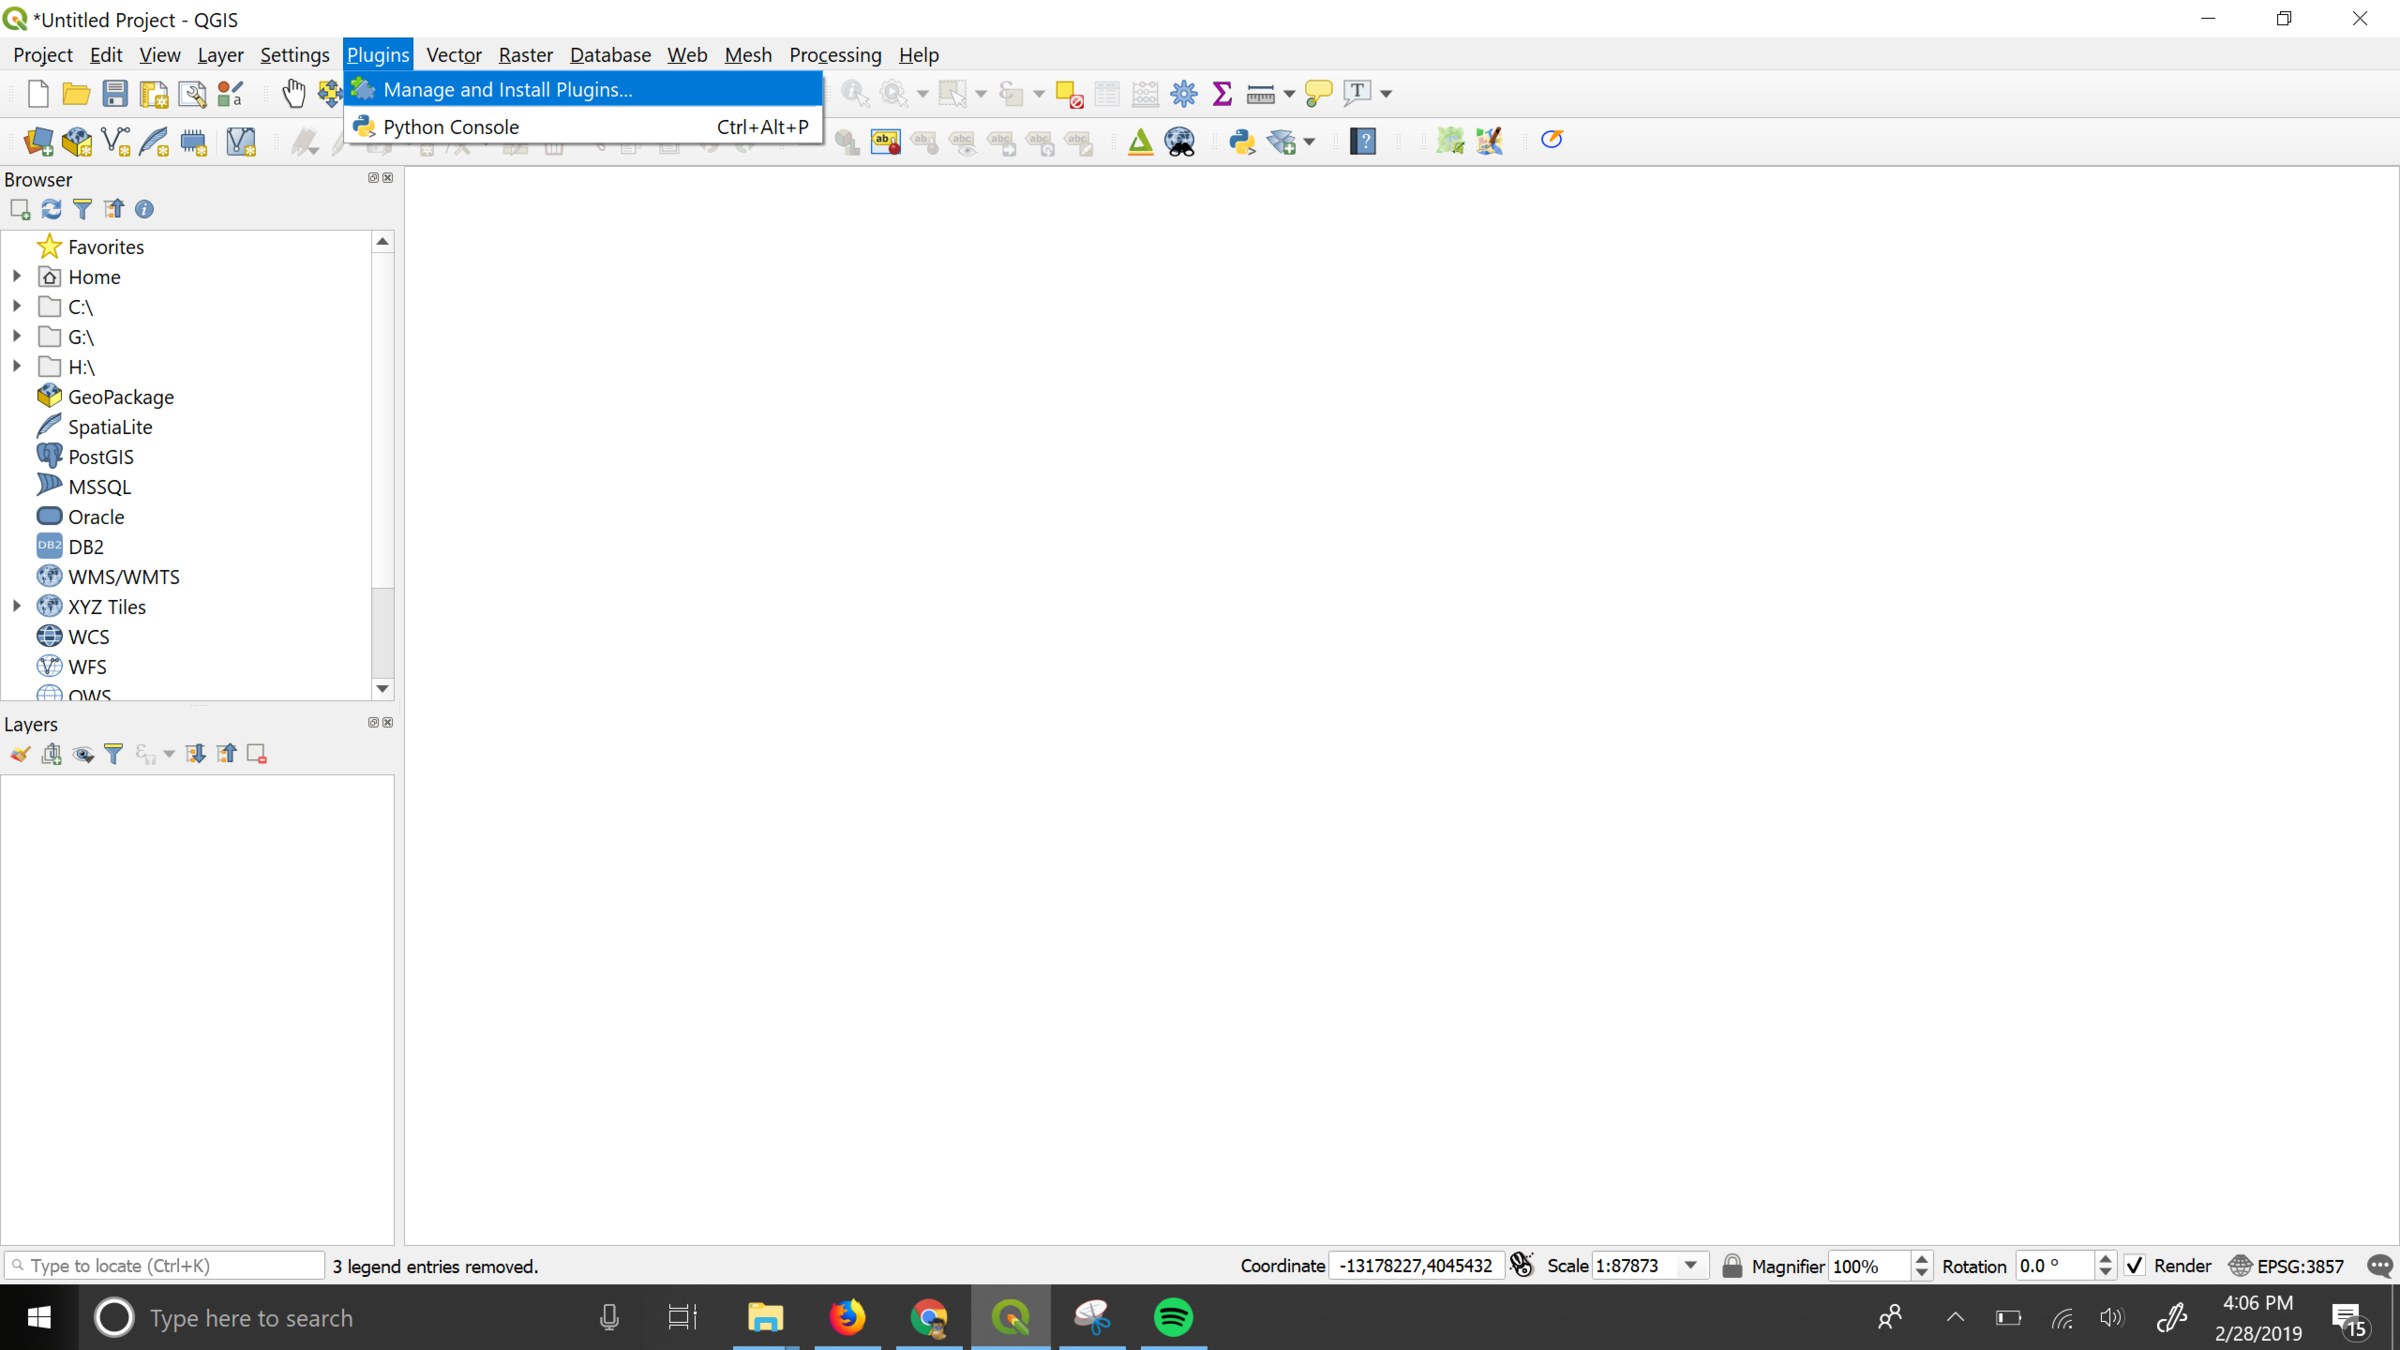
In the menu, select plugins, then
manage and install plugins
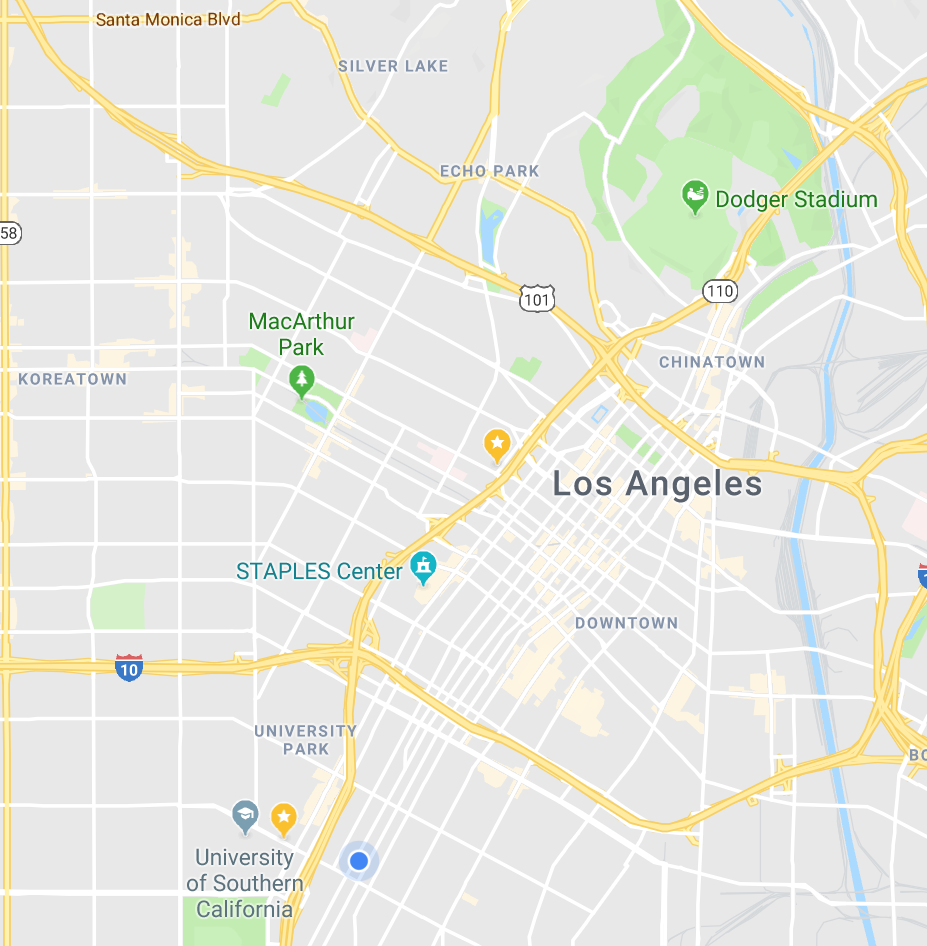
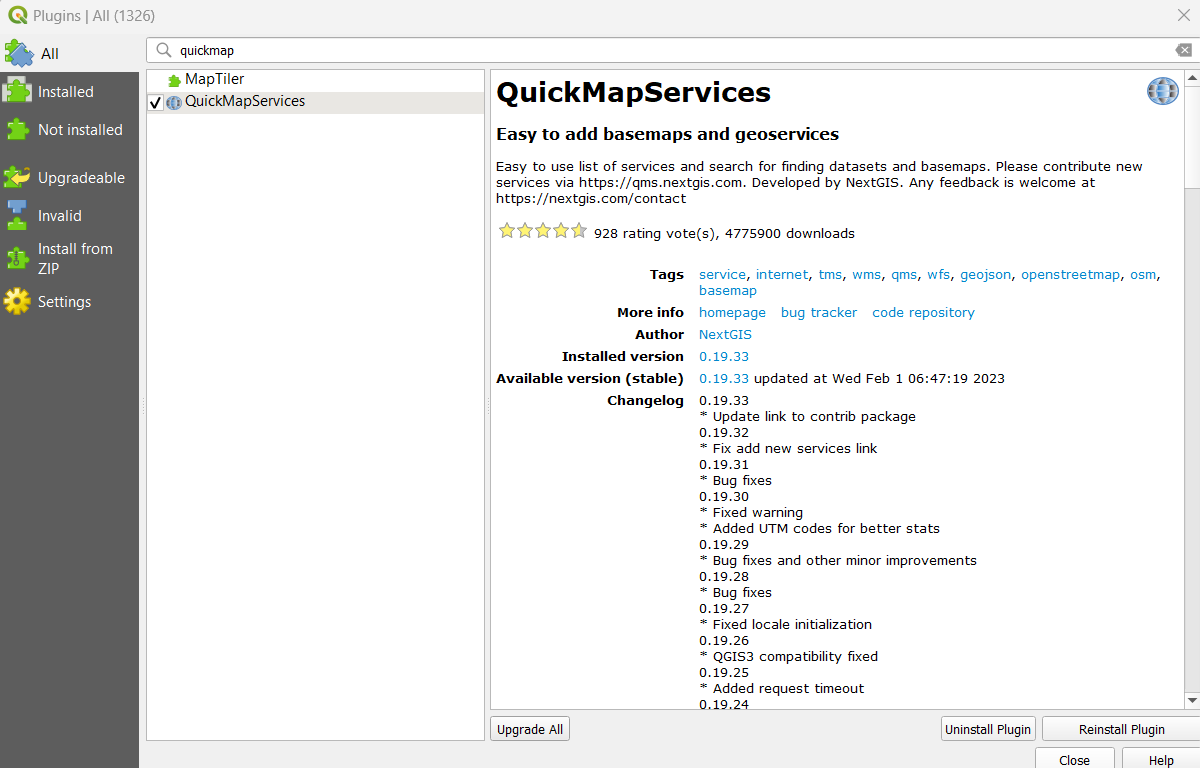
Adding Basemaps
1. Search for QuickMapServices
2. Install plugin
Adding Basemaps
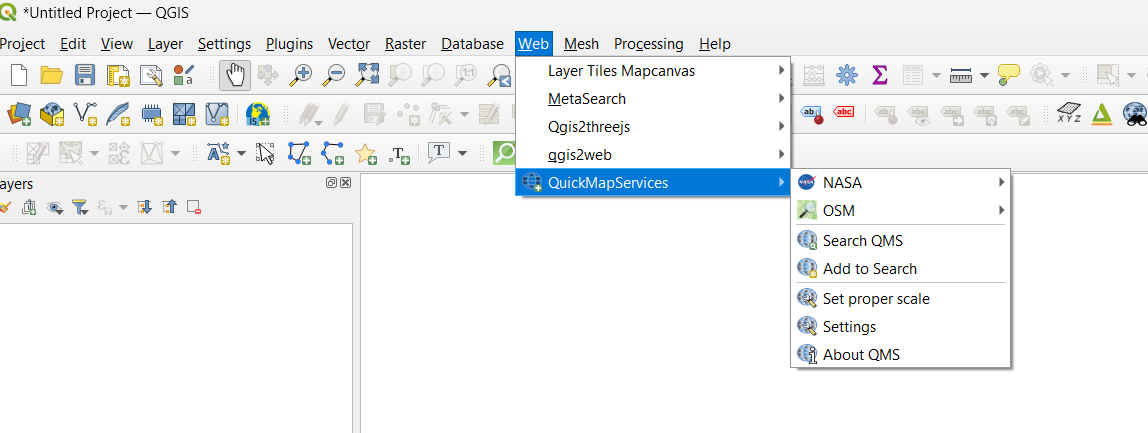
1. Find the Installed Plugin
2.Choose a basemap!
That's all the basemaps?
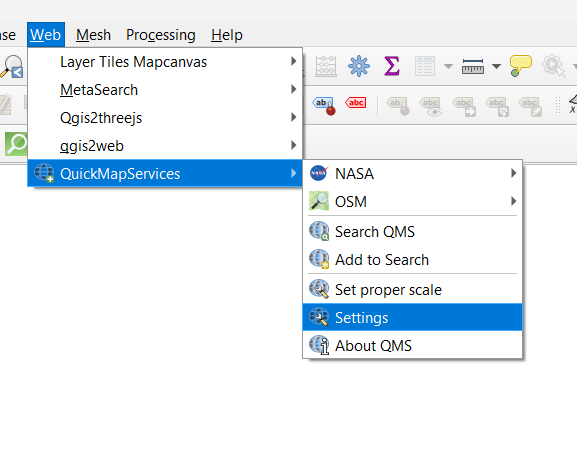
Adding Basemaps
- goto settings
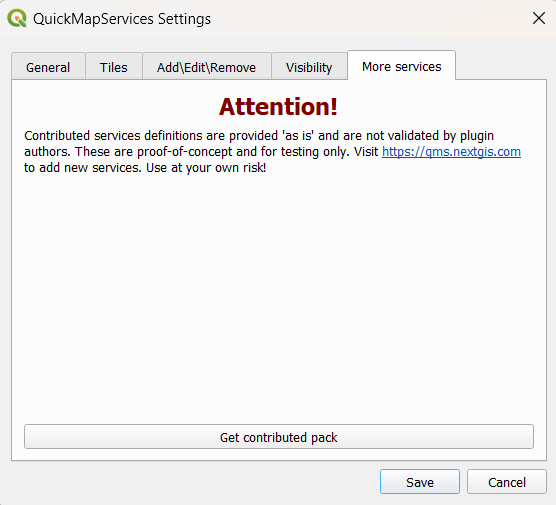
- select the "more services" tab
- Select get contributed pack
- voila!
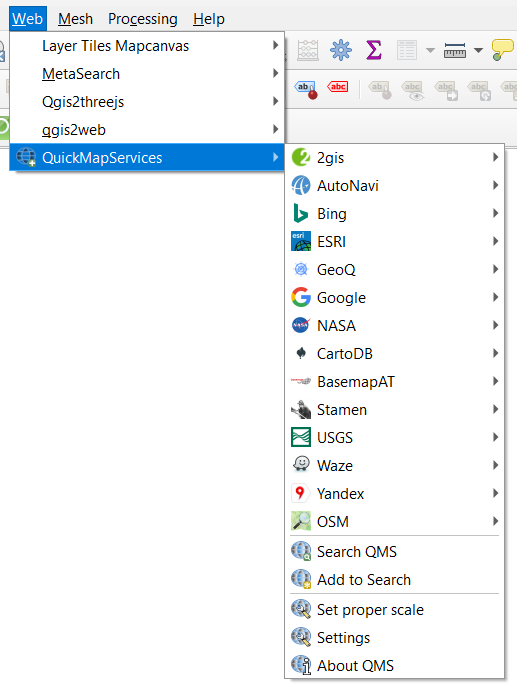
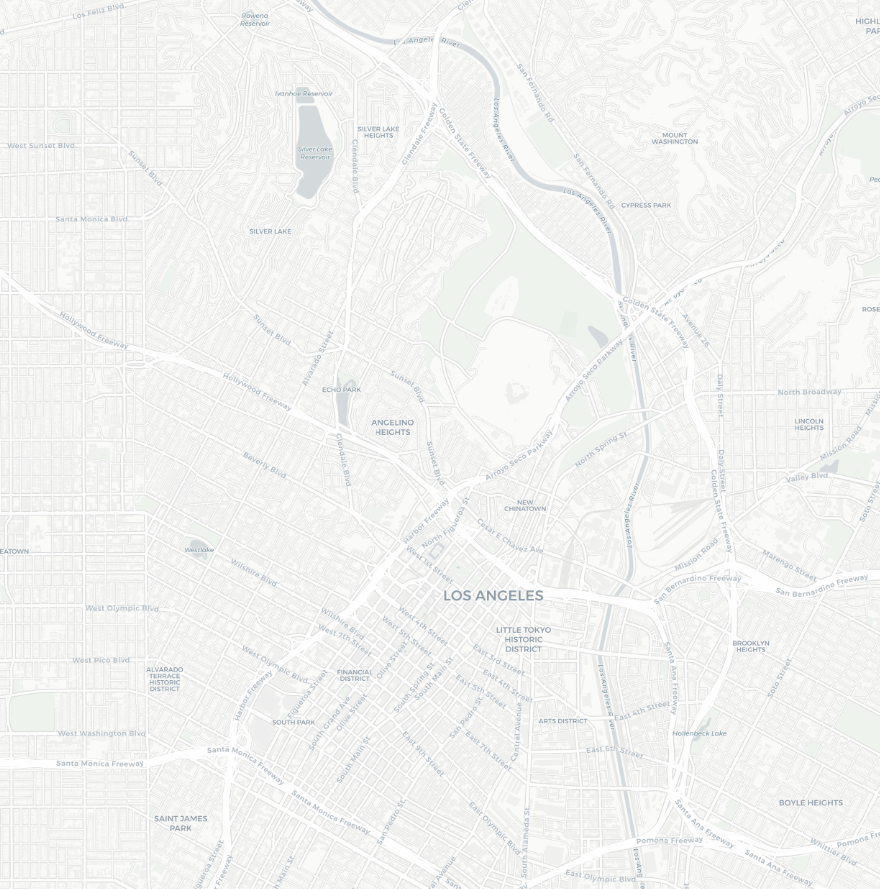
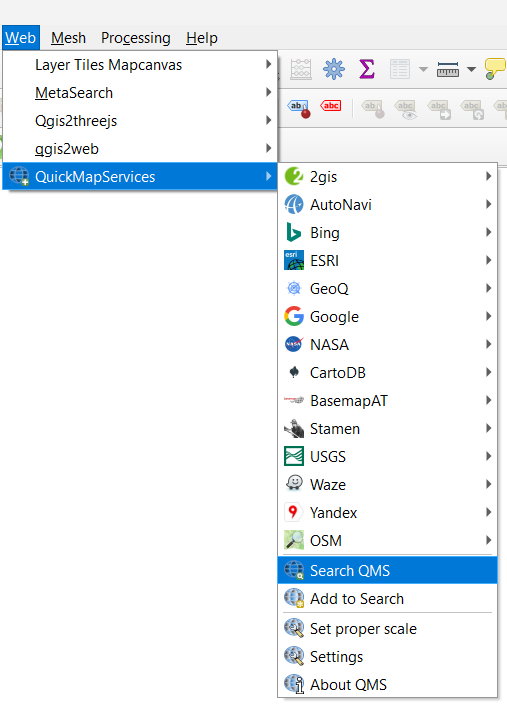
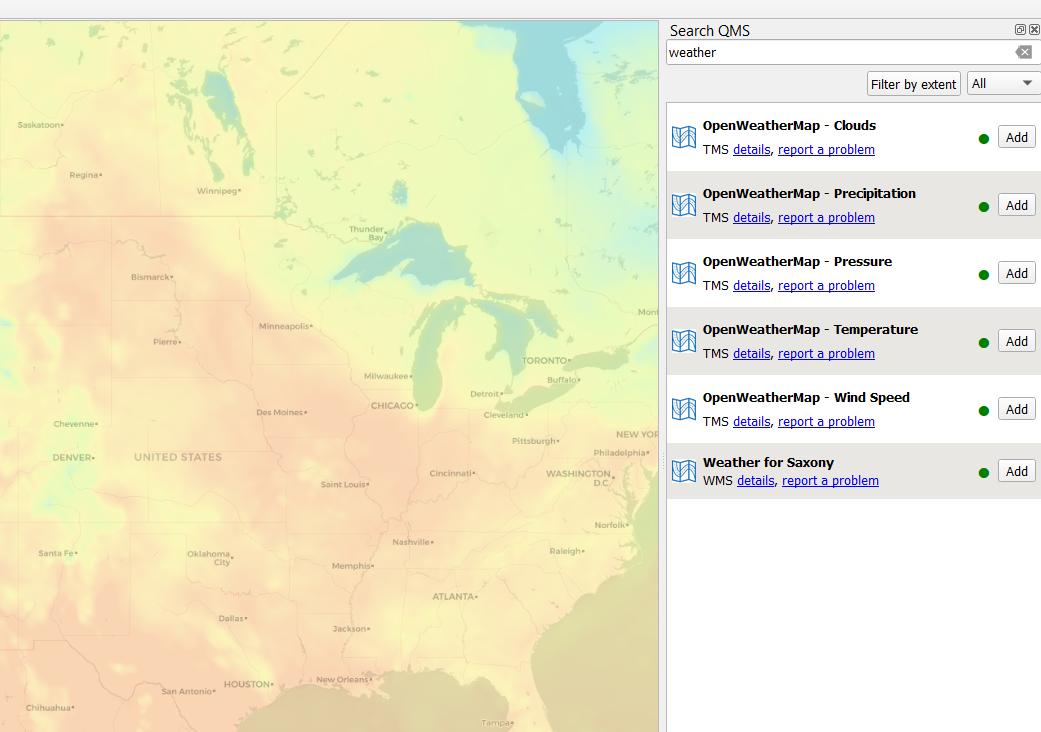
Adding Basemaps
- goto seach QMS
- find a list here, https://qms.nextgis.com/
- find something like, "weather"
- click to add
Adding more basemaps using a python script
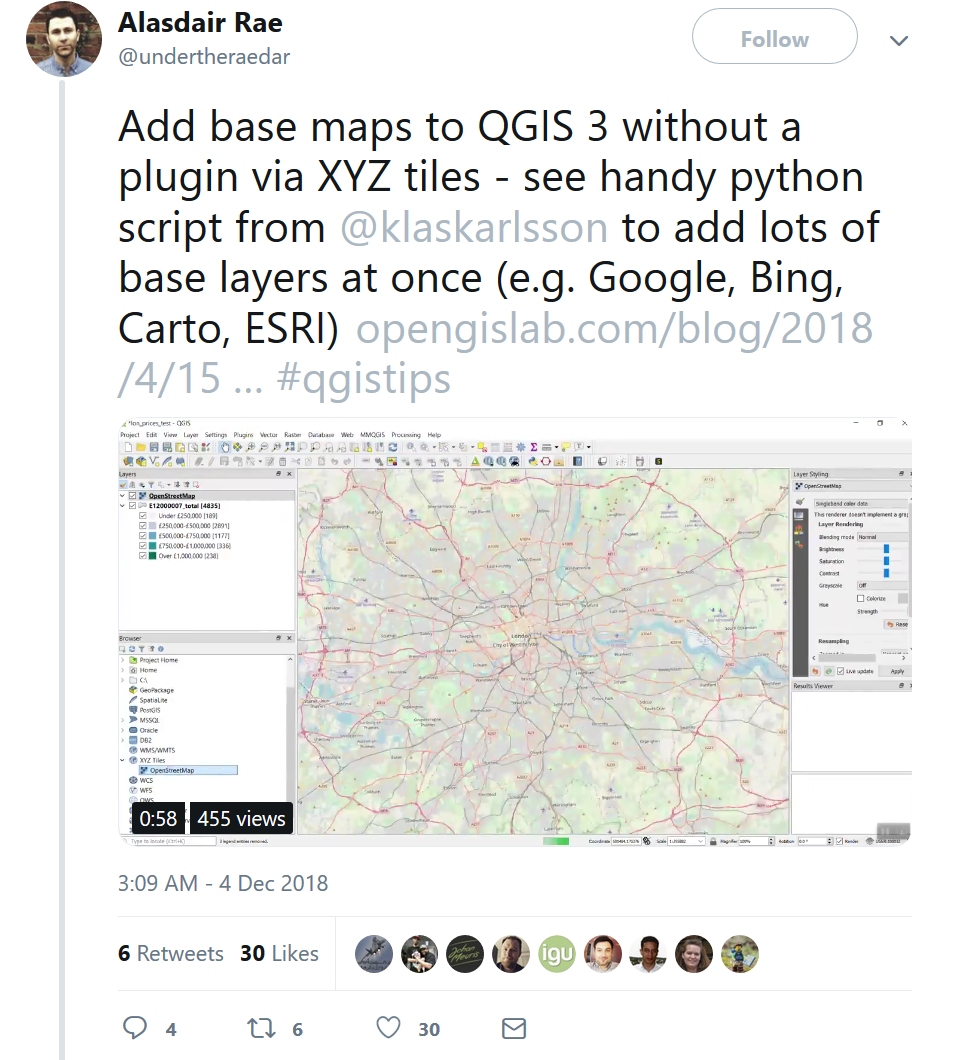
Adding more basemaps using a python script

Should look like this
Adding more basemaps using a python script
Let's open up a python console to drop code in.
Adding more basemaps using a python script
1. Click the button labeled "Show Editor"
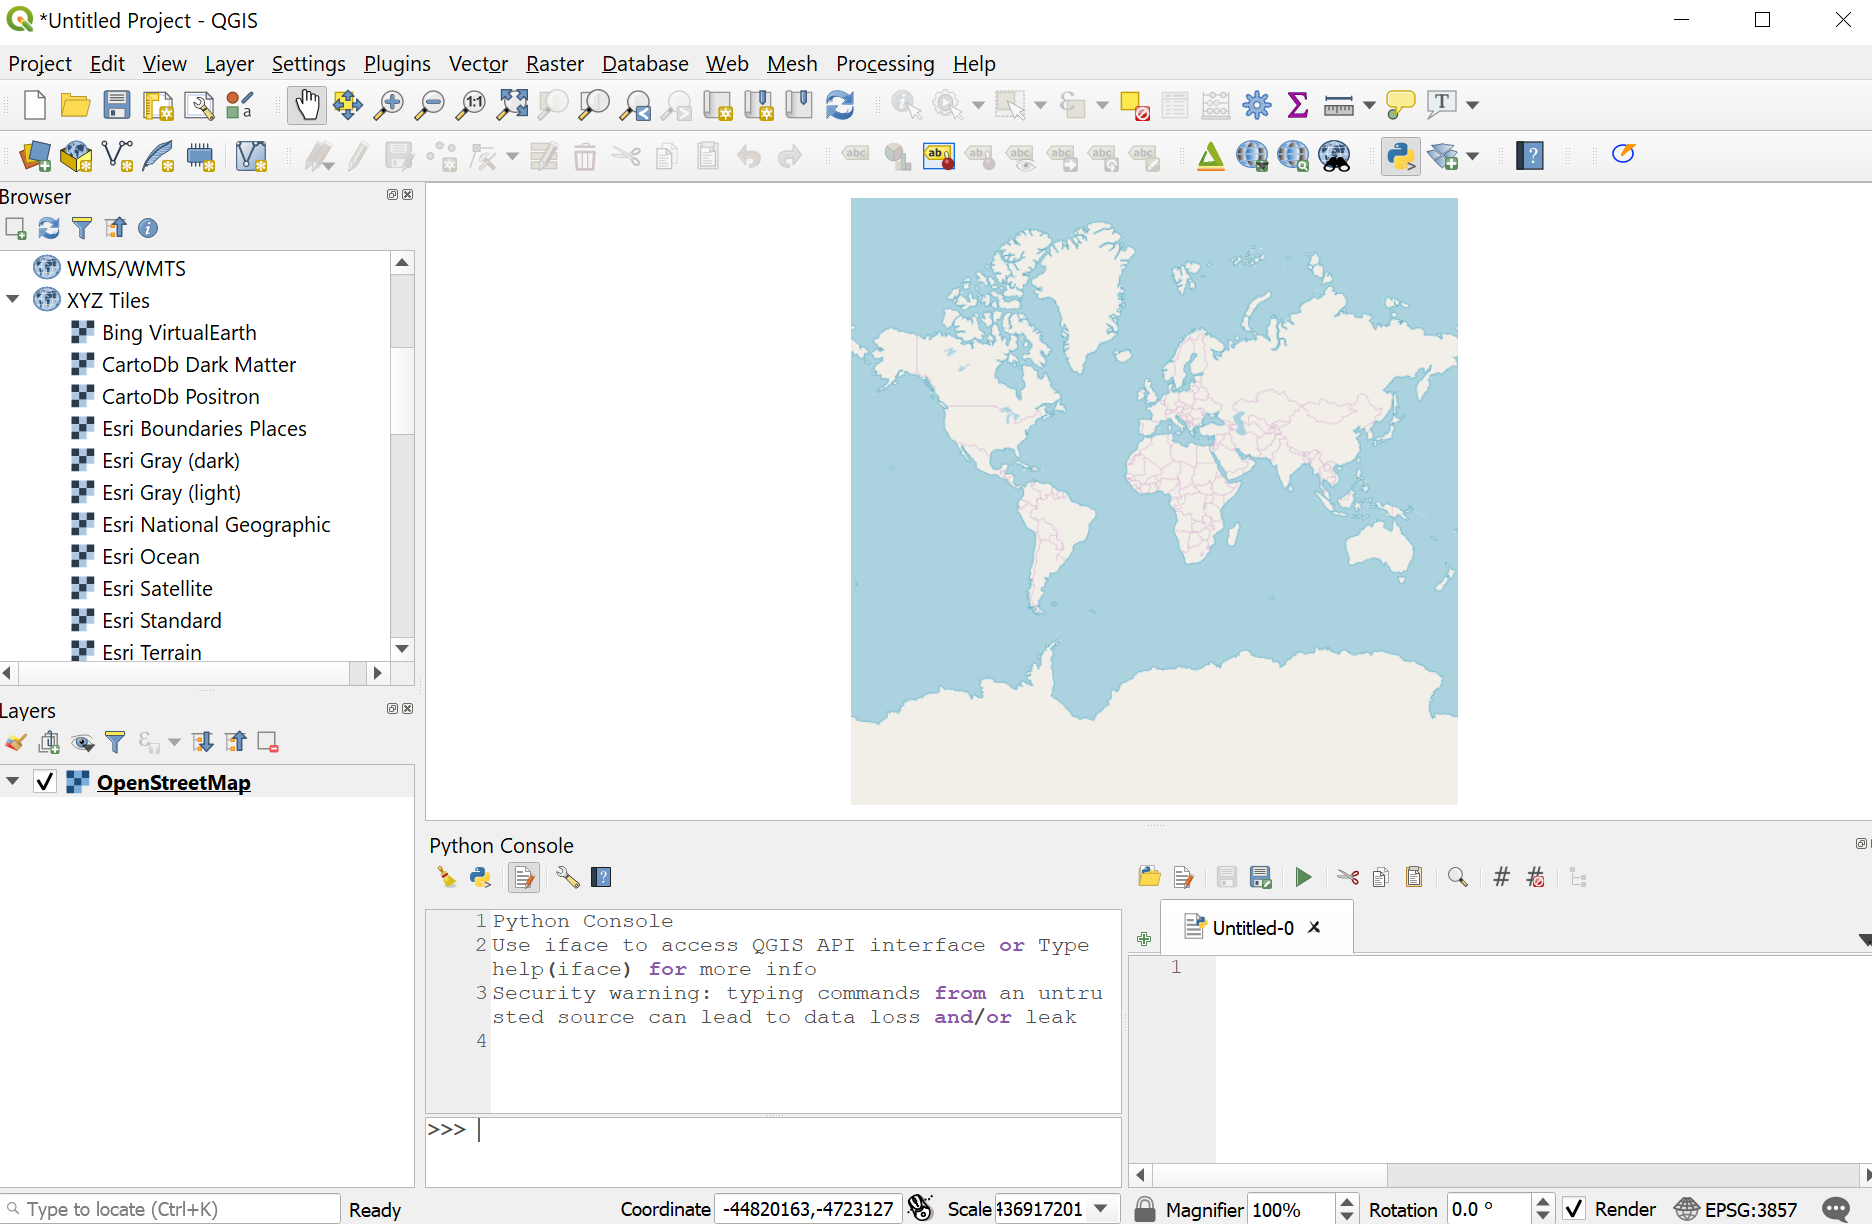
2. Click "Open" to load the python script
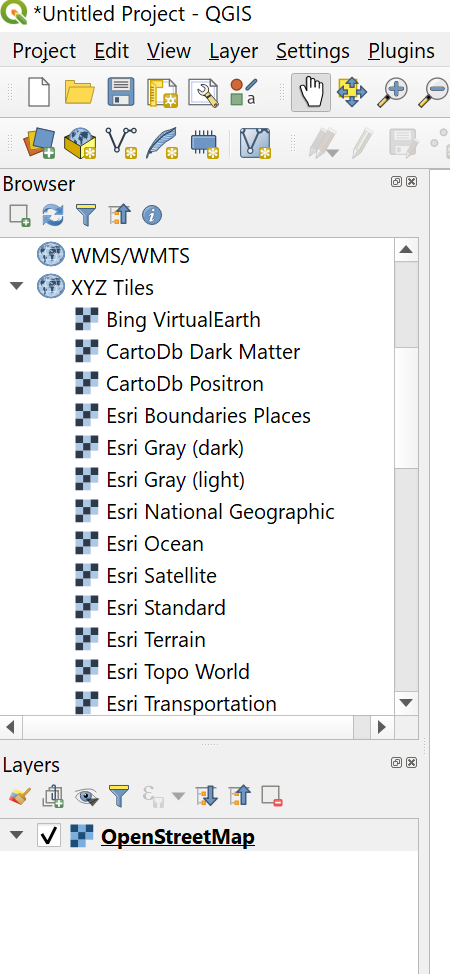
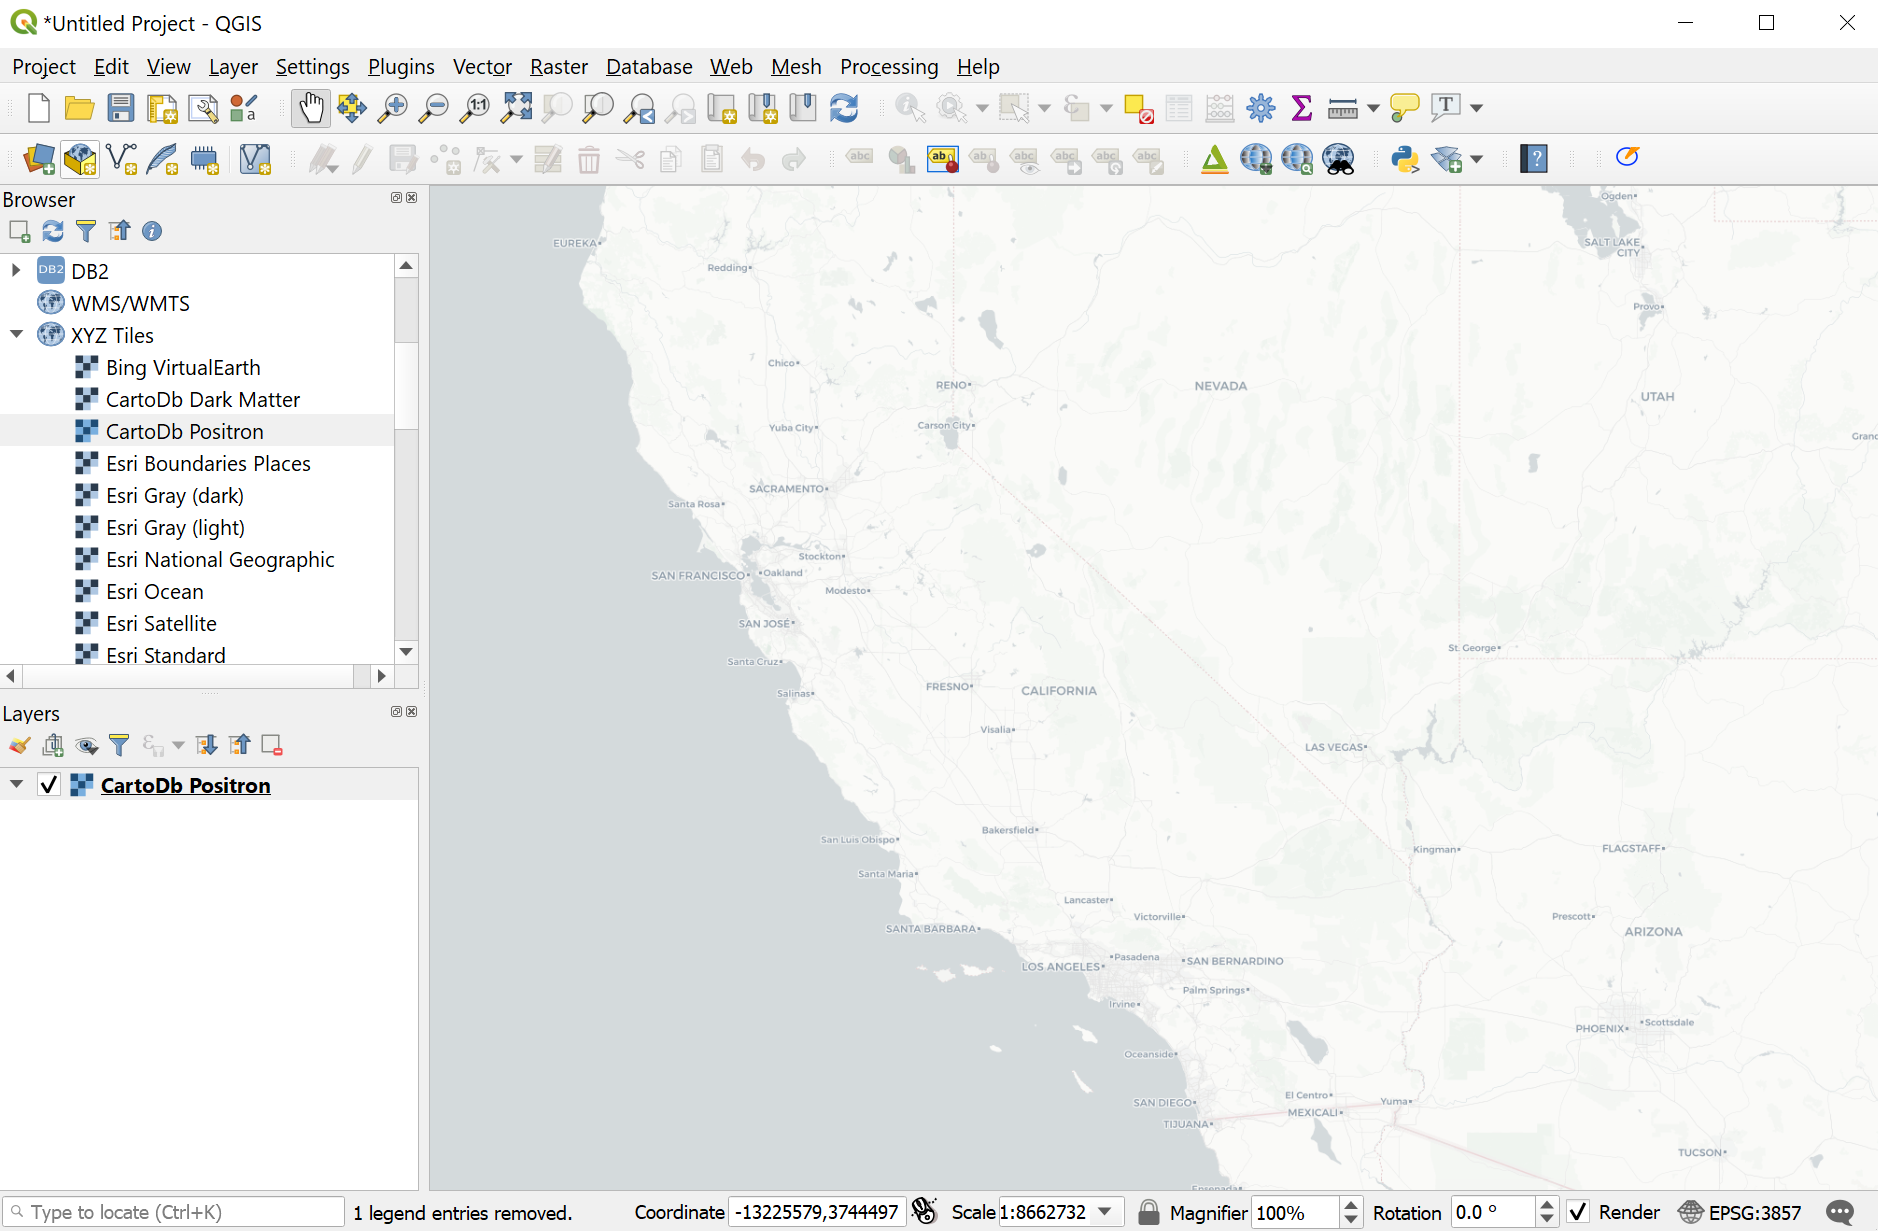
Adding more basemaps using a python script
1. Open the XYZ Tiles to show the list and select one
Yay! Ok so I want to add some data, where do I look?
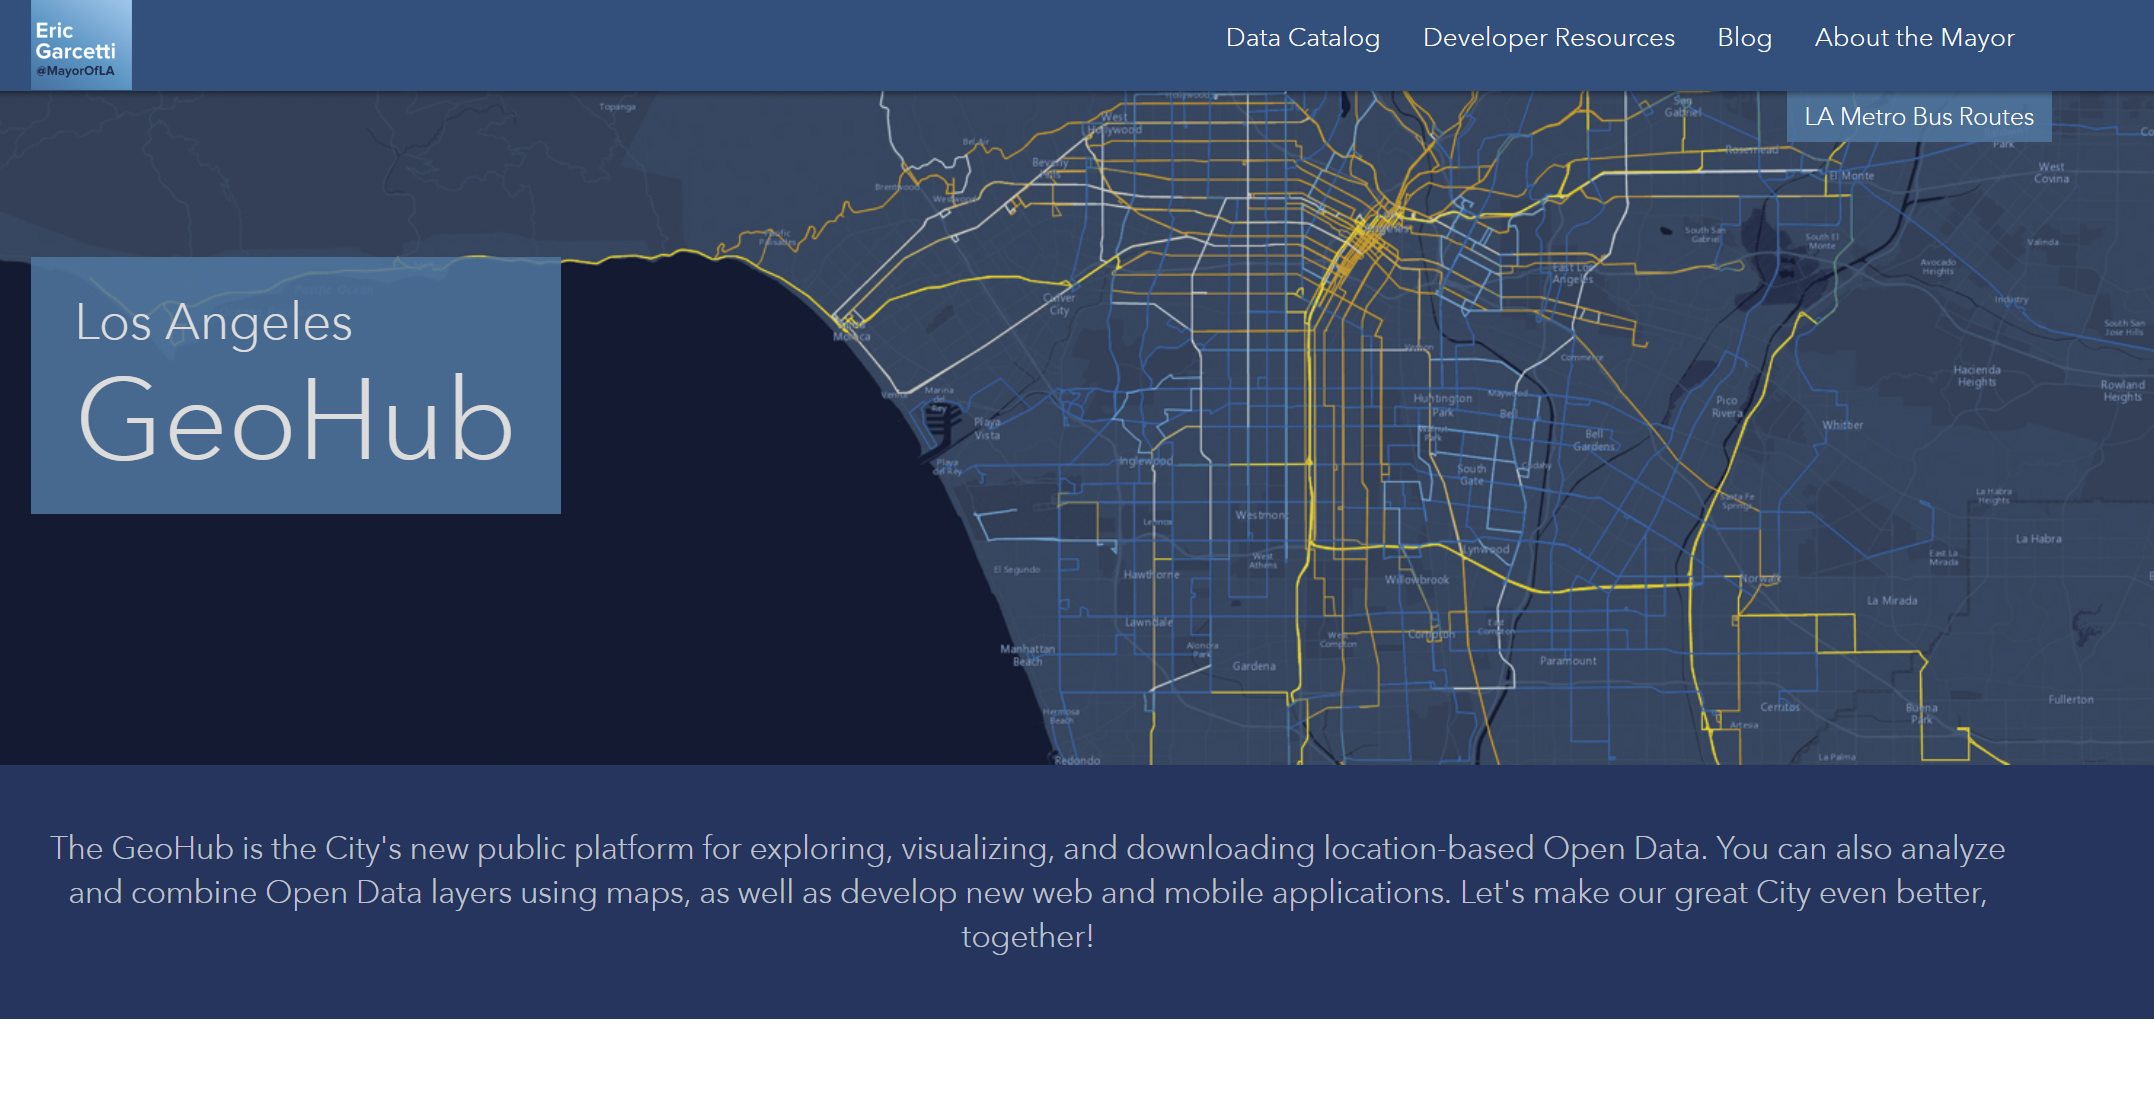
Resources
- For spatial data
- For spatial and other open data
What can we map?
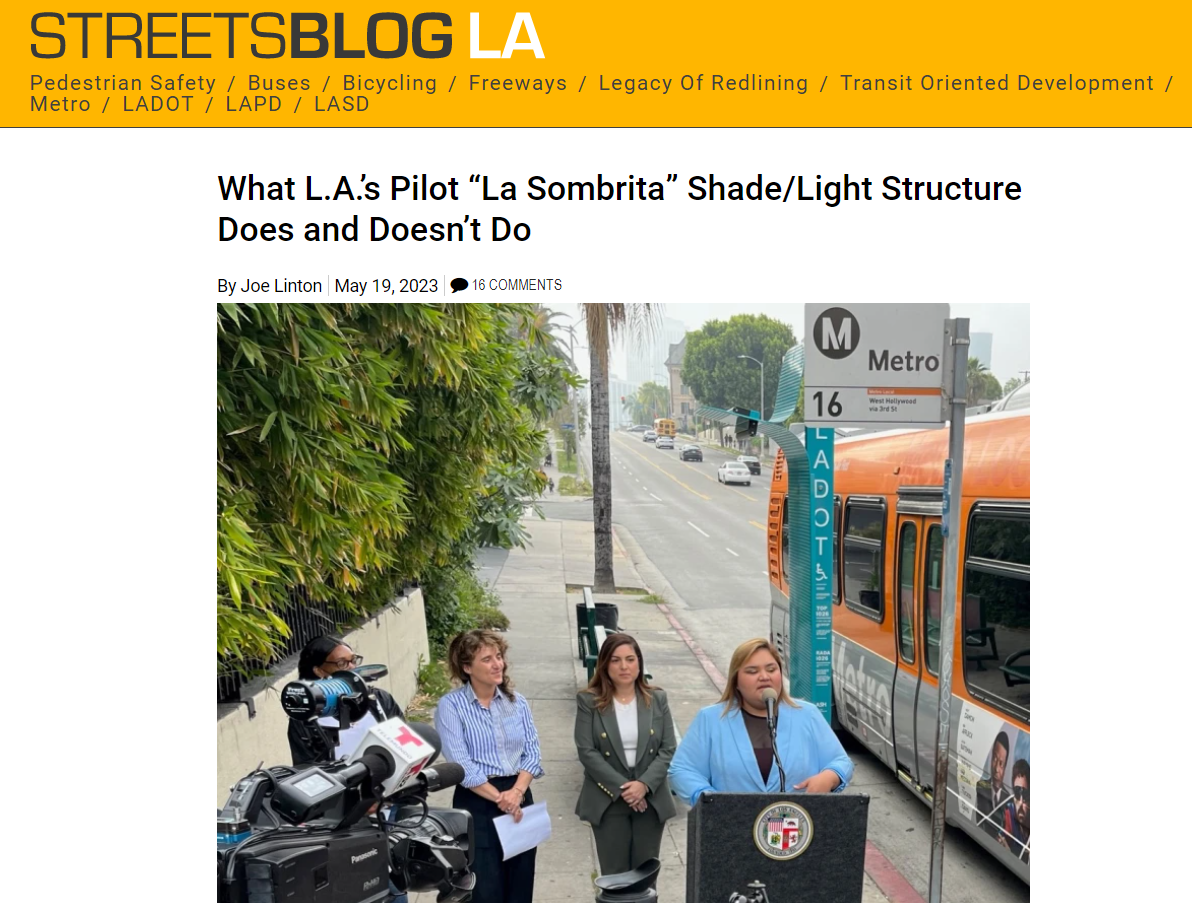
source: streetsblogla
StreetsLA - link
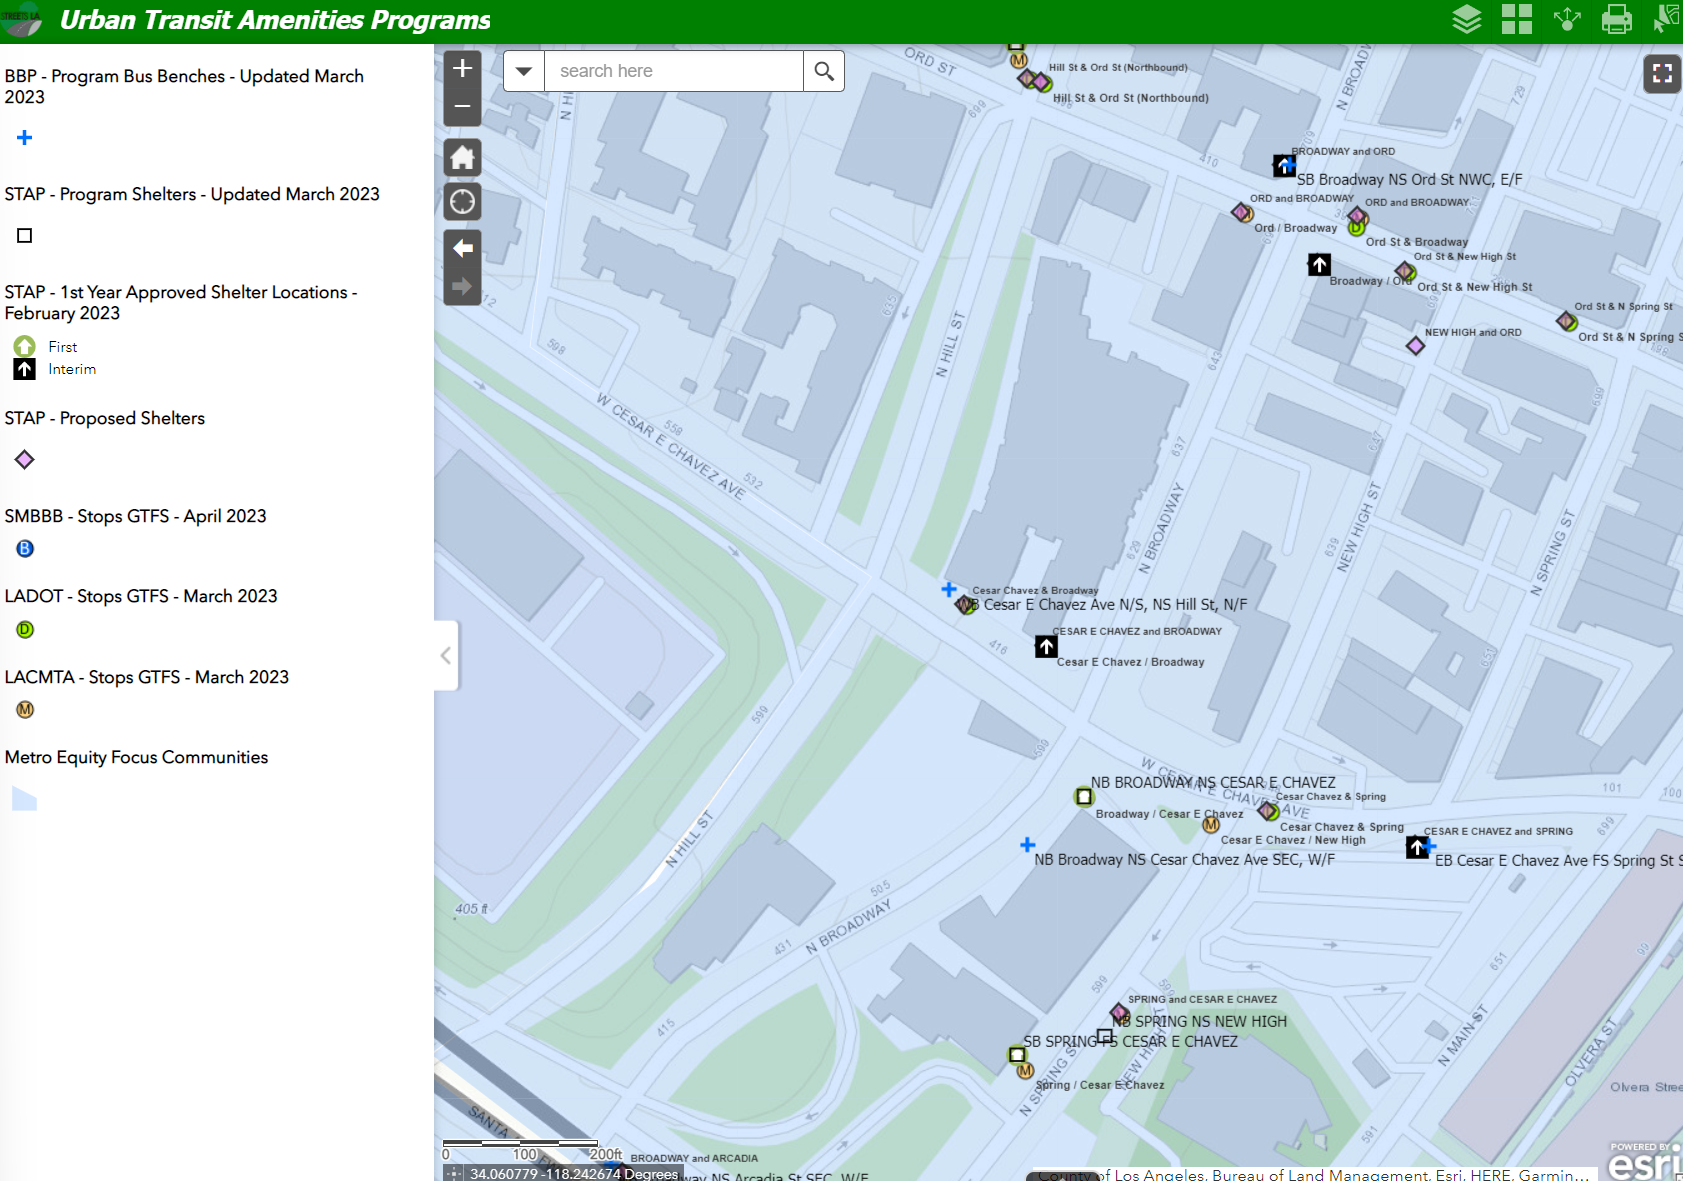
So let's make a map
showing bus stops and amenities in the City of LA
Open Data
Datasets we need
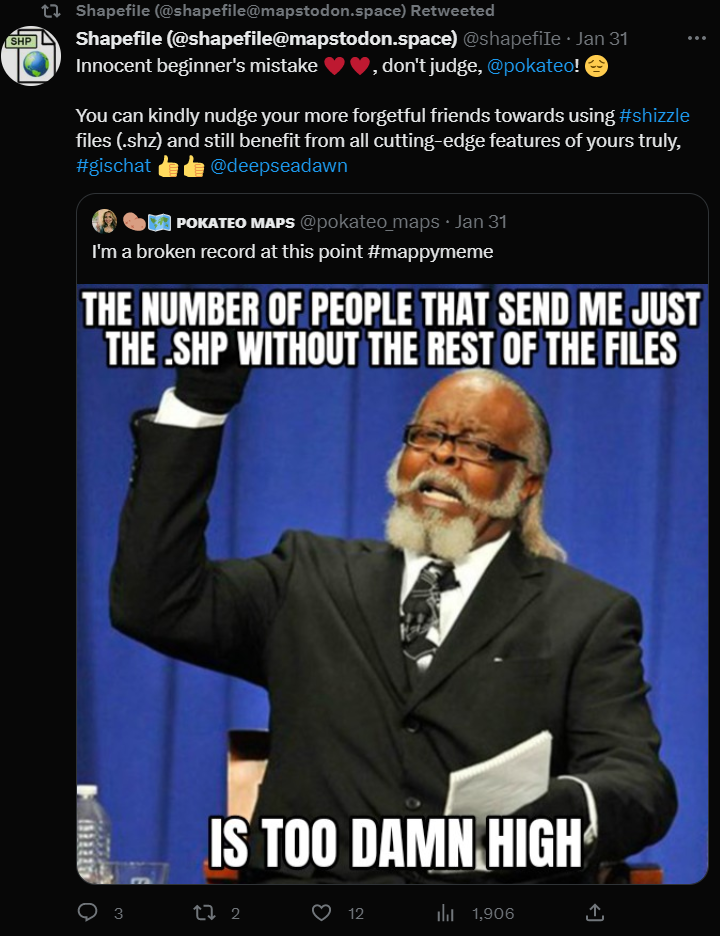
- Metro Bus Stops - Shapefile
- Metro Bus Lines (Combined) - Shapefile
- LACITY Bus Benches - Shapefile
- LACITY Bus Shelters - Geopackage
- LACITY Boundaries - Geojson
- LACITY Lights - Geojson
Save time - Get them all here!

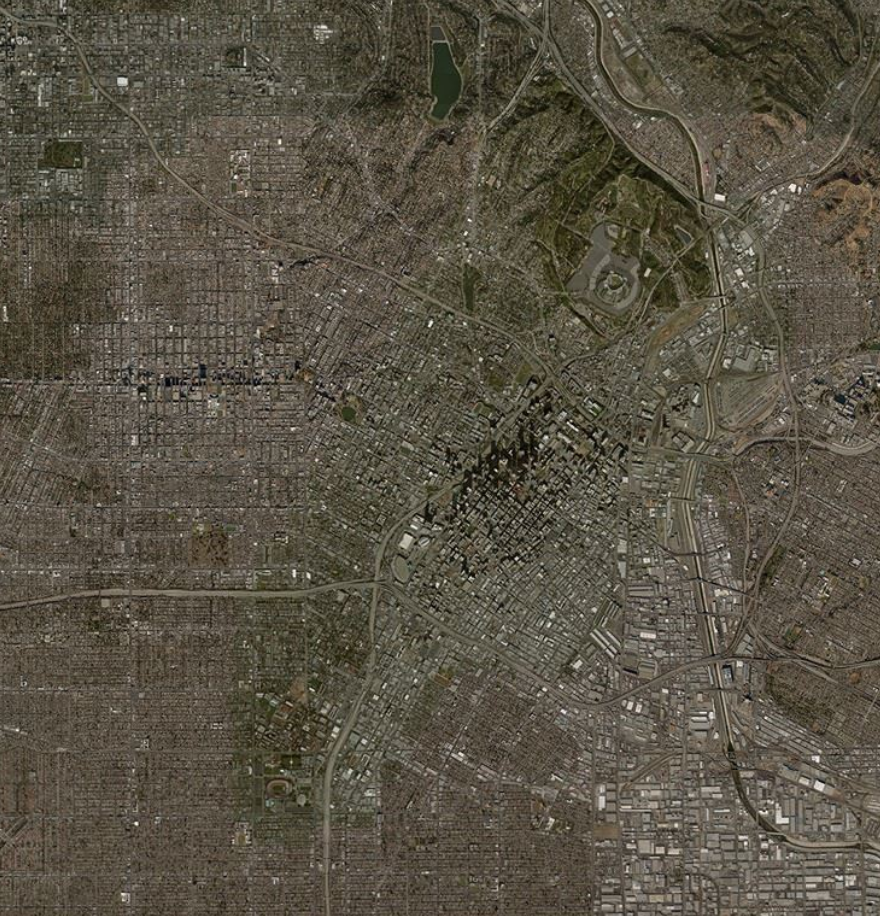
Source: Terramonitor
Shapefile
Geojson / CSV
Geopackage

QGIS 101 - 5/24/23
By Omar Ureta


