R語言(4)
dplyr
dplyr 是什麼?
dplyr 是 R 中一個用來操作資料框(data.frame 或 tibble)的套件,幫你輕鬆進行篩選、排序、選欄、分組、摘要等資料整理工作
優點:
- 以「動詞」命名的函數,讓你能直接將想達成的資料轉換翻譯成程式碼
- 提供資料轉換的「標準化框架」,有系統的思考需要的資料轉換
- 在效能上有優化,較其他套件的函數快
- filter()
- select()
- mutate()
- arrange()
- group_by()
- summarise()
library(dplyr)1. filter 函數 : 觀察row的值進行篩選
mtcars.tb <- as_tibble(mtcars)
print(mtcars.tb)
篩選出一加侖汽油的可以跑超過 20 km 且馬力超過 100 匹馬力
mtcars.tb %>%
  filter(mpg > 20, hp > 100)

mtcars.tb %>%
  filter(cyl == 4)
2. select 函數 : 以名稱篩選column
如果我們只需要看「一加侖汽油可跑距離」、「馬力」、與「前進檔數」三個變數
mtcars.tb %>%
  select(mpg, hp, gear)
mtcars.tb %>%
filter(
mpg > 20,
hp > 100) %>%
select(gear)篩選出一加侖汽油的可以跑超過 20 km 且馬力超過 100 匹馬力汽車的「前進檔數」
3. arrange 函數 : 安排資料列的排序
mtcars.tb %>%
  arrange(
    cyl,
    disp
  )

mtcars.tb %>%
  arrange(
    desc(disp)
  )
4. mutate 函數 : 以既有的變數運算建立新的變數
data.frame$new_var <- data.frame$old_var1 / data.frame$old_var2mtcars.tb %>%
mutate(
cyl2 = cyl * 2,
cyl4 = cyl2 * 2
)- transmute 函數 : 保留新建立的變數
mtcars.tb %>%
  mutate(
    mpg = NULL,
    disp = disp * 0.0163871 # convert to litres
  )
mtcars.tb %>%
transmute(displ_l = disp / 61.0237)5. group_by 函數 : 把資料分成小群體
mtcars.tb %>%
  group_by(cyl)

mtcars.tb %>%
  group_by(cyl) %>%
  do(browser())
什麼是browser()??? 一種R 的 debug 函數
do(browser())
對每一組 class 的資料,開啟瀏覽器(browser)來看內容
→ 每跑一次 group,就停下來讓你手動看!
| name | class | score |
|---|---|---|
| Amy | A | 90 |
| Ben | A | 85 |
| Cindy | B | 78 |
| David | B | 92 |
用 group_by(class) 就會變成兩組:
-
第一組(class A):Amy & Ben
-
第二組(class B):Cindy & David
🧰小工具
-
輸入
.→ 看這一組的資料 -
str(.)→ 看欄位與型別 -
c → 繼續跑程式(continue)
-
輸入
Q→ 結束瀏覽器(離開)
students <- tibble(
  name = c("Amy", "Ben", "Cindy", "David"),
  class = c("A", "A", "B", "B"),
  score = c(90, 85, 78, 92)
)
students %>%
  group_by(class) %>%
  do(browser())
6. summarize 函數 : 資料摘要總結
mtcars.tb %>%
  group_by(cyl) %>%
  summarise(
    number = n(),
    avg_hp = mean(hp),
    sd_hp = sd(hp),
    max_hp = max(hp),
    min_hp = min(hp)
  ) %>%
arrange(desc(avg_hp))| 函數 | 意義 |
| mean(x) | 平均值 |
| sum(x) | 總和 |
| n() | 筆數(行數 |
| max(x) | 最大 |
| min(x) | 最小 |
| sd(x) | 標準差 |
幫汽車雜誌做封面企劃:「請列出從高到低每種汽缸數中馬力最強前三名的代表車型做成封面故事」
rank() 是什麼?rank(x) 會回傳一個數字向量,表示每個元素在整體裡的名次(從小到大)
該怎麼辦?
1.「每種汽缸數」: grop_by()分組
2.「馬力最強前三名」: filter() 篩選 → 前三名?
rank()
x <- c(90, 85, 90, 70)
rank(x, ties.method = "first")
# 3 2 4 1
rank(desc(x)) # 大的排前面3.「從高到低每種汽缸數」: arrange() 排序
幫汽車雜誌做封面企劃:「請列出從高到低每種汽缸數中馬力最強前三名的代表車型做成封面故事」
mtcars.tb %>%
  group_by(cyl) %>%
  filter(rank(desc(hp)) < 4) %>%
  arrange(desc(cyl), desc(hp))
練習 : 分析各校學生的成績
任務一:整體成績分析
1. 請計算每所學校的學生人數( n() ) 與平均成績(mean())
2. 哪所學校的平均成績最高?請依照平均分數由高到低排序
在某個平凡的星期一早晨大家還在進行正常的早自習時...
教育部宣布要舉辦知識王大賽!!! 興沖沖的報名後,所謂「知己知彼!百戰百勝!」 小明決定要分析各校學生的成績,於是就召換了你這個數據奇才,要用手中的 dplyr 大法查出哪所學校、哪個性別、哪位學生的功力最深不可測!
任務二:每個性別中分數最高的學生是誰?
scores <- read.csv("reading_scores.csv")
scores %>%
  group_by(school) %>%
  summarise(
    count = n(),
    avg_score = mean(score_reading)
  ) %>%
  arrange(desc(avg_score))
scores %>%
  group_by(gender) %>%
  filter(rank(desc(score_reading)) == 1) %>%
  arrange(school)
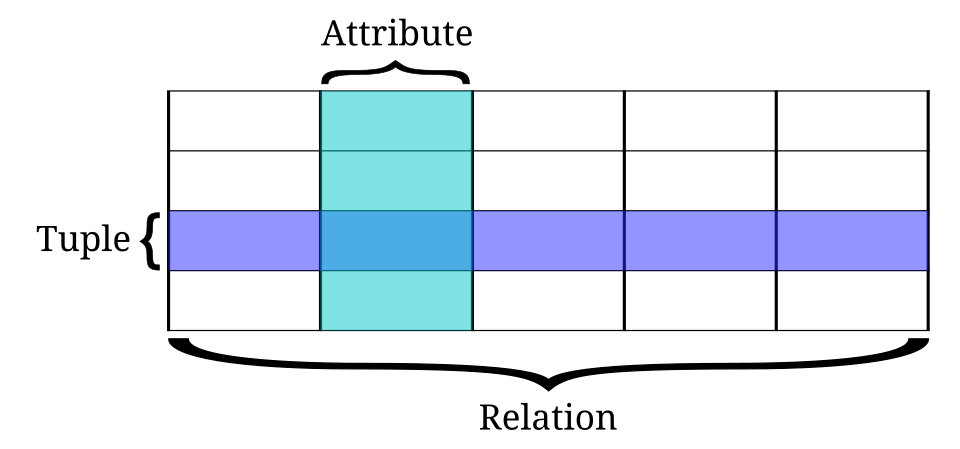
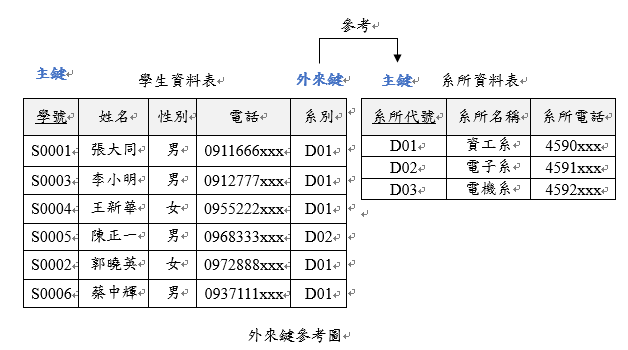
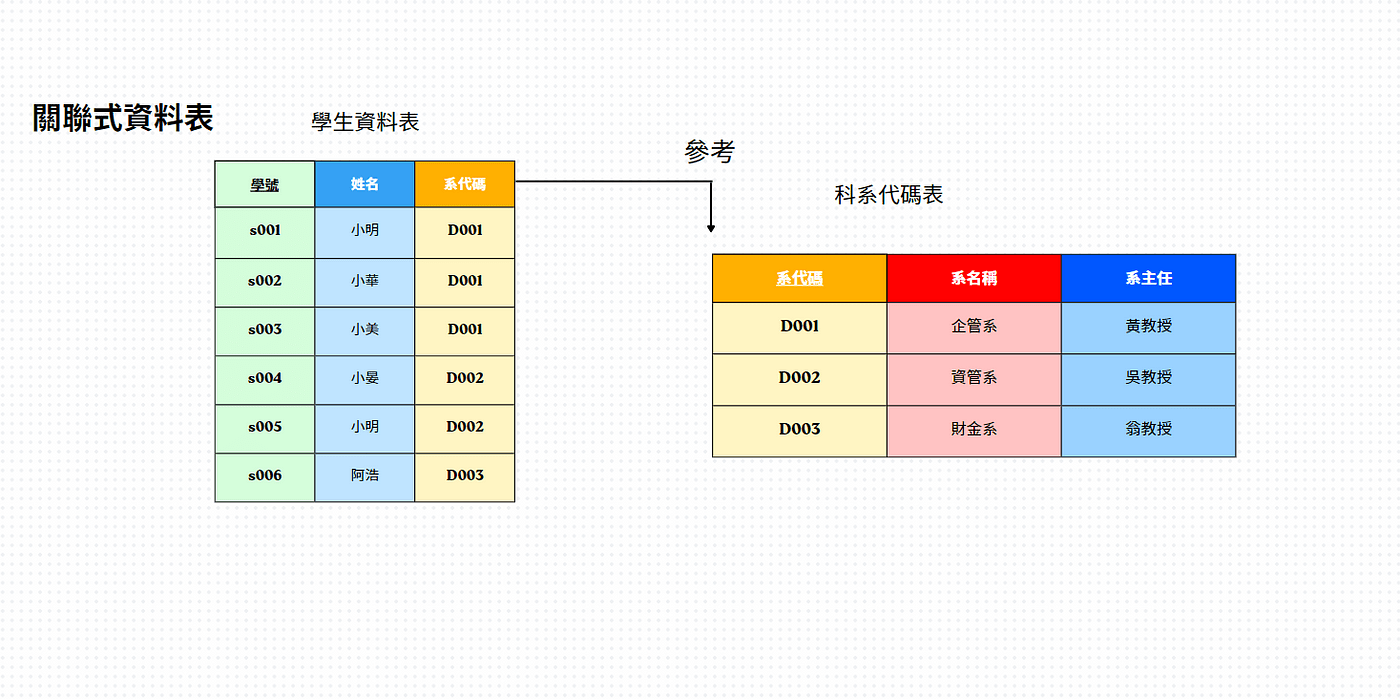
關聯資料庫
什麼是關聯式資料庫?
-
資料以表格 (table)為單位儲存
-
每一列 = 一筆資料,每一資料表必有主鍵 (primary key)
-
多張表格以 外鍵 (foreign key) 連繫
join 指令:
屬於 dplyr 套件裡的功能之一,可以說是 dplyr 處理「多表格資料整合」的主力工具,用以合併或過濾資料

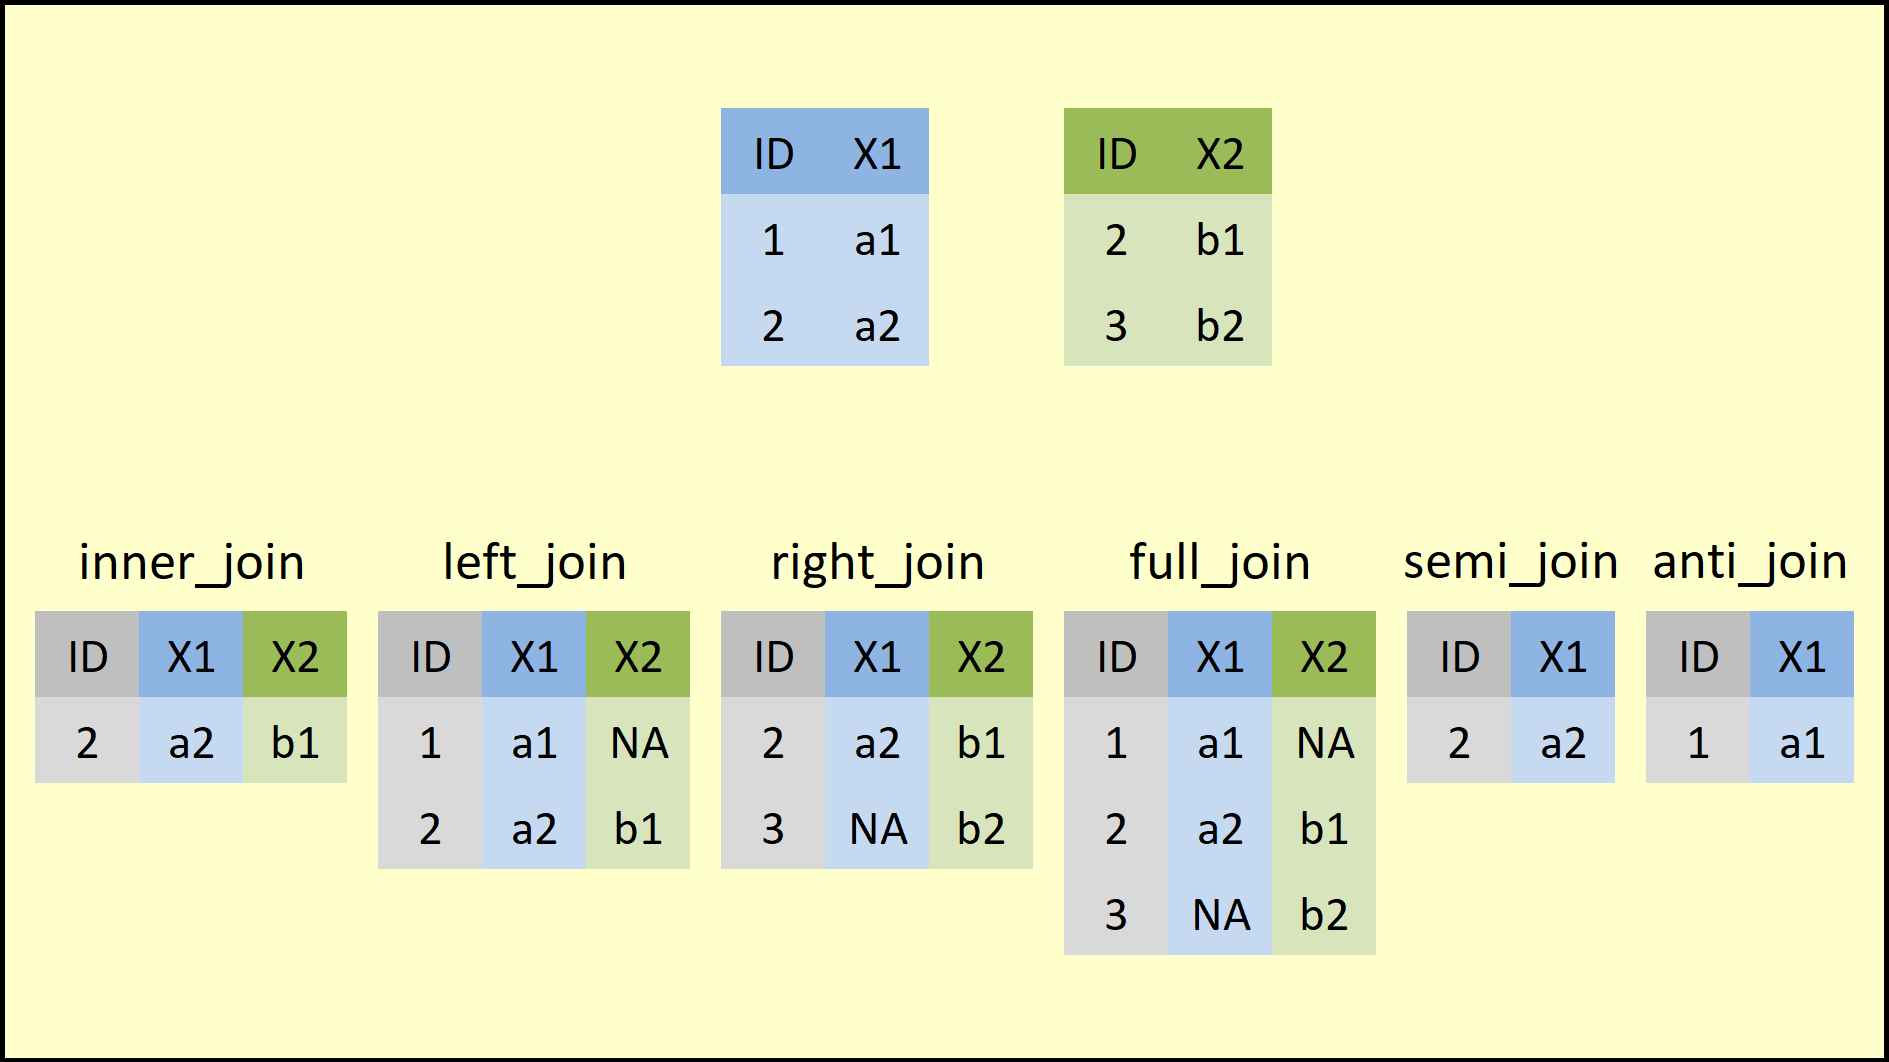
Inner Join 與 Full Join
table.A <- tribble(
  ~key, ~val,
  1, "a_1",
  2, "a_2",
  3, "a_3",
  4, "a_4"
)

table.B <- tribble(
  ~key, ~val,
  1, "b_1",
  2, "b_2",
  5, "b_5"
)

table.A %>% inner_join(table.B, by = "key")
table.A %>% full_join(table.B, by = "key")
by = "key" 是用來指定兩個資料表要依據哪個欄位進行對應合併,如果兩個表格對應的欄位名稱不同 :
inner_join(x, y, by = c("a" = "b"))Left Join 與 Right Join
table.A %>% left_join(table.B, by = "key")
table.A %>% right_join(table.B, by = "key")
Anti join 與 Semi join (過濾
table.A %>% anti_join(table.B, by = "key")
table.A %>% semi_join(table.B, by = "key")
#filter:較複雜
table.A %>%
filter(user_id %in% table.B$user_id)練習
user.table <- tibble(
  user_id = c("u01", "u02", "u03", "u04"),
  name = c("Amy", "Brian", "Lily", "Amy"),
  fandom = c("BTS", "BLACKPINK", "TWICE", "ITZY")
)

watch.table <- tibble(
  user_id = c("u01", "u02", "u04"),
  mv = c("Butter", "kill this love", "wanna be"),
  watch_count = c(5, 3, 3)
)
合併兩個資料,要包含全部資料
進階 : 尋找各粉絲的總看觀次數
提 : 先group_by再summarise
答案
user.table <- tibble(
  user_id = c("u01", "u02", "u03", "u04"),
  name = c("Amy", "Brian", "Lily", "Amy"),
  fandom = c("BTS", "BLACKPINK", "TWICE", "ITZY")
)

watch.table <- tibble(
  user_id = c("u01", "u02", "u04"),
  mv = c("Butter", "kill this love", "wanna be"),
  watch_count = c(5, 3, 3)
)

user.table %>%
  full_join(watch.table, by = "user_id")

user.table %>%
  full_join(watch.table, by = "user_id") %>%
  group_by(name) %>%
  summarise(total_watch = sum(watch_count, na.rm = TRUE))
多重鍵值的資料表進行合併
- 只有一張資料表有重複鍵值:通常出現在table.A 的連外鍵與 table.B 的主鍵作為合併依據
- 兩張資料表有重複鍵值:針對連外鍵合併
table.A %>% left_join(table.B, by = c("foreign_key" = "key"))集合運算
並不常用,前面的 semi_join 與 anti_join 是比對 table.A 與 table.B 的鍵值,而此處介紹的功能則是比對 table.A 的整個 row 是否有出現 table.B 之中。
- intersect(x, y):回傳同時出現在 x 與 y 的觀察個體
- union(x, y):回傳出現在 x 或 y 的觀察個體且個體/row 不會重複
- setdiff(x, y): 回傳出現在 x 但沒有出現在 y 的觀察個體
table.A <- tribble(
  ~var_1, ~var_2,
  "1A", "1B",
  "2A", "2B",
)

table.B <- tribble(
  ~var_1, ~var_2,
  "1A", "1B",
  "2A", "2B",
  "3A", "3B"
)

table.A %>% intersect(table.B)
table.A %>% union(table.B)
table.A %>% setdiff(table.B)
table.B %>% setdiff(table.A)- intersect(x, y):回傳同時出現在 x 與 y 的觀察個體
- union(x, y):回傳出現在 x 或 y 的觀察個體且個體/row 不會重複
- setdiff(x, y): 回傳出現在 x 但沒有出現在 y 的觀察個體
補
library(nycflights13) #該套件提供一組飛航資料範例,共包含數個互相關聯的資料表:
flights
#每筆航班資訊(主表,包含出發時間、航班號、出發與抵達機場等)
airlines
#航空公司對照表(carrier 為 key)
airports
#美國機場資訊(以 faa 為 key,可與 origin、dest 對應)
planes
#飛機資料表,包含製造年份、機型等 (以 tailnum 為 key)
weather
#每日每小時的天氣紀錄 (以 origin、year、month、day、hour 組合作為key,對應 flights)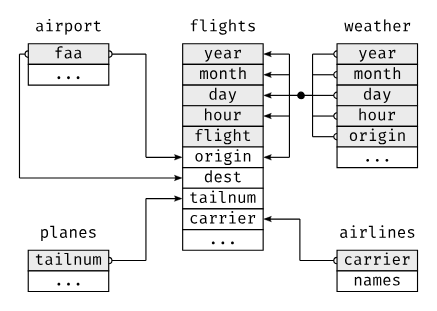
R語言(4)
By phoebe tsai


