R語言(3)
資料輸入與輸出
(Data Import and Export)
library(readr)
#分隔符號為 , 的檔案

read_csv("檔名")
read_csv2("檔名") #隔符號為 ; 的檔案(有些國家的小數點以 , 表示,就會出現這類檔案
read_tsv("檔名") #分隔符號為 tab 的檔案
read_delim("檔名", delim = "|") #可以自行選擇分隔符號線上版
資料輸入與輸出的函數都存在於套件 readr 中
write_csv()、write_csv2()、write_tsv()、write_delim()
write_csv(tibble 物件, 檔案連結)
2. 輸出 csv 類型的資料
tb <- read_csv("檔名")
add_row(tb, a=7, b=8, c=9)
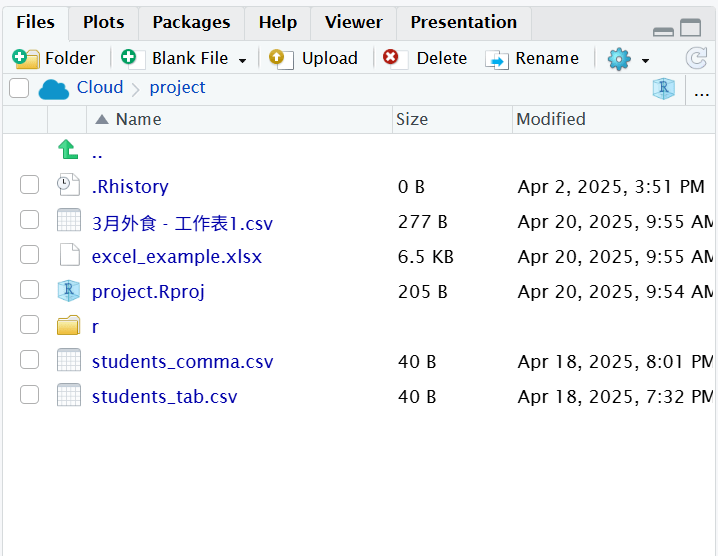
write.csv(tb, "檔名")3. 輸入 EXCEL 檔案
tidyverse 架構下要讀取 EXCEL 檔案,會使用 readxl 套件
# install.packages("readxl")
library(readxl)
excel_sheets(檔名) #讀取工作表名稱
read_excel(檔名) #得到第一個sheet
read_excel(檔名, sheet = "Inventory") #得到Inventory這個sheet
read_excel(檔名, sheet = 3) #得到第三個sheet
read_excel(檔名, n_max = 2) #得到第一個sheet的前兩列
read_excel(檔名, range = "A1:B2") #得到第一個sheet的A1到B2的資料
read_excel(檔名, range = cell_rows(1:3)) #讀取從第幾個row到第幾個row去
read_excel(檔名, range = cell_cols("A:C")) #讀取從第幾個col到第幾個col去
read_excel(檔名, range = "Inventory!B1:C3")
read_excel(檔名, na = "值")tidyr
什麼是tidyr??
tidyr 是 R 語言中一個非常重要的資料整理套件,屬於 tidyverse 家族,主要用來整理資料的形狀,也就是幫助你把資料轉換成「tidy data」的格式
gather
spread
unite
separate
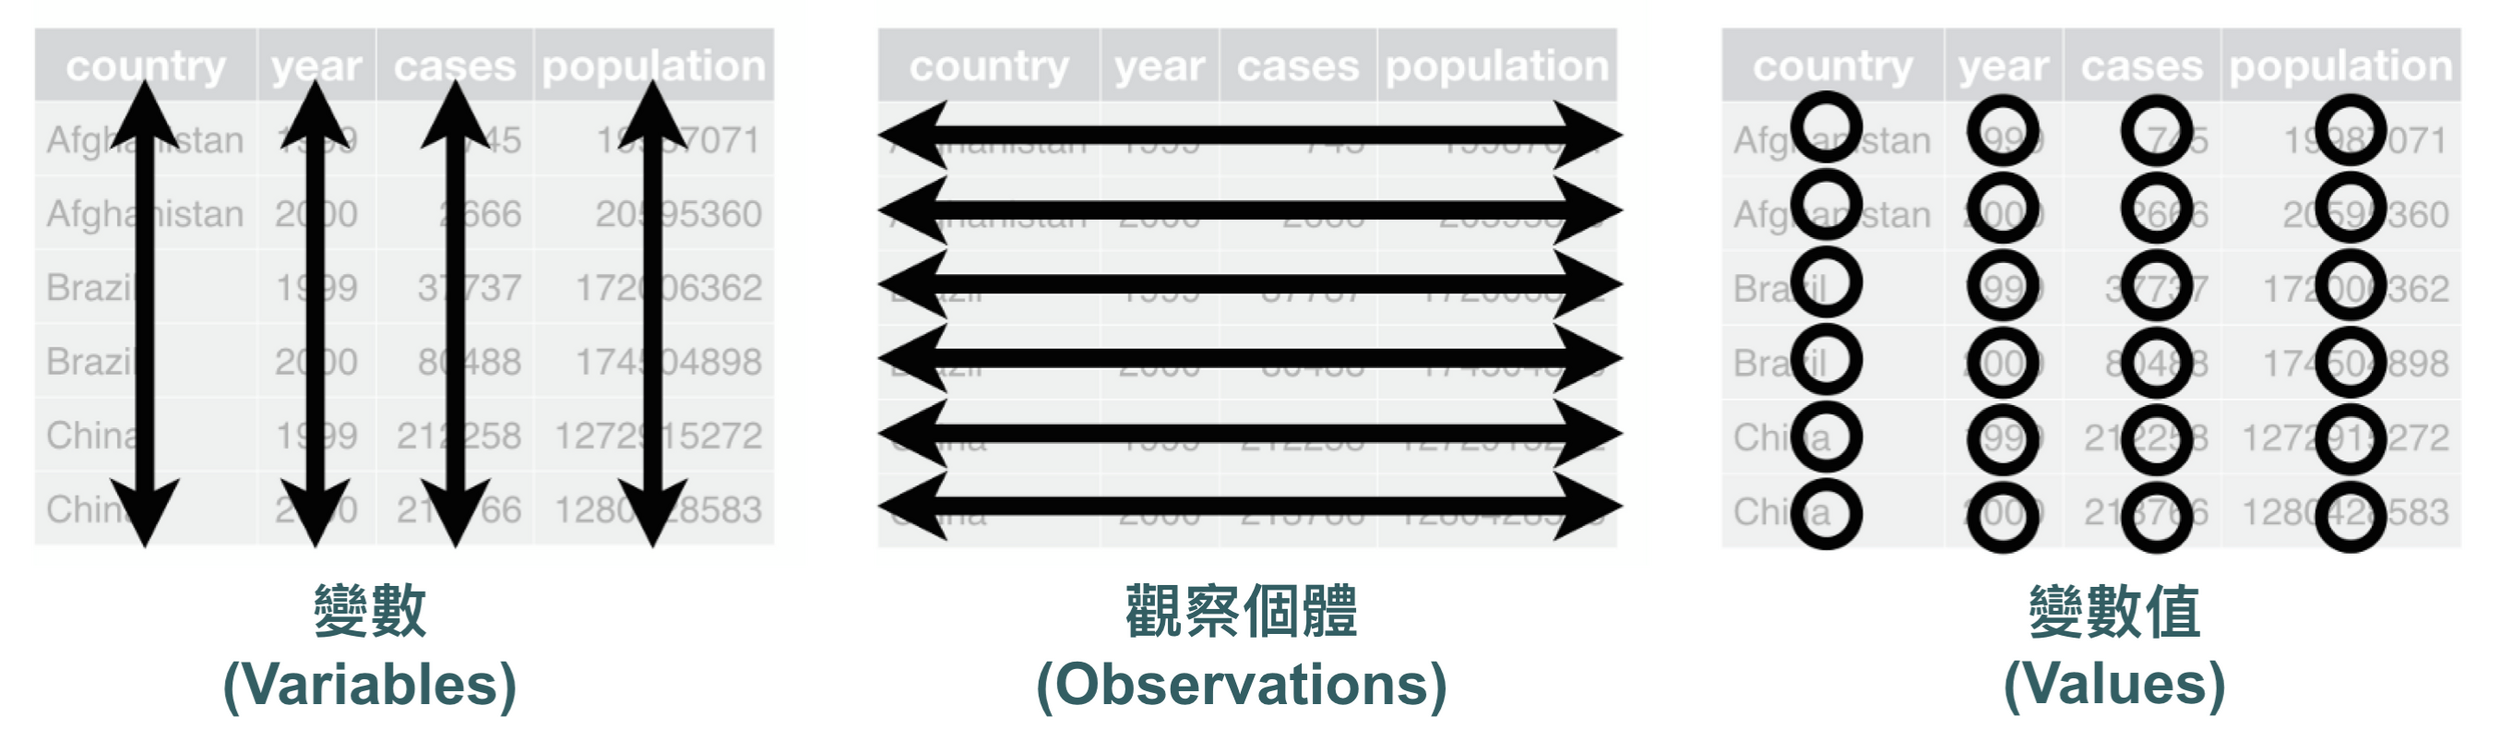
一個 Tidy Dataset 會滿足以下三個條件:
- 每個變數 (variale) 都有自己的一個 column
- 每個觀察個體 (observation) 都有自己的一個 row
- 每個值(value)都有自己的資料格
每一種類型的觀察個體會形成一個 table,可形成所謂的正規化原則 (normal principle)。
library(tidyr)
table1
table2
table3
table4a
table4b
Gather : 資料欄其實是值而不是變數
gather(data,
       key = "key",
       value = "value",
       ...,
       na.rm = FALSE)

table4a %>%
  gather(key = "year",
         value = "cases",
         colnames(table4a)[2:ncol(table4a)])

gather("1999", "2000", key = "year", value = "cases
%>% pipe運算子 : 把前面的結果「傳到」後面函數的語法
- data:待處理的資料
- key:新變數的欄位名稱
- value:新變數變數值的儲存欄位名稱
- …:要被蒐集起來變成新變數的 columns
spread : 把變數當成值
spread(data,
       key,
       value,
       fill = NA,
       sep = NULL)

table2 %>%
  spread(key = type,
         value = count,
         sep = '_')

spread(table2, key = type, value = count)- key:要被拆開成變數的column
- sep:如果是 NULL,直接將 key 的值當成新 columns 的名稱,如果輸入其他分隔符號,回傳 “paste0(key_name,sep,key_value)”
練習 :
scores_wide <- tibble(
  name = c("Amy", "Ben", "Cindy"),
  math = c(90, 85, 78),
  english = c(88, 92, 80)
)
1. 用gather整理一下
2. 加一行資料 (用add_row
name = "Tom", subject = "math", score = 753. 用spread轉回寬格式
scores_wide <- tibble(
  name = c("Amy", "Ben", "Cindy"),
  math = c(90, 85, 78),
  english = c(88, 92, 80)
)

scores_long <- gather(scores_wide, key = "subject", value = "score", math, english)
scores_long

new_data <- add_row(scores_long, name = "Tom", subject = "math", score = 75)
scores_wide <- new_data %>%
  spread(
    key = subject,
    value = score,
  )
scores_wide
separate : 多個變數儲存在同一個 column 中
separate(data,
         col,
         into,
         sep = "-",
         remove = TRUE,
         convert = FALSE,
         extra = "warn",
fill = "warn")- col:需要被分開column的名稱
- into:分隔成新columns的名稱
- sep:用來分隔欄位的分隔符號
- remove : 是否要移除原本那一欄?TRUE->拆完就把原欄刪掉
- convert : 是否將拆出來的欄位自動轉型(例如轉成整數)
- extra : 如果字串中有比你指定的欄位還多的值,預設是warn
- fill : 如果字串中有比你指定的欄位還少的值,預設也是warn
separate(data,
         col,
         into,
         sep = "-",
         remove = TRUE,
         convert = FALSE,
         extra = "warn",
         fill = "warn")

table3 %>%
  separate(
    col = rate,
    into = c("cases", "population"),
    sep = "/",
    convert = TRUE)

table3 %>%
	separate(rate, into = c("cases", "population"))

table3 %>%
	separate(year, into = c("century", "year"), sep = 2)
unite(data,
col,
...,
sep = "_",
remove = TRUE)
tb <- read.csv("unite_practice.csv")
tb %>%
unite(col = "fullname",
c("first_name", "last_name"),
sep = " ")unite : 一個變數被分存在不同 columns 中
- col:合併完成後的新 column 名稱
- …:用來合併的原有 columns 名稱
- sep:用來分隔欄位的分隔符號
練習二 :
整理practice的檔案
提示 :
這個資料集合有兩個問題:
- 把值存在 column:m_0-4 代表的是男性 0 - 4 歲的個體數 -> gather
- 兩個變數存在同一個值:m_0-4 存了兩個變數 -> separate
tb <- read_csv("practice.csv")

tb.new <- tb %>%
  gather(
    colnames(tb)[4:ncol(tb)],
    key = "type",
    value = "cases")
tb.new

tb.new %>%
  separate(
    col = type,
    into = c("gender", "age"),
    sep = "_",
    convert = TRUE)
dplyr
dplyr 是什麼?
dplyr 是 R 中一個用來操作資料框(data.frame 或 tibble)的套件,幫你輕鬆進行篩選、排序、選欄、分組、摘要等資料整理工作
優點:
- 以「動詞」命名的函數,讓你能直接將想達成的資料轉換翻譯成程式碼
- 提供資料轉換的「標準化框架」,有系統的思考需要的資料轉換
- 在效能上有優化,較其他套件的函數快
- filter()
- select()
- mutate()
- arrange()
- group_by()
- summarise()
library(dplyr)1. filter 函數 : 觀察row的值進行篩選
mtcars.tb <- as_tibble(mtcars)
print(mtcars.tb)
篩選出一加侖汽油的可以跑超過 20 km 且馬力超過 100 匹馬力
mtcars.tb %>%
  filter(mpg > 20, hp > 100)

mtcars.tb %>%
  filter(cyl == 4)
2. select 函數 : 以名稱篩選column
如果我們只需要看「一加侖汽油可跑距離」、「馬力」、與「前進檔數」三個變數
mtcars.tb %>%
  select(mpg, hp, gear)
mtcars.tb %>%
filter(
mpg > 20,
hp > 100) %>%
select(gear)篩選出一加侖汽油的可以跑超過 20 km 且馬力超過 100 匹馬力汽車的「前進檔數」
3. arrange 函數 : 安排資料列的排序
mtcars.tb %>%
  arrange(
    cyl,
    disp
  )

mtcars.tb %>%
  arrange(
    desc(disp)
  )
4. mutate 函數 : 以既有的變數運算建立新的變數
data.frame$new_var <- data.frame$old_var1 / data.frame$old_var2mtcars.tb %>%
mutate(
cyl2 = cyl * 2,
cyl4 = cyl2 * 2
)- transmute 函數 : 保留新建立的變數
mtcars.tb %>%
  mutate(
    mpg = NULL,
    disp = disp * 0.0163871 # convert to litres
  )
mtcars.tb %>%
transmute(displ_l = disp / 61.0237)5. group_by 函數 : 把資料分成小群體
mtcars.tb %>%
  group_by(cyl)

mtcars.tb %>%
  group_by(cyl) %>%
  do(browser())
什麼是browser()??? 一種R 的 debug 函數
do(browser())
對每一組 class 的資料,開啟瀏覽器(browser)來看內容
→ 每跑一次 group,就停下來讓你手動看!
| name | class | score |
|---|---|---|
| Amy | A | 90 |
| Ben | A | 85 |
| Cindy | B | 78 |
| David | B | 92 |
用 group_by(class) 就會變成兩組:
-
第一組(class A):Amy & Ben
-
第二組(class B):Cindy & David
🧰小工具
-
輸入
.→ 看這一組的資料 -
str(.)→ 看欄位與型別 -
c → 繼續跑程式(continue)
-
輸入
Q→ 結束瀏覽器(離開)
students <- tibble(
  name = c("Amy", "Ben", "Cindy", "David"),
  class = c("A", "A", "B", "B"),
  score = c(90, 85, 78, 92)
)
students %>%
  group_by(class) %>%
  do(browser())
6. summarize 函數 : 資料摘要總結
mtcars.tb %>%
  group_by(cyl) %>%
  summarise(
    number = n(),
    avg_hp = mean(hp),
    sd_hp = sd(hp),
    max_hp = max(hp),
    min_hp = min(hp)
  ) %>%
arrange(desc(avg_hp))| 函數 | 意義 |
| mean(x) | 平均值 |
| sum(x) | 總和 |
| n() | 筆數(行數 |
| max(x) | 最大 |
| min(x) | 最小 |
| sd(x) | 標準差 |
幫汽車雜誌做封面企劃:「請列出從高到低每種汽缸數中馬力最強前三名的代表車型做成封面故事」
rank() 是什麼?rank(x) 會回傳一個數字向量,表示每個元素在整體裡的名次(從小到大)
該怎麼辦?
1.「每種汽缸數」: grop_by()分組
2.「馬力最強前三名」: filter() 篩選 → 前三名?
rank()
x <- c(90, 85, 90, 70)
rank(x, ties.method = "first")
# 3 2 4 1
rank(desc(x)) # 大的排前面3.「從高到低每種汽缸數」: arrange() 排序
幫汽車雜誌做封面企劃:「請列出從高到低每種汽缸數中馬力最強前三名的代表車型做成封面故事」
mtcars.tb %>%
  group_by(cyl) %>%
  filter(rank(desc(hp)) < 4) %>%
  arrange(desc(cyl), desc(hp))
練習 : 分析各校學生的成績
任務一:整體成績分析
1. 請計算每所學校的學生人數( n() ) 與平均成績(mean())
2. 哪所學校的平均成績最高?請依照平均分數由高到低排序
在某個平凡的星期一早晨大家還在進行正常的早自習時...
教育部宣布要舉辦知識王大賽!!! 興沖沖的報名後,所謂「知己知彼!百戰百勝!」 小明決定要分析各校學生的成績,於是就召換了你這個數據奇才,要用手中的 dplyr 大法查出哪所學校、哪個性別、哪位學生的功力最深不可測!
任務二:每個性別中分數最高的學生是誰?
scores <- read.csv("reading_scores.csv")
scores %>%
  group_by(school) %>%
  summarise(
    count = n(),
    avg_score = mean(score_reading)
  ) %>%
  arrange(desc(avg_score))
scores %>%
  group_by(gender) %>%
  filter(rank(desc(score_reading)) == 1) %>%
  arrange(school)
R語言(3)
By phoebe tsai


