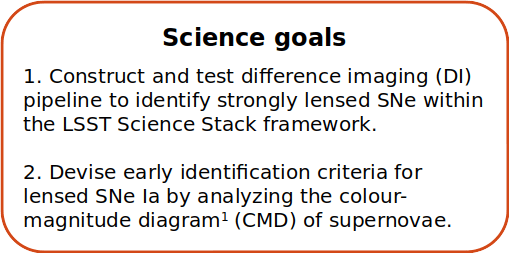
Strategies to identify strongly lensed type Ia supernovae in Rubin LSST
PRJ 502 MS Thesis Presentation
April 15, 2024
Prajakta Mane
MS19054
Supervisors:
Prof. Surhud More, Dr. Anupreeta More
IUCAA, Pune
Local Supervisor:
Prof. Jasjeet Singh Bagla
Why strongly lensed: Time delay cosmography
\frac{D_d D_s}{D_{ds}} = \frac{1}{H_0} f(z_s, z_l, \Omega_m, \Omega_\Lambda
)
\Delta t = \frac{D_d D_s}{cD_{ds}}(1+z_l)\Delta\tau \text{+ constant}
accurate time delays, surface mass distribution and redshift of lens
Hubble constant with strong lensing time delays
well-constrained Hubble Constant

Hubble constant constraints from 6 lensed quasars, Wong et al., 2019
Time delay cosmography:
\frac{D_d D_s}{D_{ds}} = \frac{1}{H_0} f(z_s, z_l, \Omega_m, \Omega_\Lambda
)
accurate time delays, surface mass distribution and redshift of lens
Hubble constant with strong lensing time delays
well-constrained Hubble Constant
Why SNe Ia
-
well-studied light curves -> more accurate time delay measurements
-
transient source -> improved constraints on the lens galaxy model
-
standard candle nature -> help overcome degeneracies
Current lensed supernova sample

H_0 = 75.4^{+8.1}_{−5.5}
H_0 = 66.6^{+4.1}_{-3.3}
PRJ 501: Recap
Quimby et al., 2014
PRJ 502


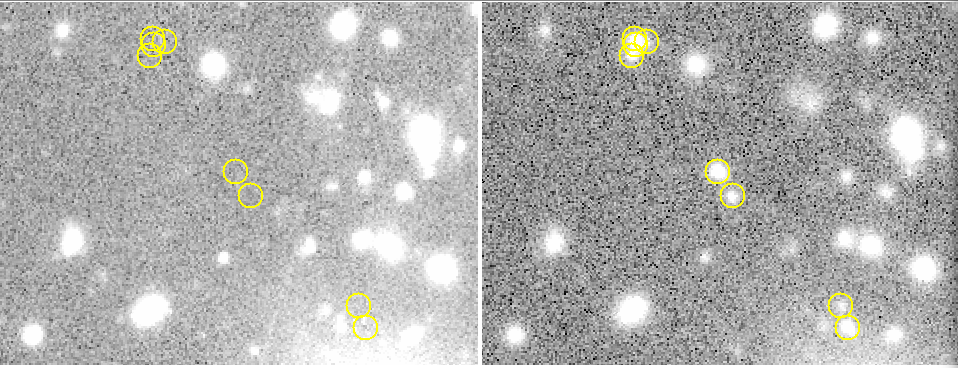
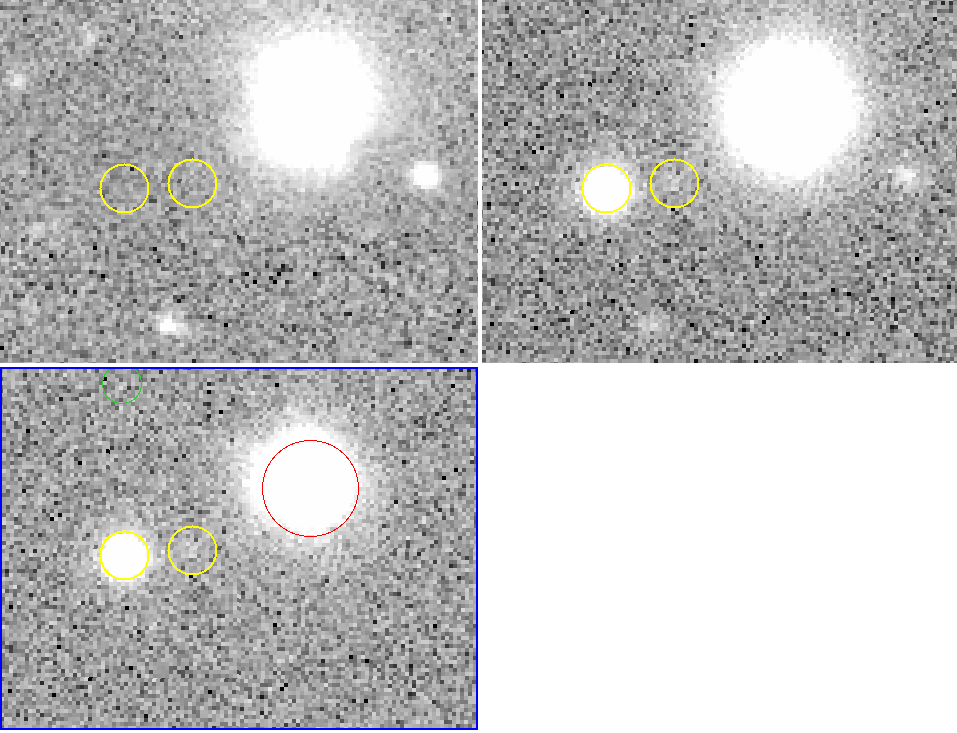
DIA Results
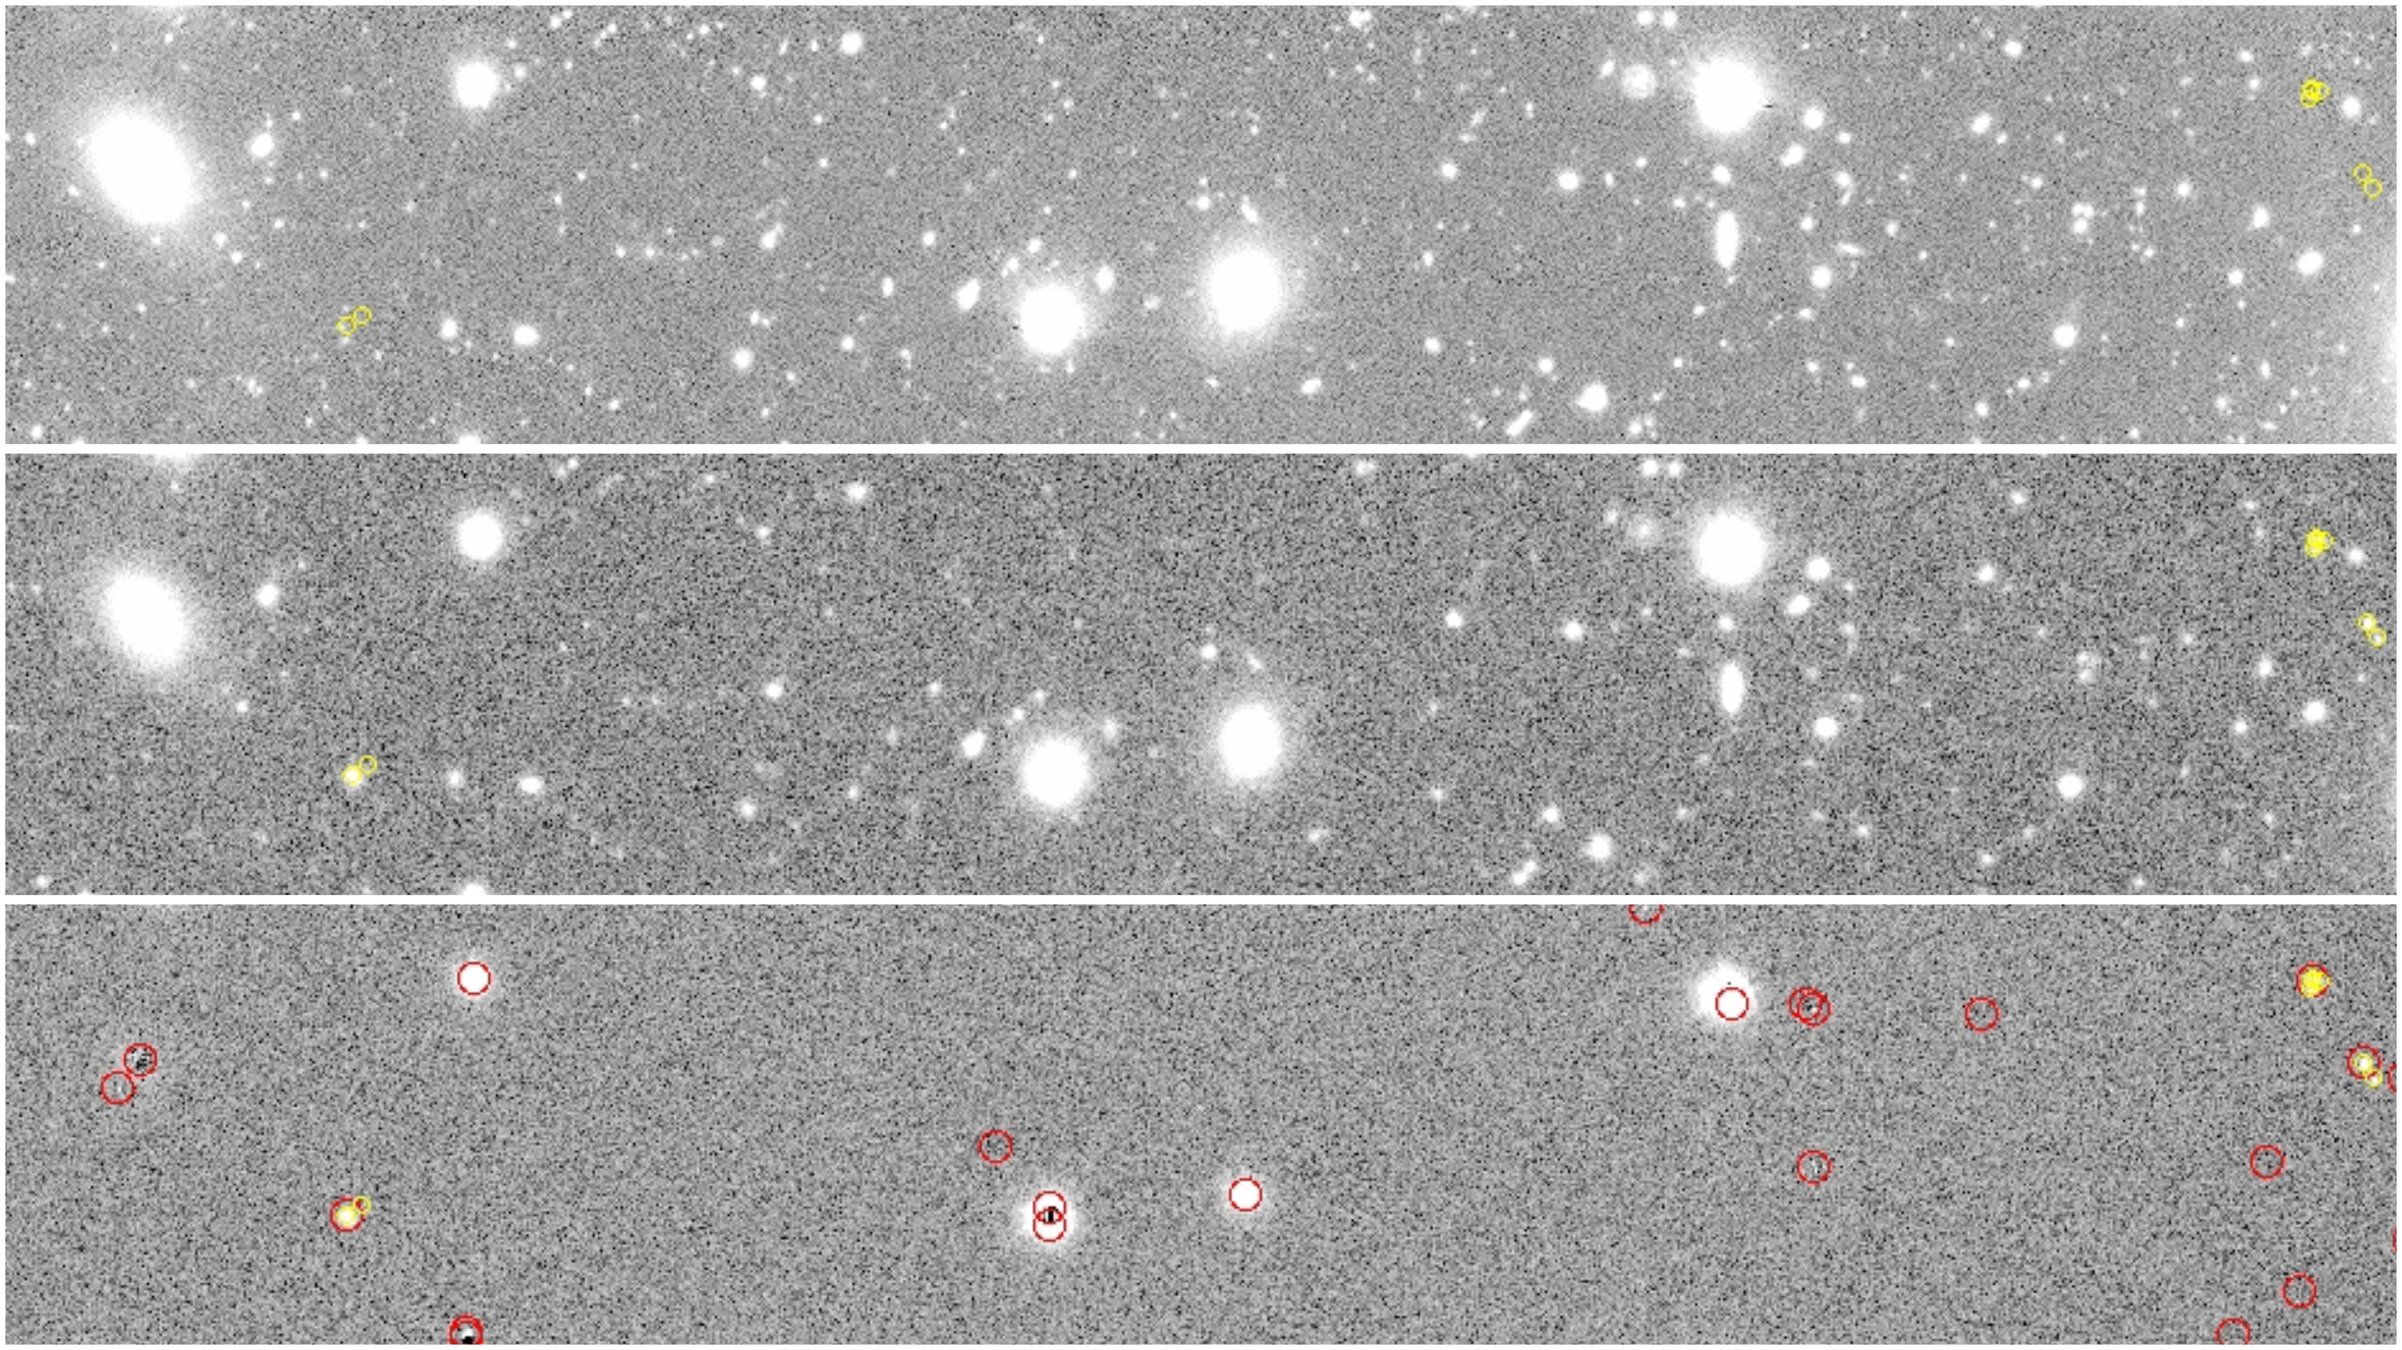
Template Image
Science Image
Difference Image
Template Image
Science Image
Yellow circles of radius 1": injected lensed SNe
DIA Results
Template Image
Science Image
Difference Image
Yellow circles of radius 1": injected lensed SNe
Red circles of radius 2": diaSources
\text{unresolved quads}
\text{resolved doubles}

\text{unresolved}\\\text{doubles}
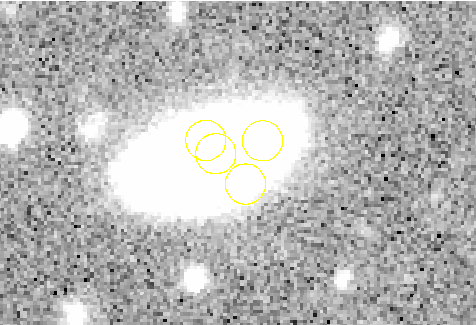
DIA Results
Template Image
Science Image
Difference Image
Yellow circles of radius 1": injected lensed SNe
Red circles of radius 2": diaSources
DIA Results
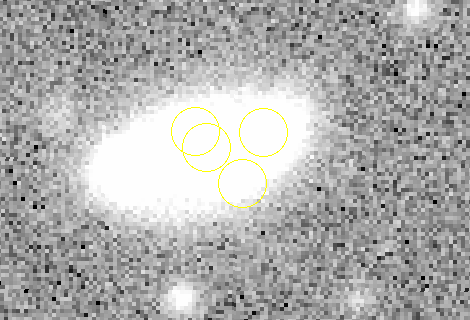
Quad system
Template Image
Science Image
Difference Image
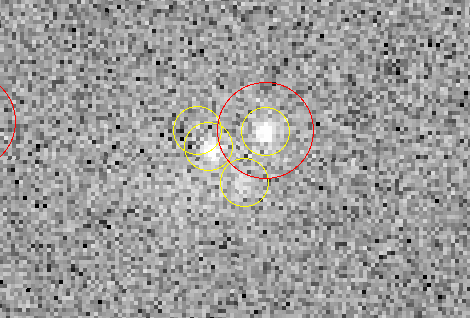
Yellow circles of radius 1": injected lensed SNe
Red circles of radius 2": diaSources
DIA Results


double system
- Total recovery fraction ~70%
- Slightly higher for quads
- Decreases significantly for the y-band
| Injected | Detected | % recovery | |
|---|---|---|---|
| Total | 74k | 51.5k | 70 |
| Doubles | 70k | 48.3k | 70 |
| Quads | 4.1k | 3.2k | 78 |
| g | 310 | 260 | 83 |
| r | 5.4k | 4.7k | 86 |
| i | 14k | 11k | 80 |
| z | 21k | 16k | 76 |
| y | 34k | 20k | 58 |
Lens system level analysis:
Is there a diaSource within the radius of 3" from each lens center in each epoch?
Analysis of DIA results
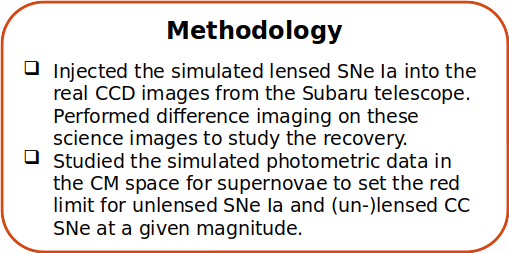
Difference imaging analysis
Recovery fraction variation with injected unresolved magnitude for each band
- Recovery fraction decreases for fainter systems -> cutoff brightness.
- Cutoff brightness varies across bands.

Lens system level analysis
| band | g | r | i | z | y |
| single-epoch depth | 26.4 | 26.3 | 26.0 | 25.6 | 24.6 |
Yasuda et al., 2019
Difference imaging analysis
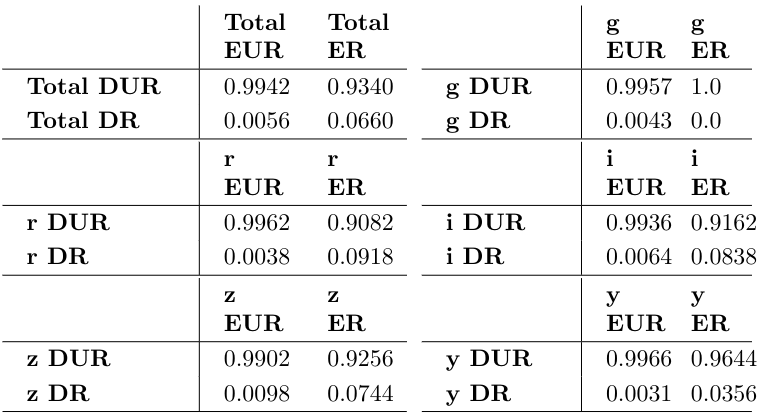
| Total EUR | Total ER | |
|---|---|---|
| Total DUR | 99.42 | 93.40 |
| Total DR | 0.56 | 6.60 |
Individual image level analysis:
How many unique diaSources were found corresponding to each lens system?
A single diaSource for entire system: Pipeline could not resolve the system (DUR): ~49k
Two or more diaSources for a system: Pipeline could resolve the system (DR): 1285
| band | median seeing(") |
|---|---|
| g | 0.74 |
| r | 0.62 |
| i | 0.64 |
| z | 0.59 |
| y | 0.74 |
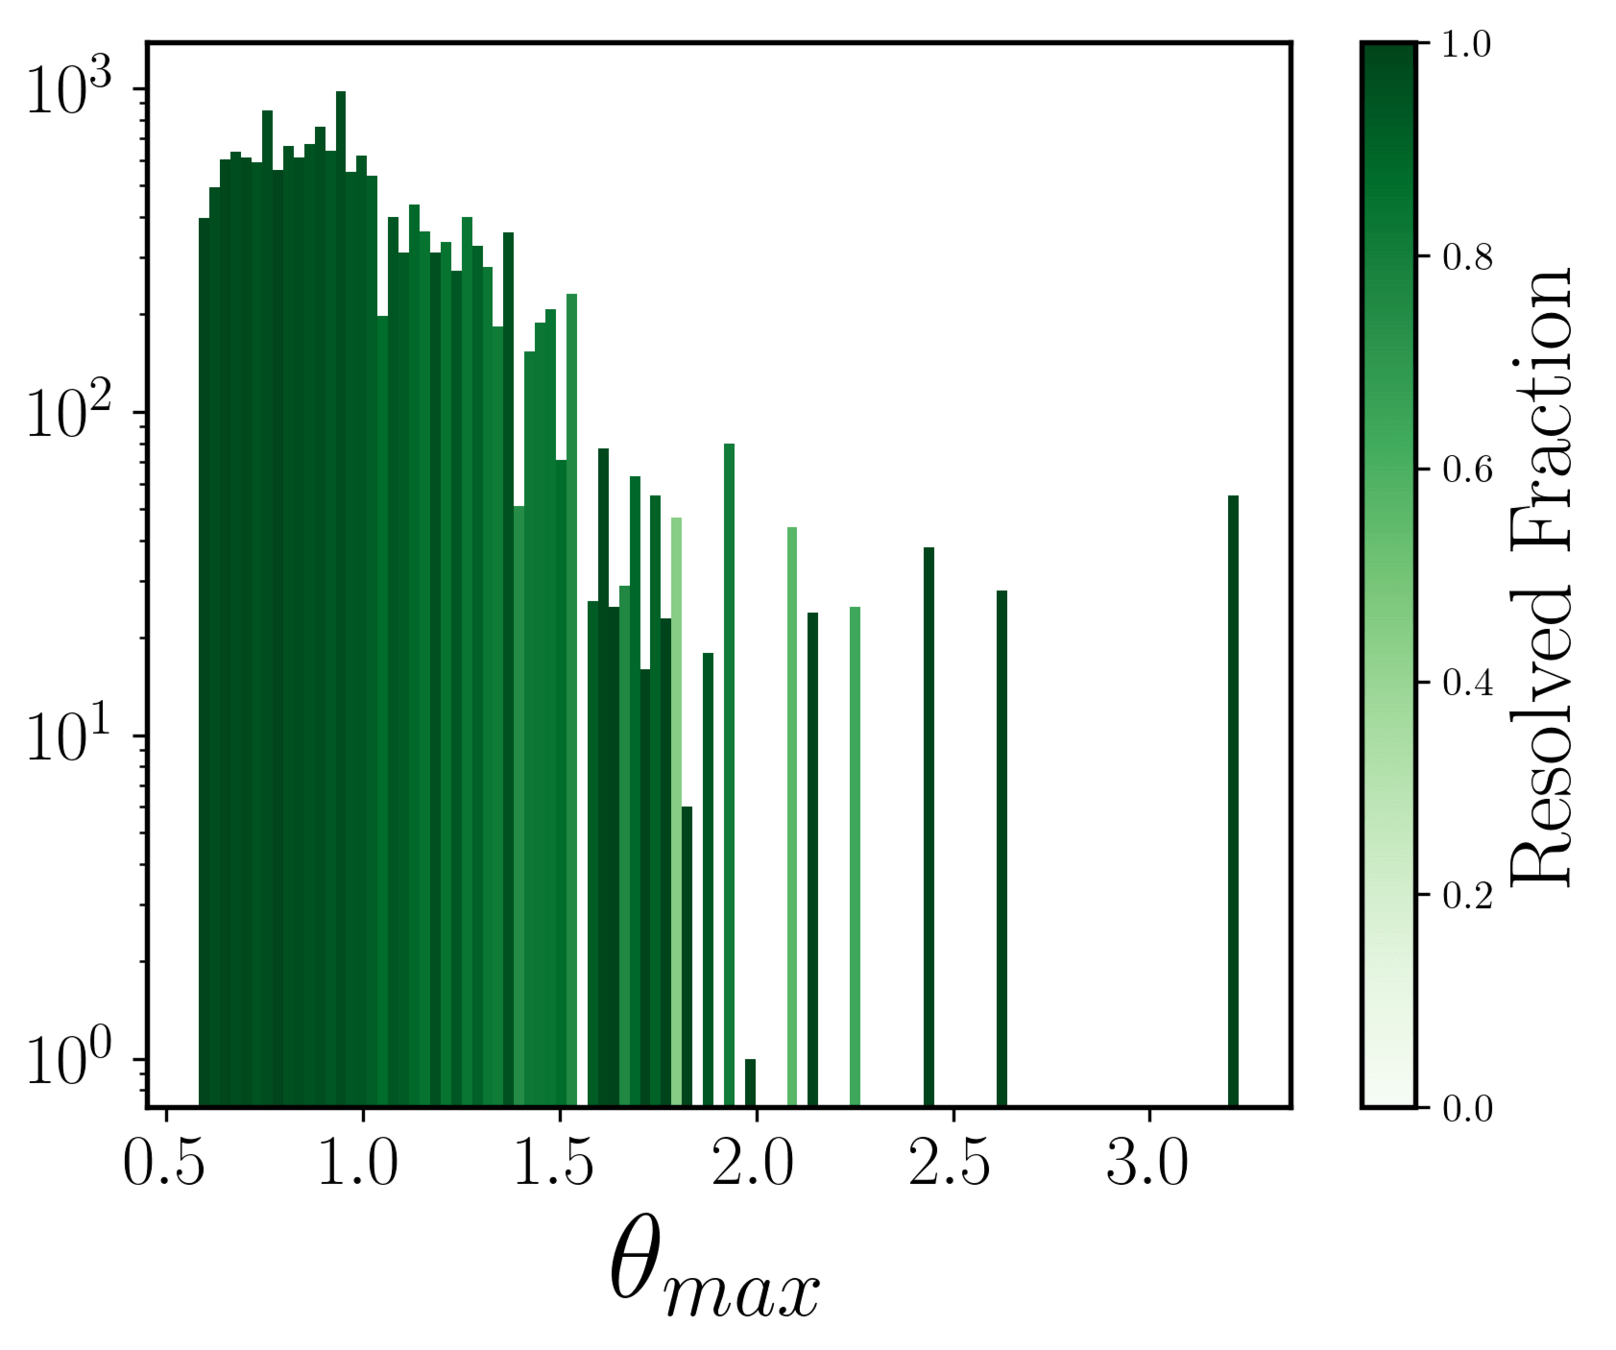
- Pipeline could overall resolve 6.6% systems that had max separation greater than the median seeing of the corresponding band.
- This 'resolved fraction' was higher for the i, r, and z bands.
\theta_{max}
< median seeing: expected to be unresolved (EUR)
\theta_{max}
> median seeing: expected to be resolved (ER)
Aihara et al., 2017
Difference imaging analysis
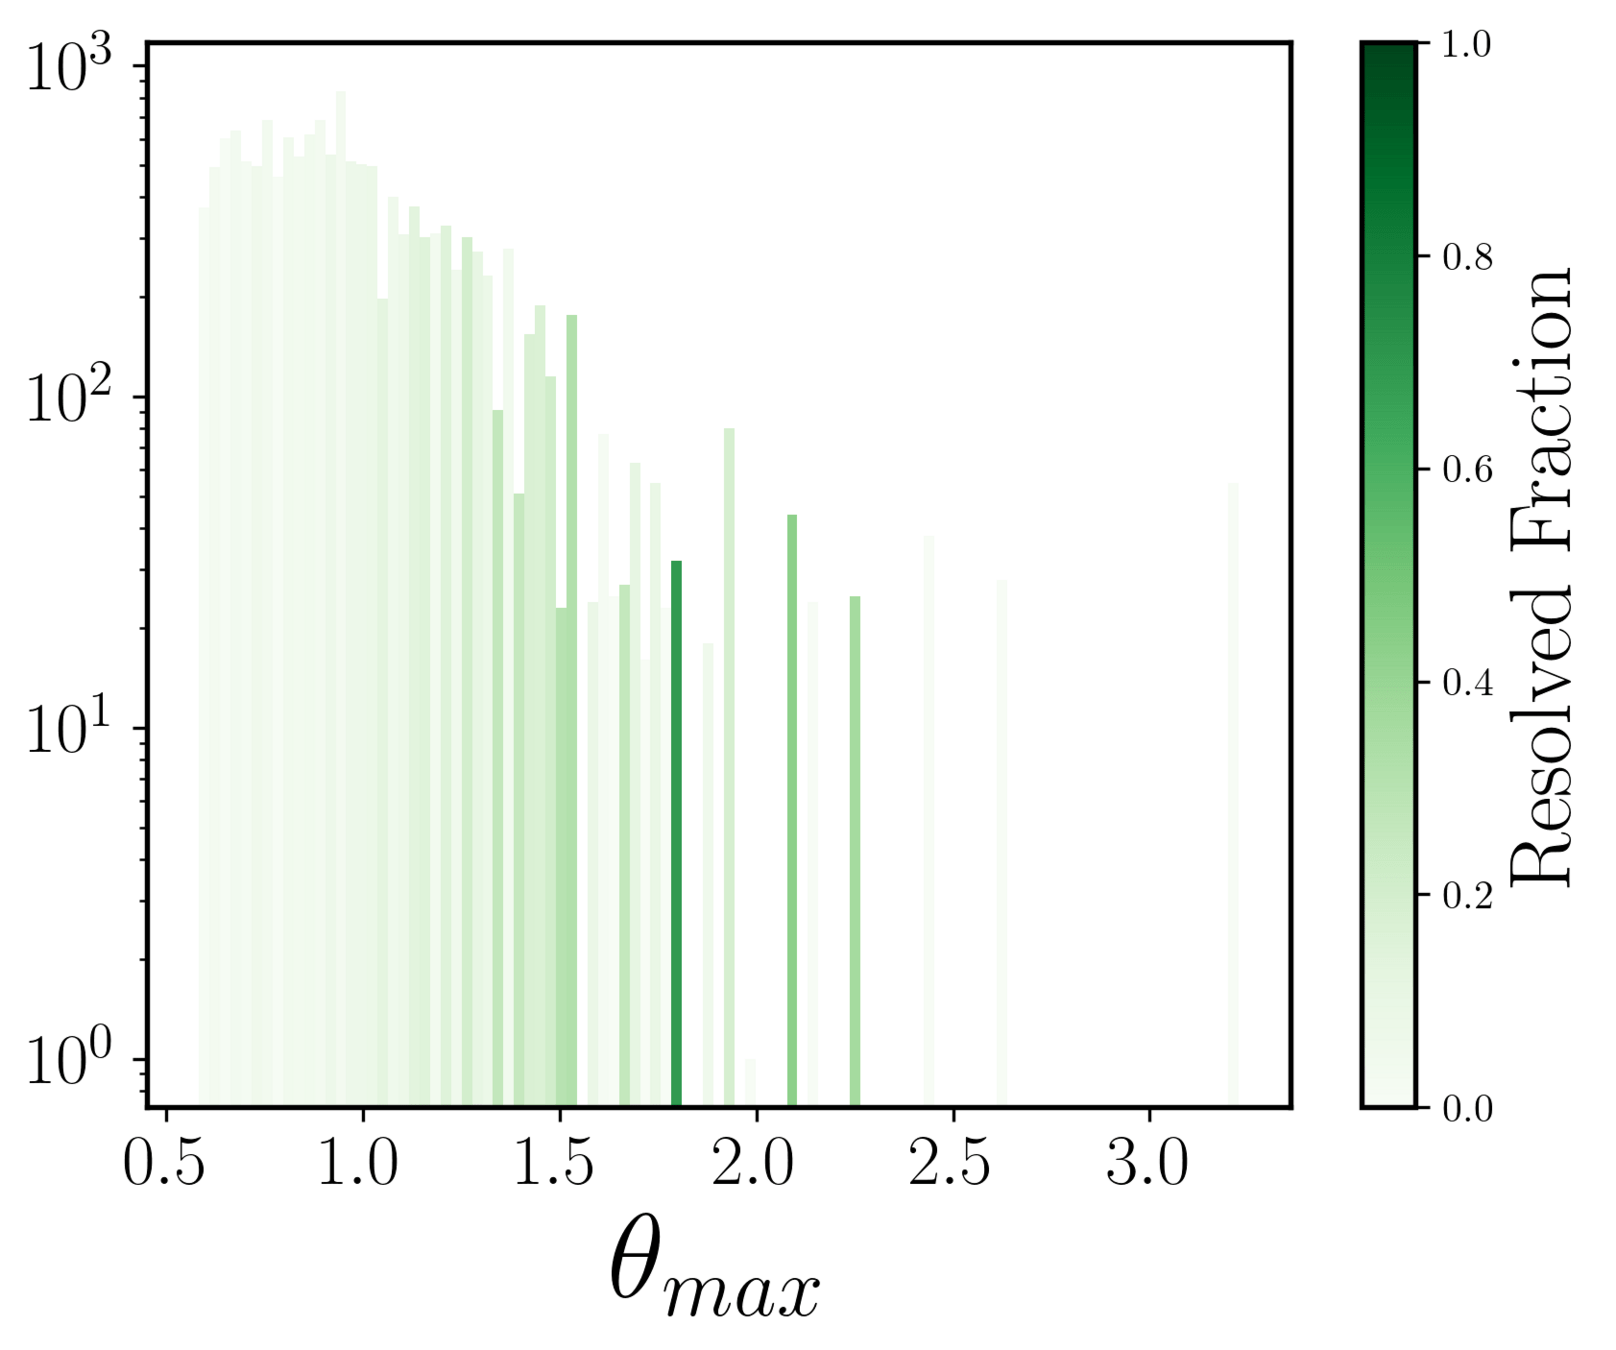
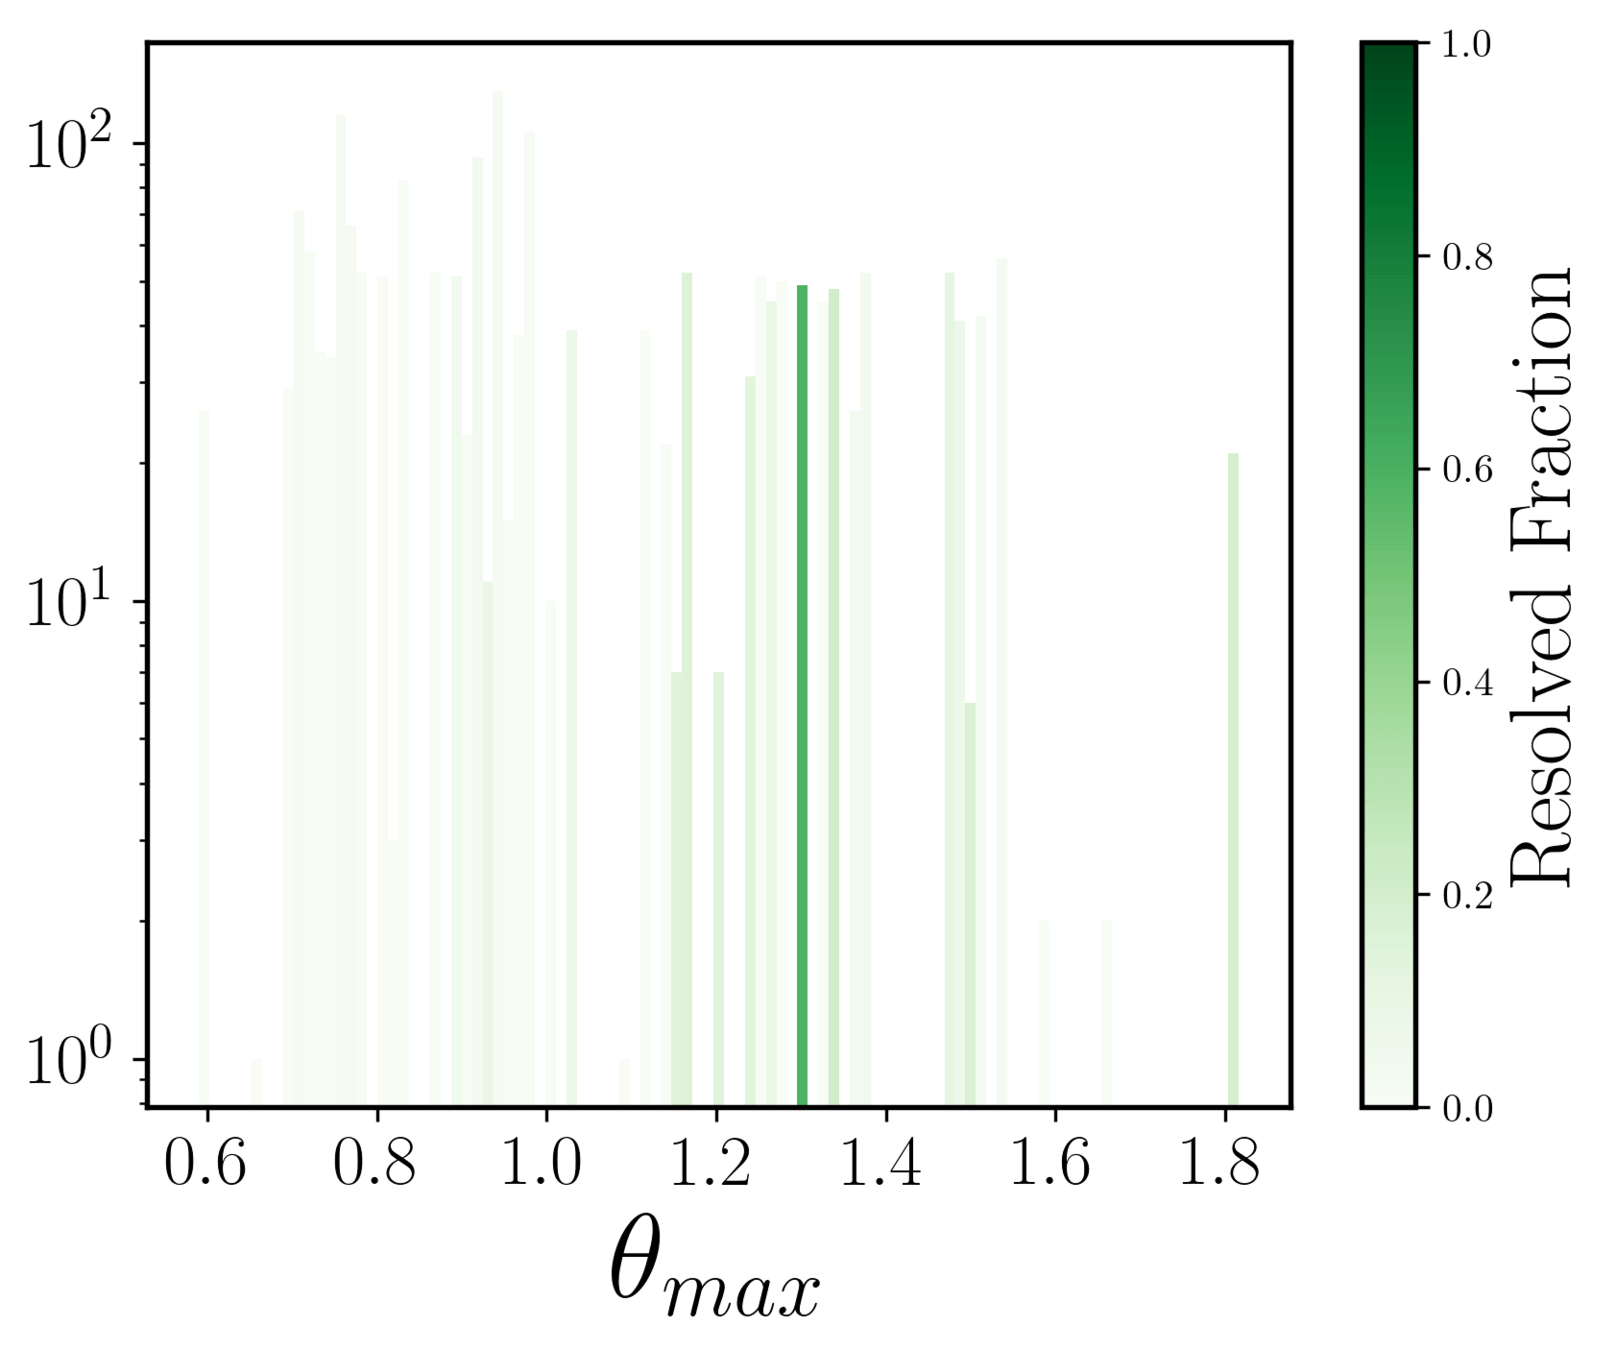
Resolved fraction with respect to median seeing of each band
Individual image level analysis:

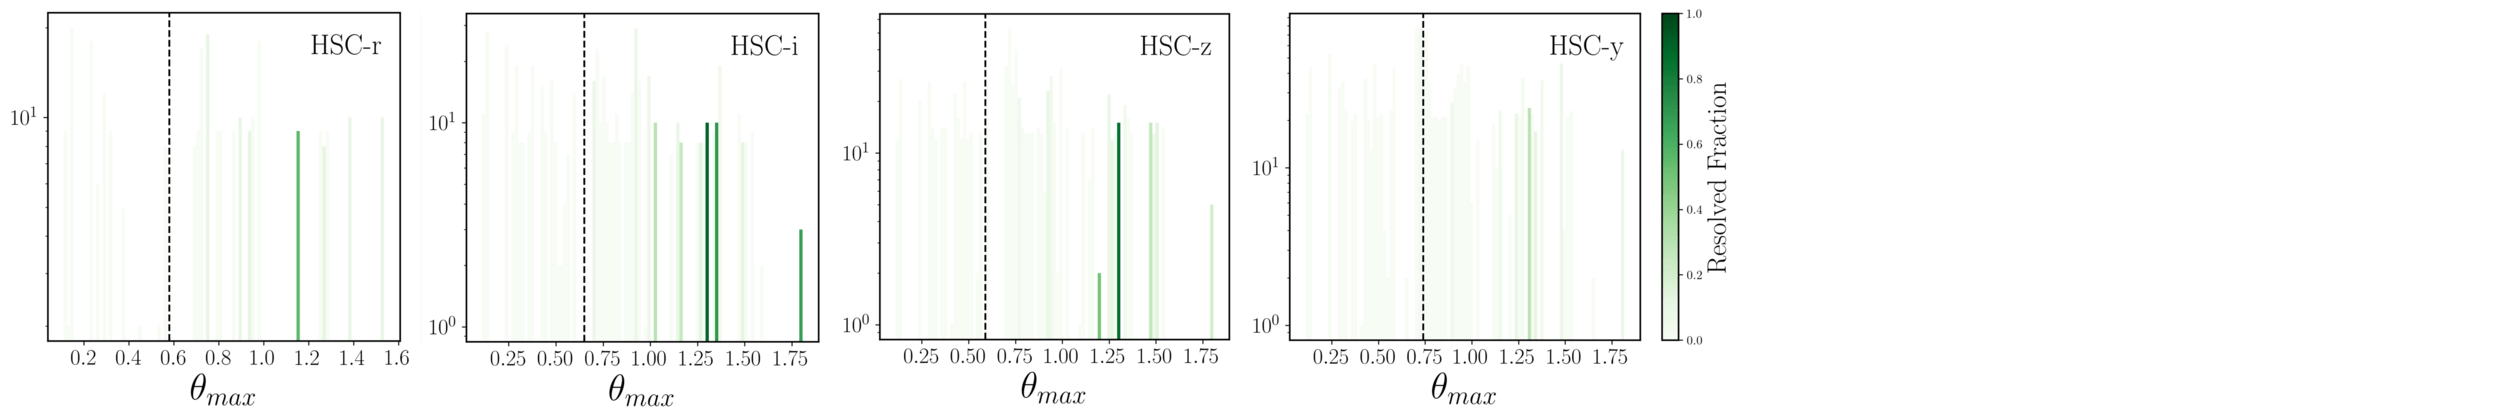
Doubles
Quads
vertical dashed line: median seeing
Summary
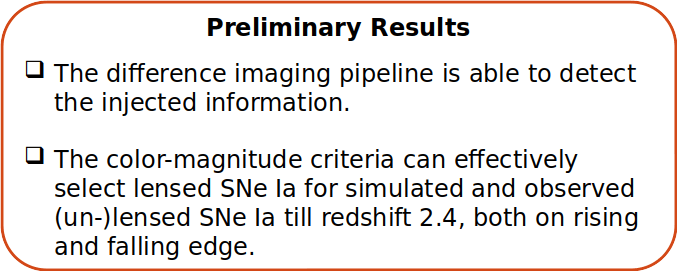
- Employed difference imaging pipeline recovers ~70% of the injected data of lensed SNe Ia.
- The recovery fraction decreases for fainter injected systems. It is slightly higher for quads and decreases significantly for the HSC y-band.
- The resolved fraction is weakly correlated with the angular separation of system for the doubles.
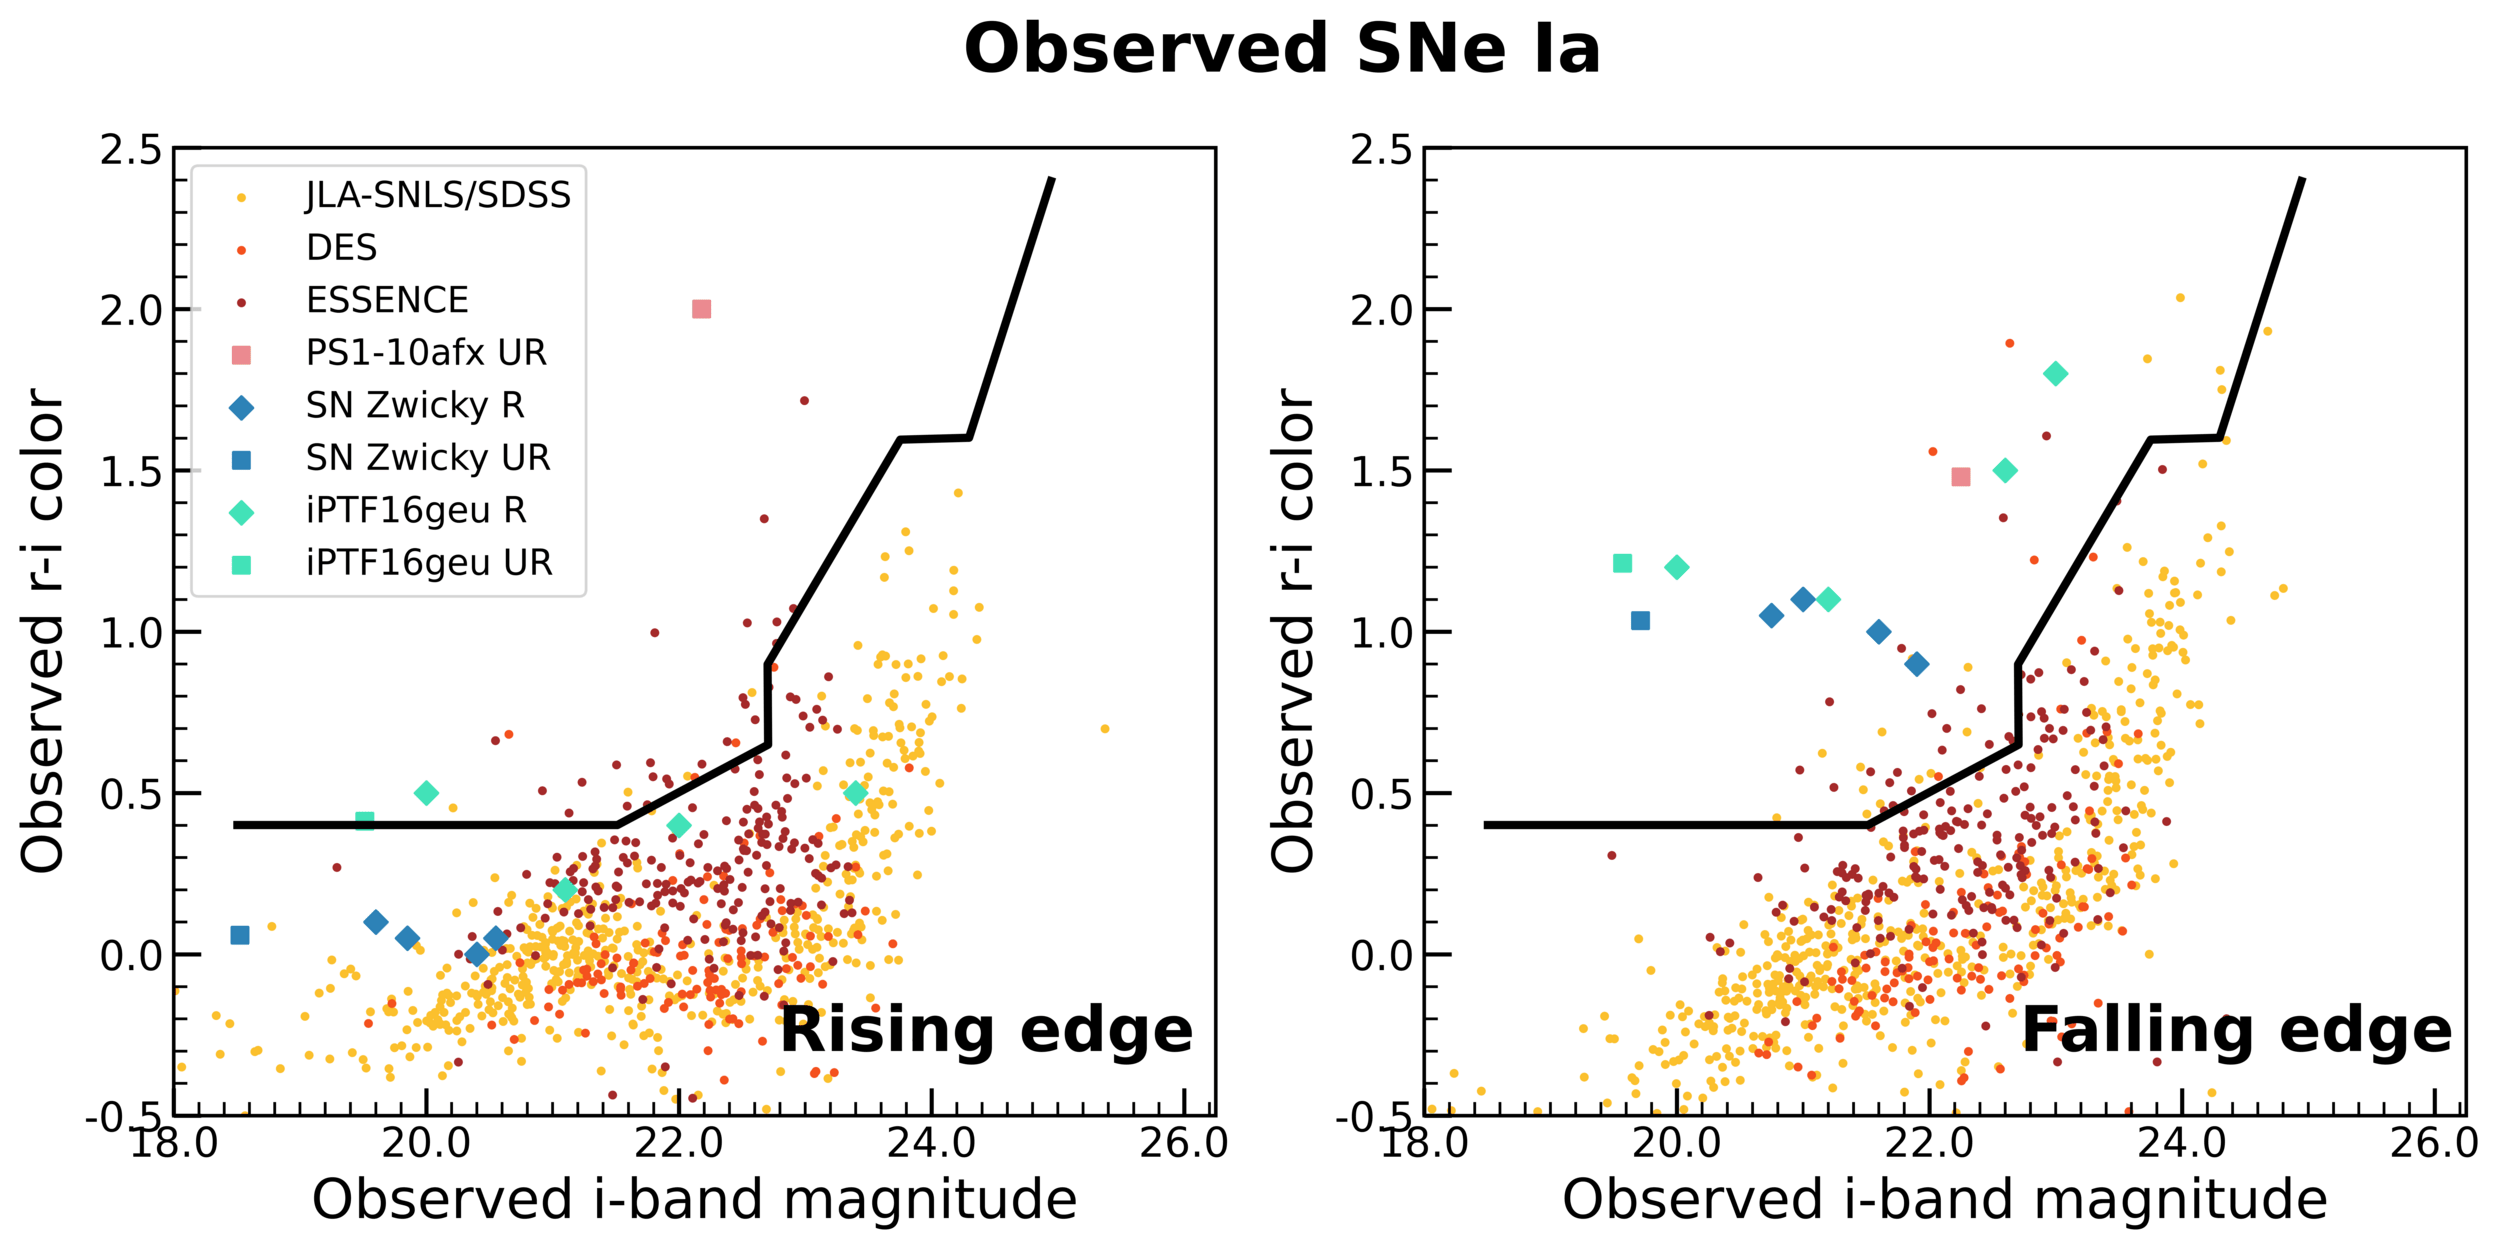
Color-magnitude analysis
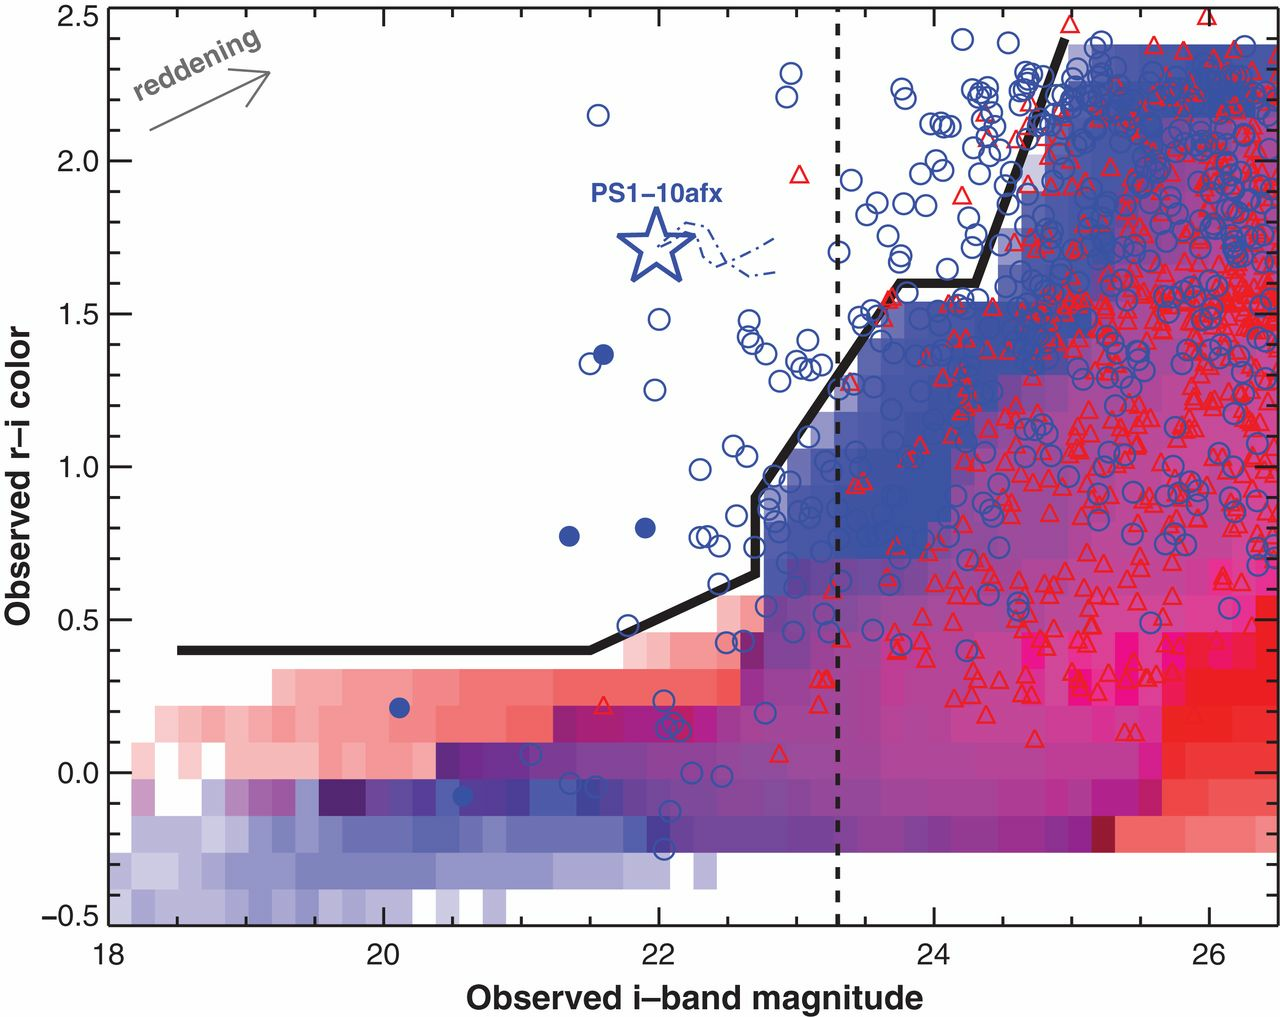
Quimby et al. 2014
: Unlensed SNIa
: Unlensed core collapse
: Lensed SNIa
: Lensed core collapse
The redder supernovae for given i-band magnitude are more likely to be lensed SNeIa when studied for unresolved photometry on rising phase of light curve.
The black bold curve separates the lensed SNeIa from unlensed both on the rising and the falling edge of light curve for z < 2.4
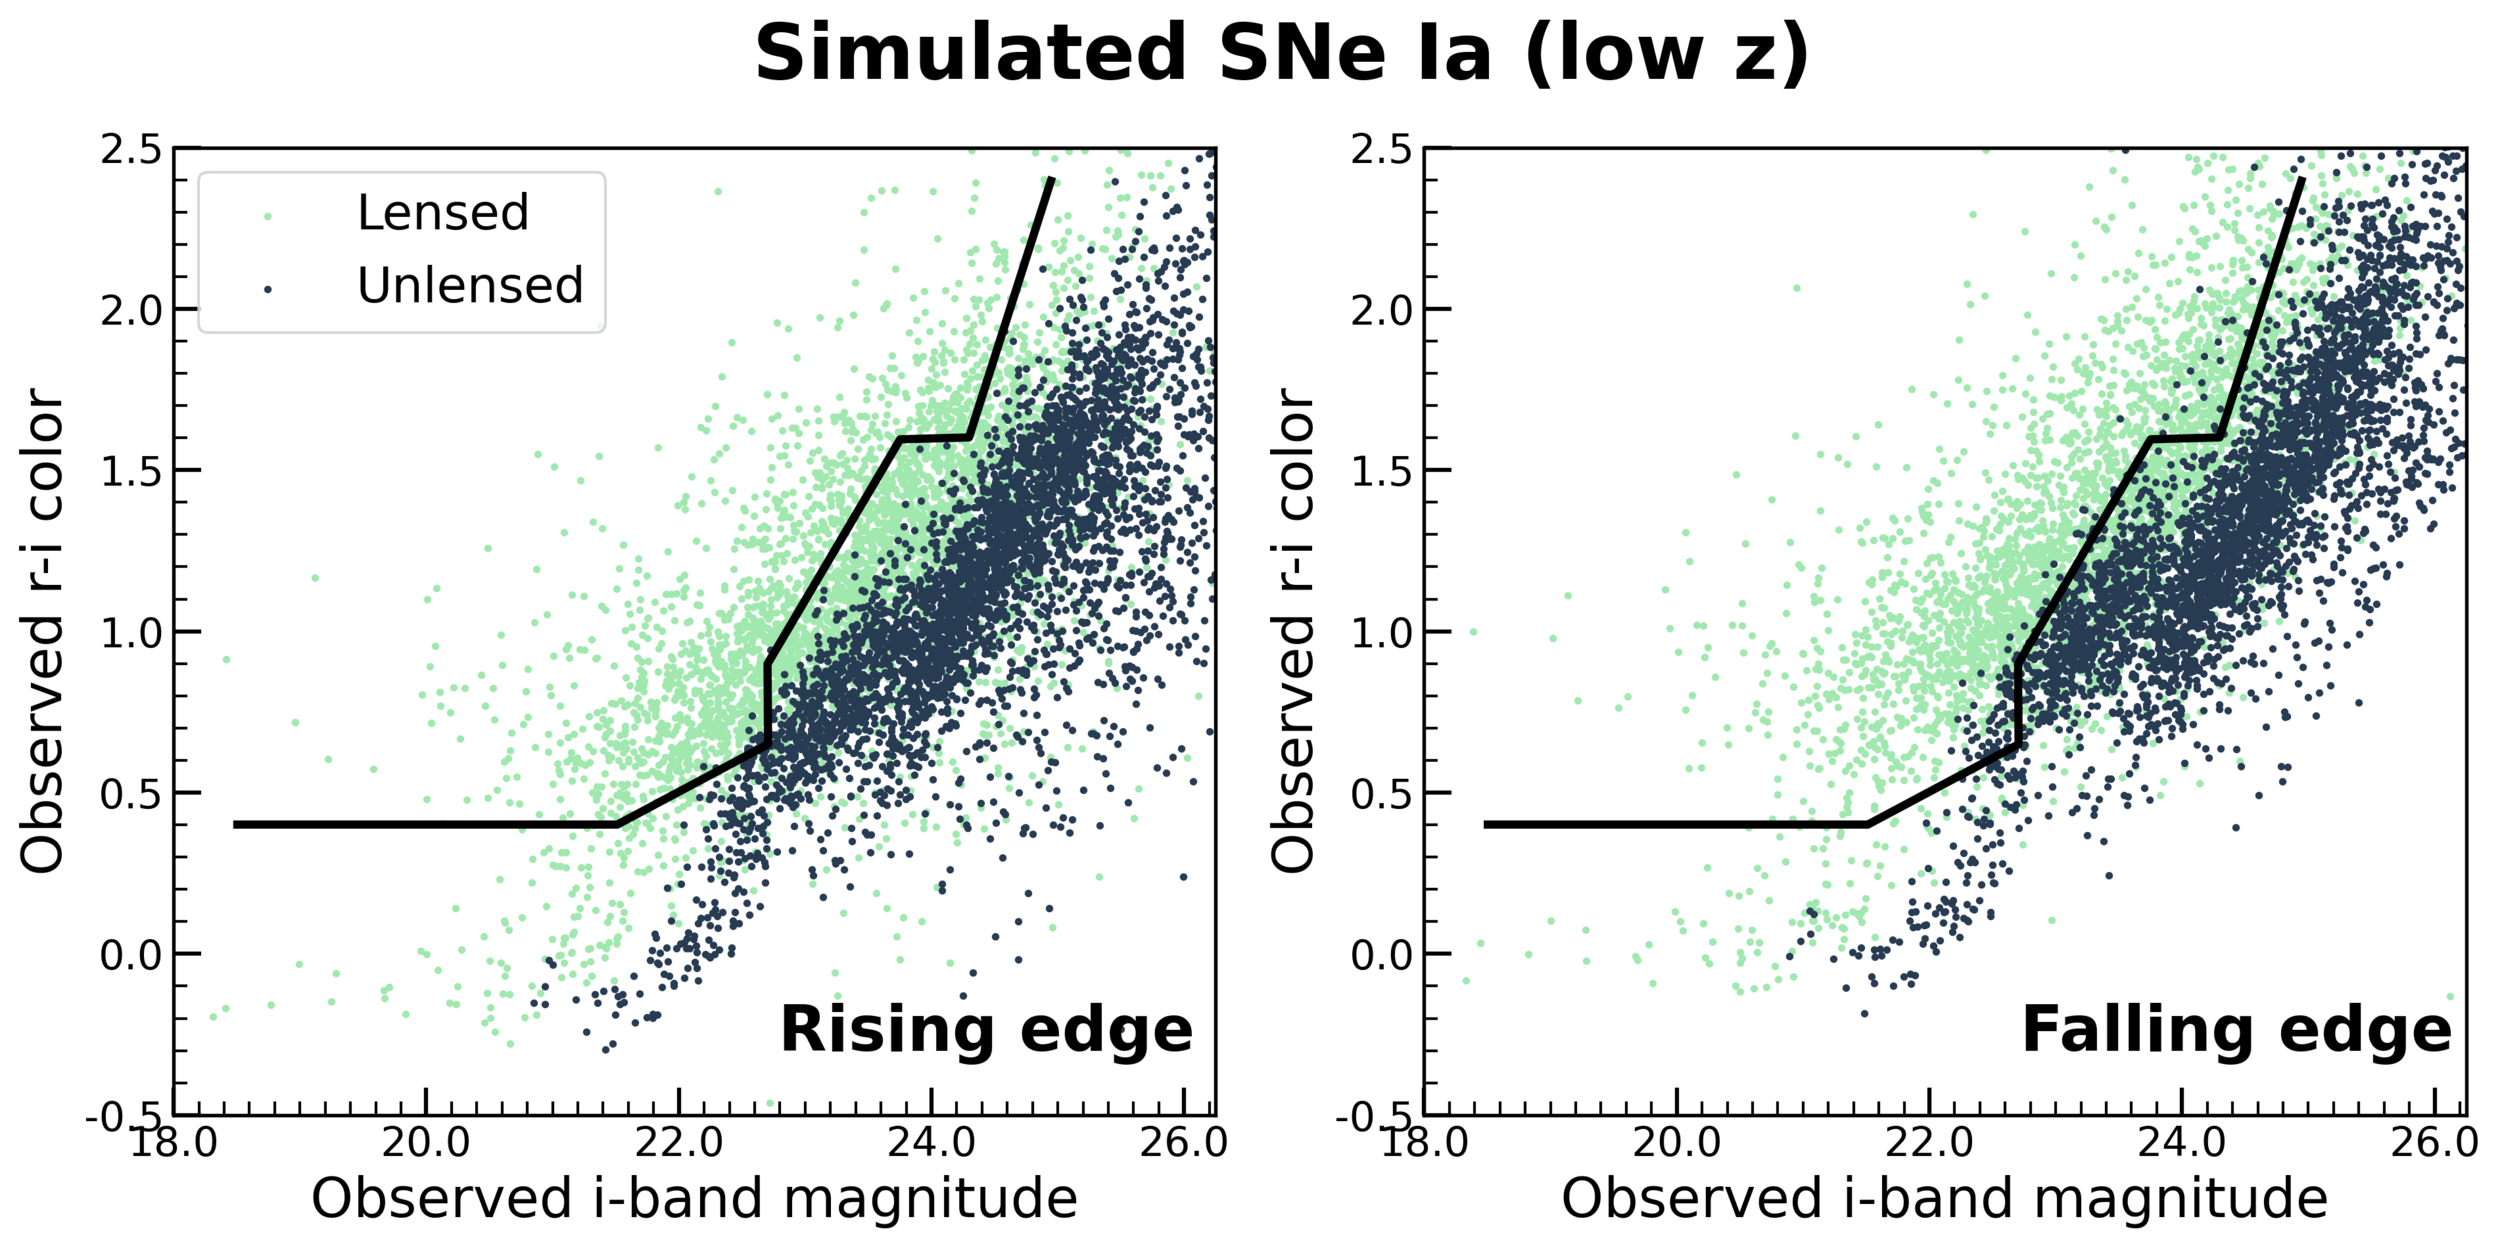

Contamination from unlensed SNe is neglegible.
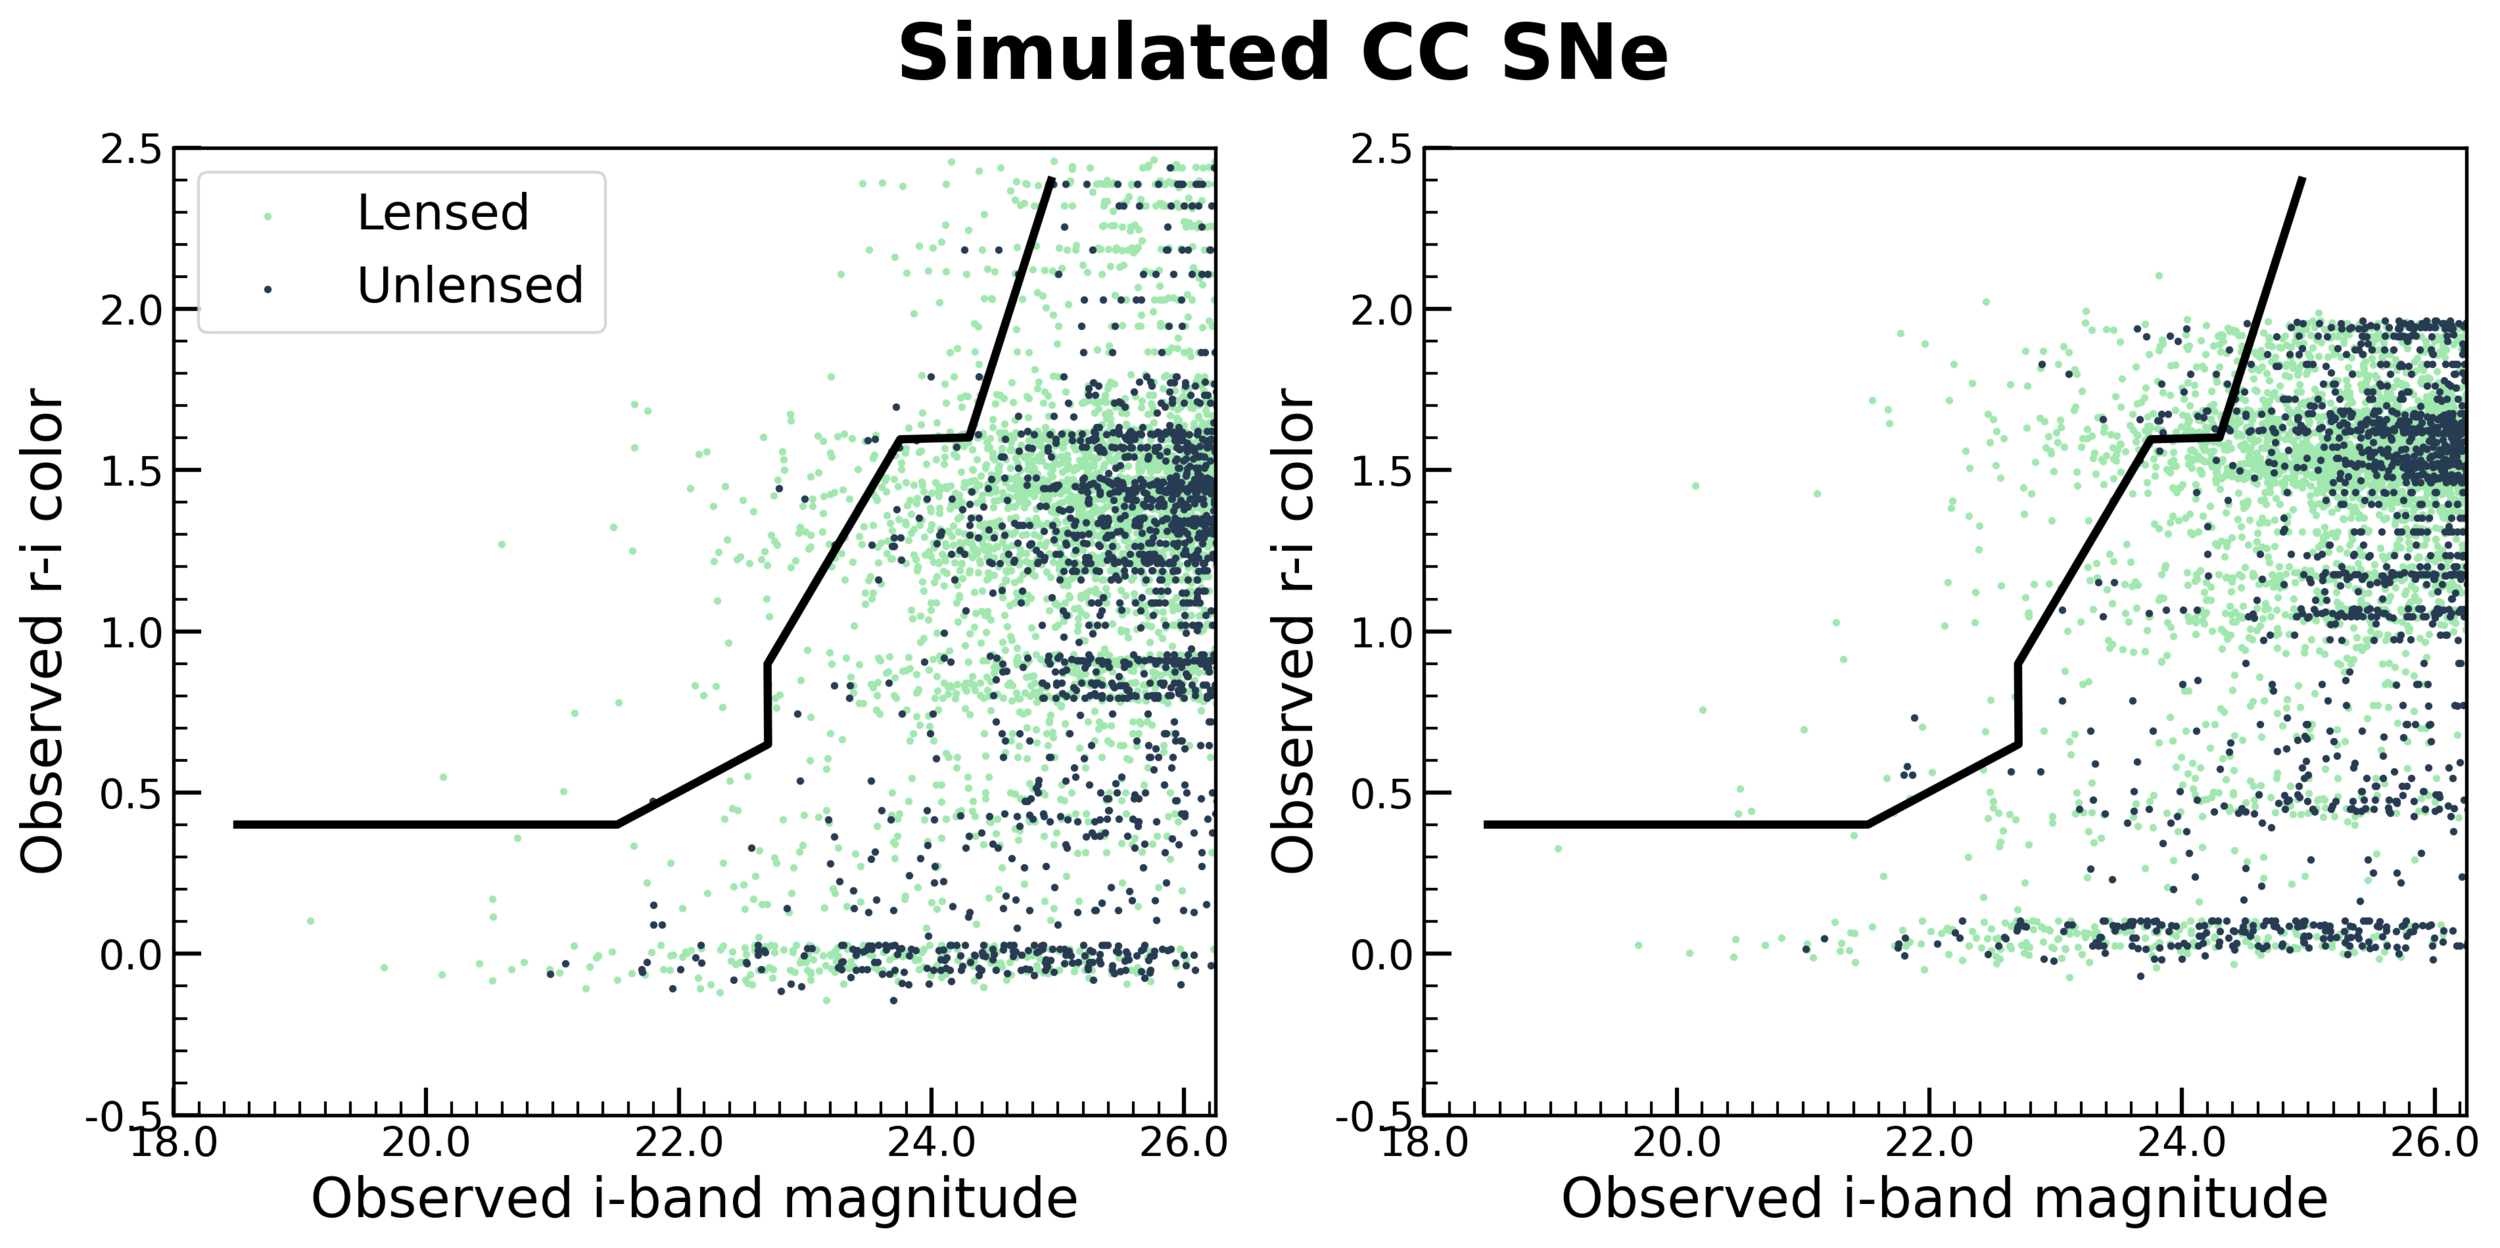
Contamination from CC SNe
Color-magnitude analysis
Contamination from unlensed SNe is neglegible.
Contamination from CC SNe
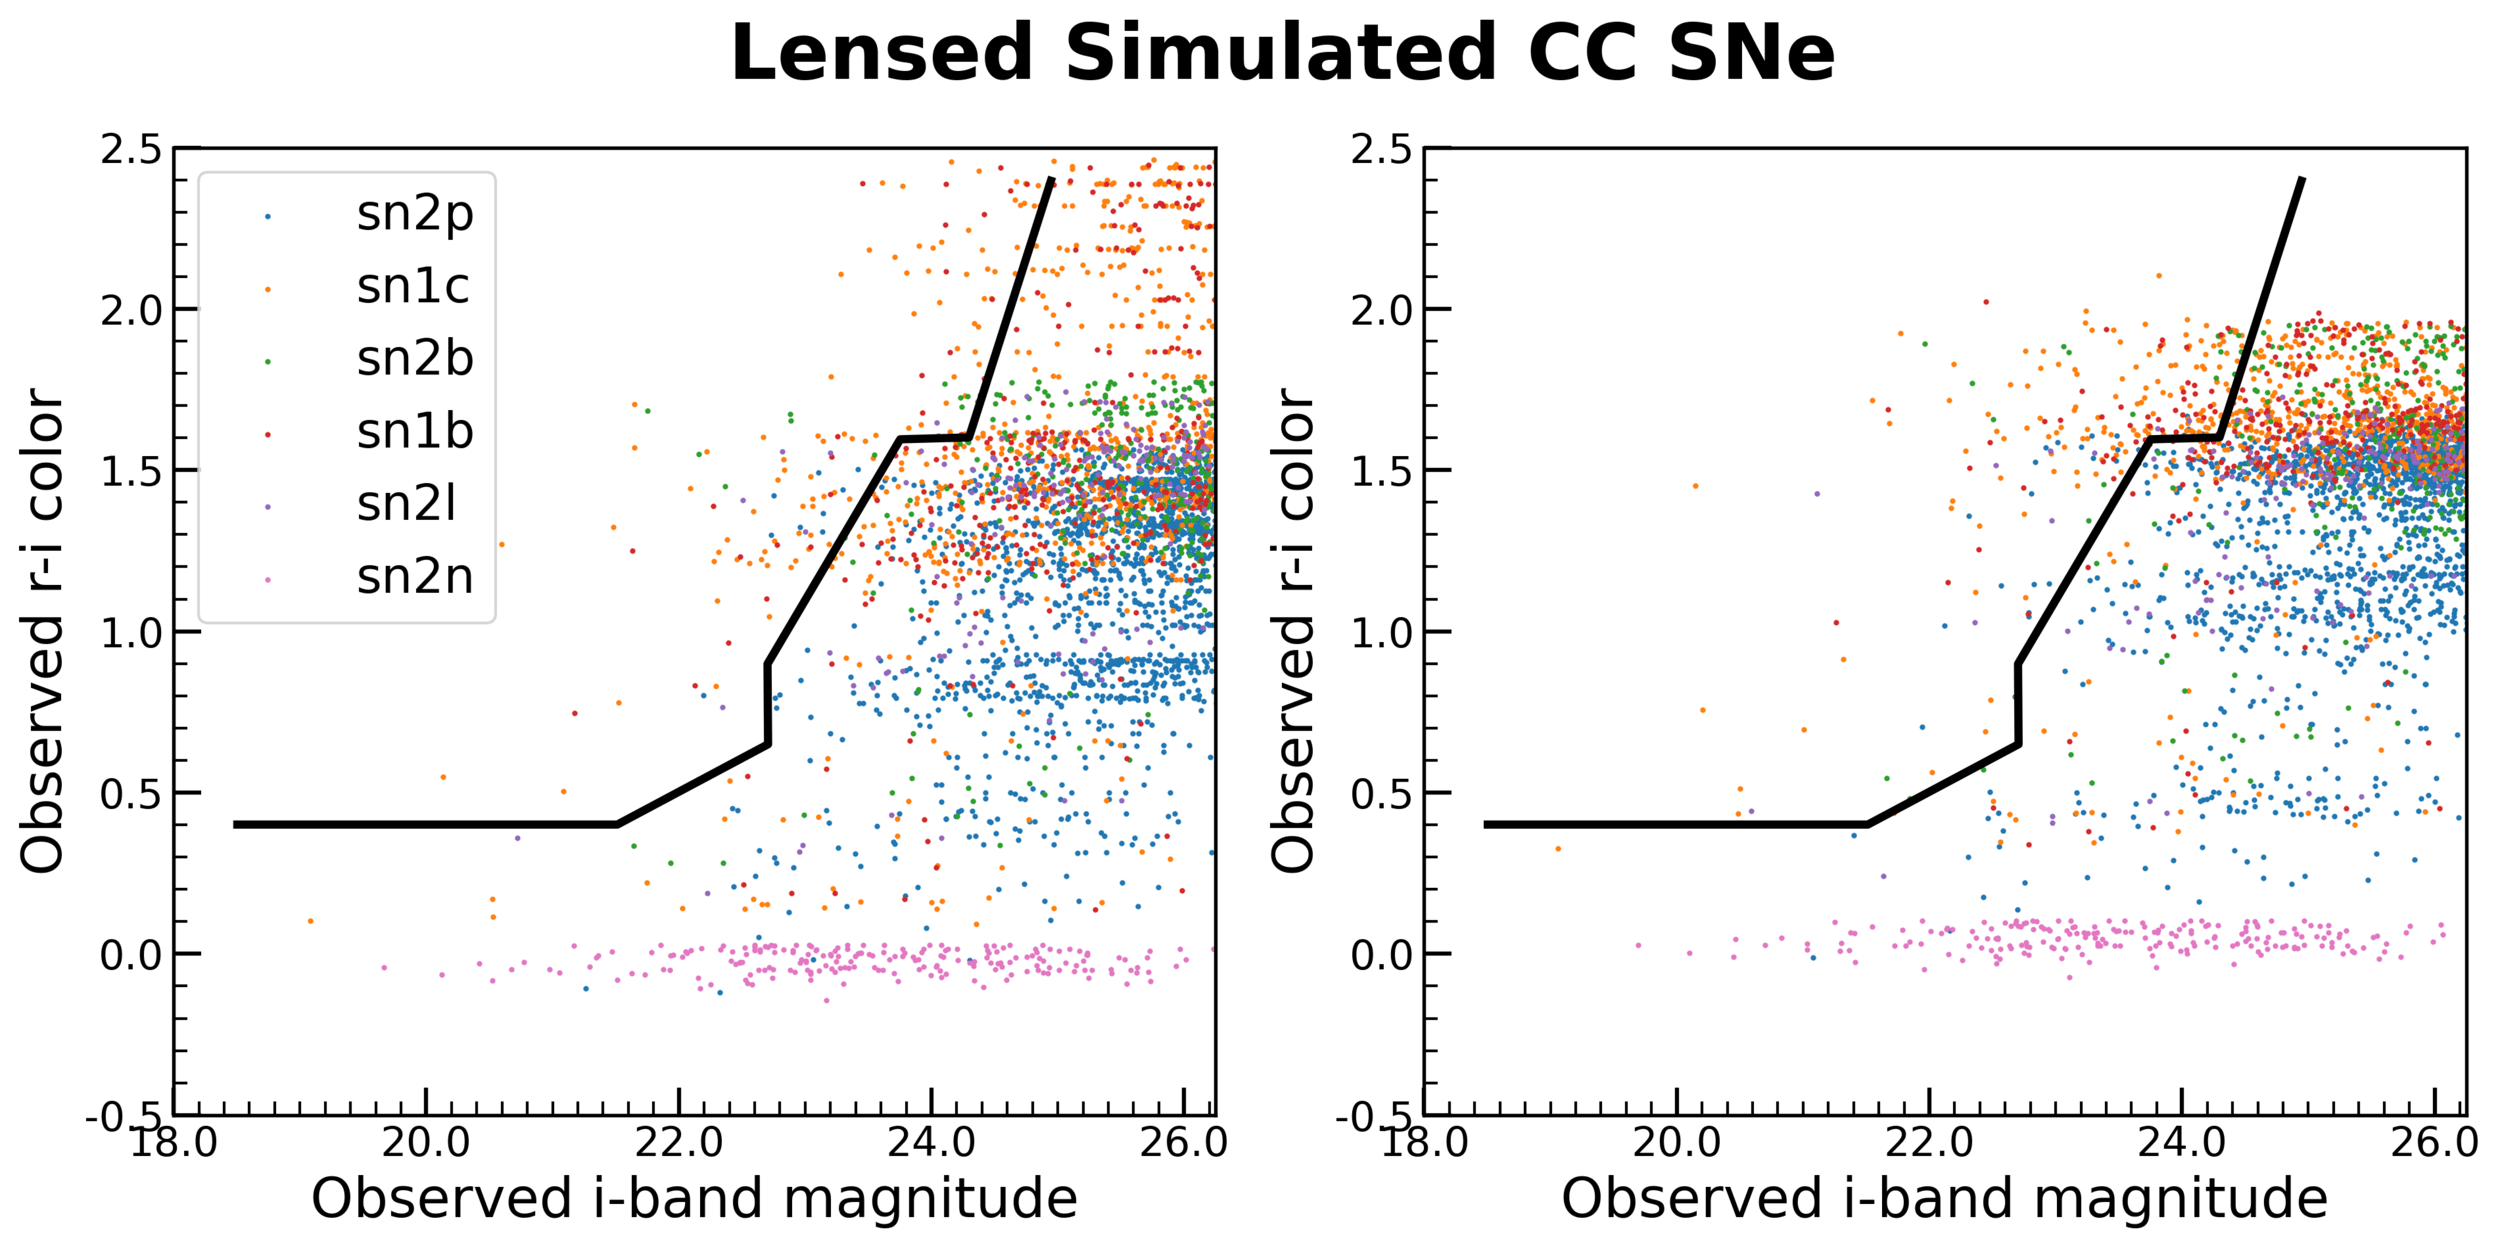
Color-magnitude analysis
Primary contaminants are lensed SNe Ib and Ic.
Summary of results
- Employed difference imaging pipeline recovers ~70% of the injected data of lensed SNe Ia.
- The recovery fraction decreases for fainter injected systems. It is slightly higher for quads and decreases significantly for the HSC y-band.
- The resolved fraction is weakly correlated with the angular separation of system for the doubles.
- Colour-magnitude effectively selects lensed SNe Ia for simulated and observed (un-)lensed SNe Ia till redshift 2.4, both on rising and falling edge. Contamination from unlensed CC SNe is low. Primary contaminants are lensed CC SNe Ib and Ic.
Thank you!
Ongoing work
- Combine detections across epochs and study trends.
- Study extended DIA sources to check if extendedness can be used as a marker for a lensed system.
- Incorporate LSST cadence.
Extra slides
Extra slides


Extra slides

The criteria hold well for the observed unlensed and lensed SNeIa.
Extra slides
Extra slides
Difference imaging analysis
Resolved fraction with respect to median seeing of each band

\theta_{max} < \text{median seeing}
\text{Pipeline could not resolve}
\theta_{max} > \text{median seeing}
\text{Pipeline could not resolve}
Individual image level analysis:
Difference imaging analysis
Resolved fraction with respect to median seeing of each band
\theta_{max} > \text{median seeing}
\text{Pipeline could resolve}
\theta_{max} > \text{median seeing}
\text{Pipeline could resolve: only doubles}
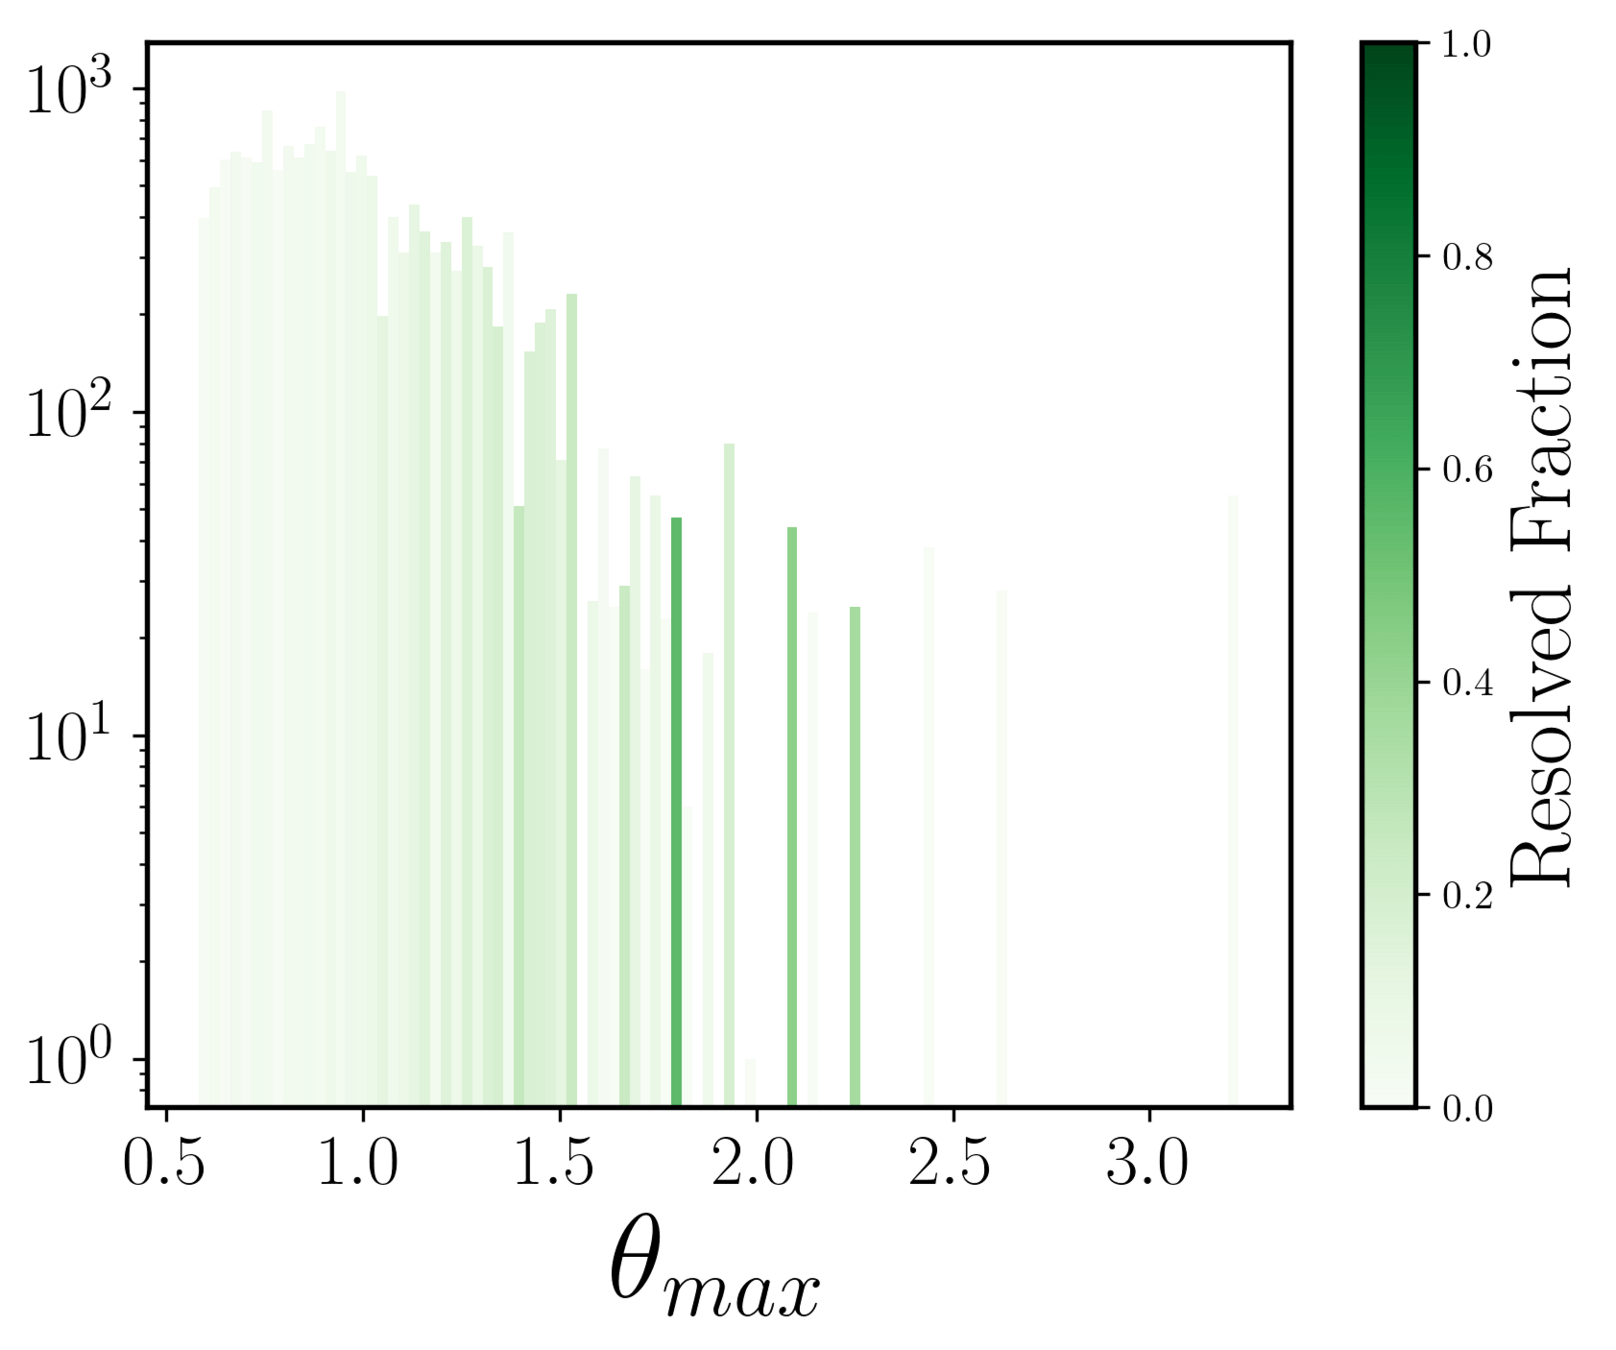
some trend
Individual image level analysis
Difference imaging analysis
Resolved fraction with respect to median seeing of each band
\theta_{max} > \text{median seeing}
\text{Pipeline could resolve}
\theta_{max} > \text{median seeing}
\text{Pipeline could resolve: only quads}
no trend
Individual image level analysis
Comaparison of unlensed CC SNe CMDs from low and high redshift


PRJ 501: Recap
Quimby et al. 2014
PRJ 502


PRJ502_MS19054
By Prajakta
PRJ502_MS19054
Presentation made for IDC451: Seminar Delivery course on the topic Gravitational Lensing and the Most Powerful Explosions in the Space


