with Altair and Vega-Lite
Improving Your
Data Visualization Flow
Rachel House
2020 TomTom Applied Machine Learning Conference
2020 Open Data Science Conference (ODSC) West
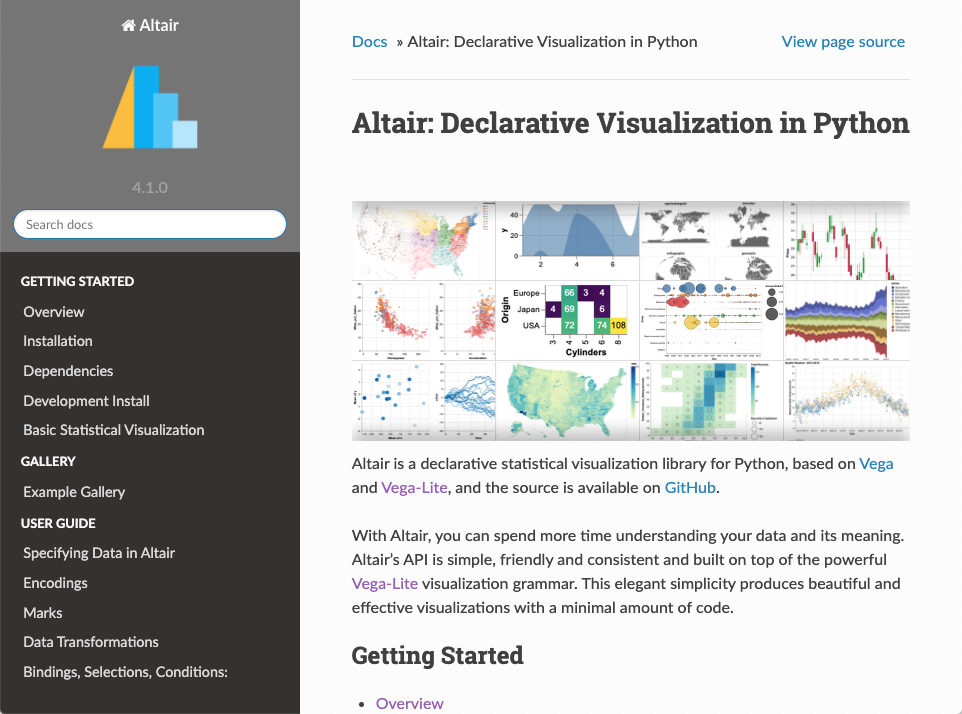
data visualization in the wild

There is a lot of data in the world.


Transforming data from nonintuitive representations to intuitive representations is essential.


1.
2.
exploratory graphics
explanatory graphics
- simple, quick
- just for you
- getting to know a dataset
- crafted, considered
- for an audience
- communicating data findings

The way forward is not always clear.


Even after choosing a library, things can get hairy...
"All I want to do is change the tick format!"
"Ugh, why is the API for the scatterplot completely different from the bar chart?"
"What? This library doesn't support mouseover?"
"Well, I found the old .png file, but the code won't run in this new environment to recreate it."

There has to be a better way.
the elements of a good
data visualization flow
What makes a good data visualization flow?

A good data visualization workflow must enable you to:
1. Produce visualizations quickly and intuitively.
2. Easily create interactive visualizations.
3. Easily share and reproduce visuals.


DATA VISUALIZATION 4EVA!!!
Who's excited?
Excellent! Now it's time for Altair and Vega-Lite.
the altair stack

D3.js
D3 is a JS library that manipulates the HTML, SVG, and CSS in your web browser to render visualizations.
D3.js
Vega
Vega is a low-level declarative visualization grammar with a JSON syntax. Vega is sits atop D3 and provides the building blocks to create interactive visualizations.
D3.js
Vega
Vega-Lite
Vega-Lite is a high-level, concise declarative visualization grammar with a JSON syntax, based on Vega. It works by compiling its specifications to Vega specifications.
D3.js
Vega
Vega-Lite
Altair
Altair is a declarative visualization library for Python that is built on top of Vega-Lite.
That is one sweet stack.

Thanks to D3, you aren't tied to a particular framework or backend to render your visualizations.
All you need is modern web browser.
This makes your work highly portable and very shareable.
All visualizations in this stack can be represented as a JSON specification that is interchangeable amongst Altair, Vega-Lite, and Vega.
You can tinker at whichever stack level you prefer.
What if instead of passing around pixels, we pass around visualization specifications plus data?
With Vega-Lite, we can share open-source specs and data, not just static copies of visualizations.
Hello, reproducibility!

- Jake VanderPlas,
Creator of Altair
the vega-lite grammar

"Altair is a declarative visualization library..."
"Vega-Lite is a high-level grammar of interactive graphics..."
"Vega is a low-level declarative grammar with a JSON syntax..."
No worries, let's break it down.

A grammar of graphics is a tool to concisely describe the components of a visualization.

Graphics grammars provide mental models and building blocks, rather than chart templates, to create visualizations.
The Vega-Lite grammar is declarative, enabling you to describe what you want to accomplish rather than how the computer must accomplish it.
This results in a more natural language-based (and human) approach to thinking about and implementing graphics.
declarative
imperative
- how to accomplish
- what to accomplish
- manually specify all plotting steps
- details automatically determined by the system
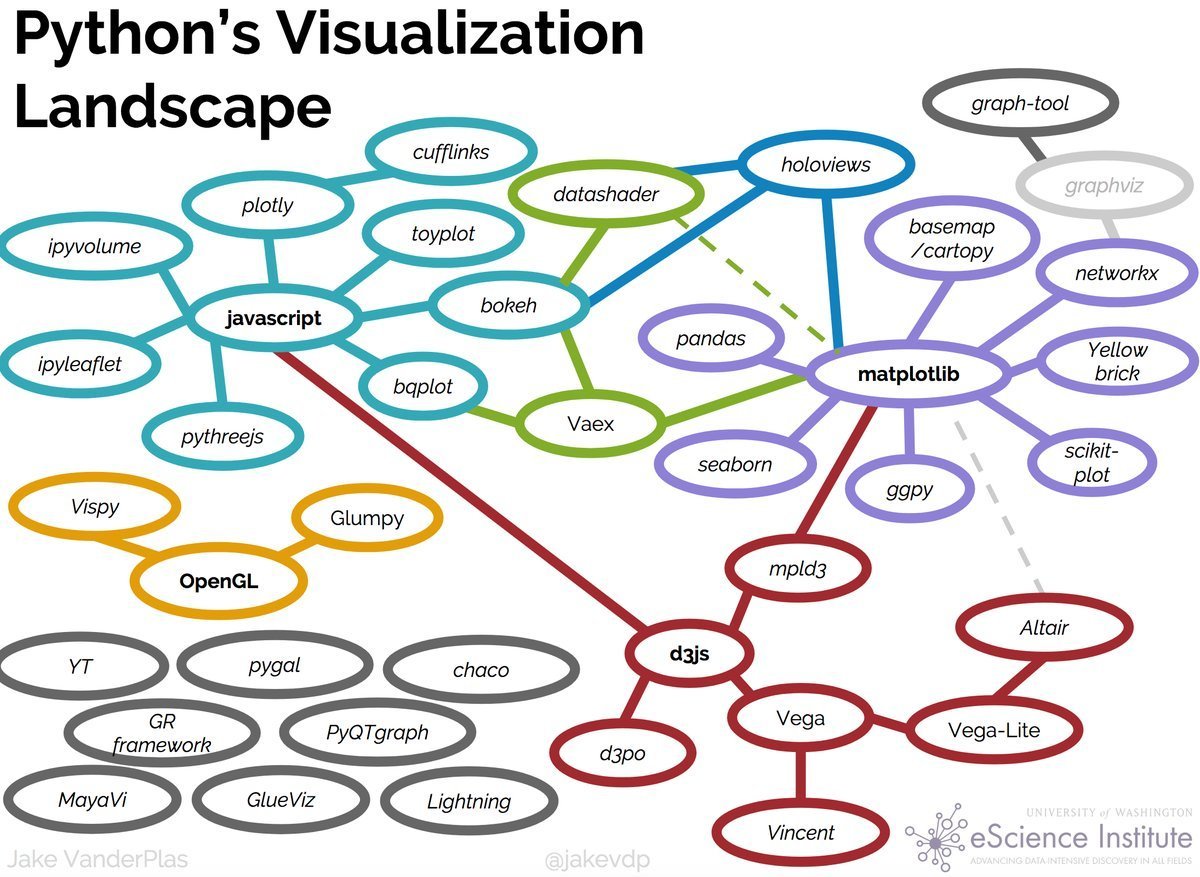
Again, credit to: Jake VanderPlas, The Python Visualization Landscape. (PyCon 2017)
- specification and execution are intertwined
- specification and execution are separate
- writing a Python script to sift through data
- writing a SQL command
When visualizing, we want to focus on
data and relationships, not syntax and libraries.
Talk is cheap.

Now for some examples.
data
encoding
mark
data transformation
chart customization
data
encoding
mark
data transformation
chart customization
Nifty, huh?
Vega-Lite enables quick, intuitive creation of visualizations.

In 2017, Vega-Lite introduced
a grammar of interactions.
mouseover
pan and zoom
interval selection
brushing
...and more, all as first-class citizens of the graphics grammar.
data
encoding
mark
data transformation
chart customization
interactions
data
encoding
mark
data transformation
chart customization
interactions
Interactive visualizations?

Check.
Pythonistas can reap all the benefits of
Vega-Lite grammar when using Altair.

altair examples

Click the link to access the heroku app directly, or view it as an iframe on this slide.
parting thoughts

The Python visualization landscape is diverse, and there are many great libraries out there.
It would be shortsighted to crown a single library as the only tool to use for visualization.
However...

I contend that making Altair and Vega-Lite
the backbone of your data visualization process will enable you to achieve the following in your work:
Intuitive, quick creation of explanatory and exploratory graphics.
Easy generation of interactive visualizations.
Reproducibility of shared visualizations.
Now, go forth and visualize!
Thanks!

resources

Tools & Libraries
Vega: https://vega.github.io/vega/
Vega-Lite: https://vega.github.io/vega-lite/
Altair: https://altair-viz.github.io/
Reading
Talks
The Python Visualization Landscape, Jake VanderPlas. (PyCon 2017)
https://www.youtube.com/watch?v=FytuB8nFHPQ
How to Think about Data Visualization, Jake VanderPlas. (PyCon 2019)
https://www.youtube.com/watch?v=vTingdk_pVM
Improving your data visualization flow with Altair and Vega-Lite
By Rachel House
Improving your data visualization flow with Altair and Vega-Lite
If you're a Pythonista whose data visualization process could use a makeover, then this talk is for you. We'll identify the elements of an effective data visualization flow and explore how the Altair and Vega-Lite stack can improve your own data visualization practice. (09-2021: Added code examples)


