


RhianaH
Rhiana is a front end developer specialising in making web sites and applications accessible for people with disabilities. Combining her background in educational psychology and a love of computers.
@rhianaheath
RoRo March 2018
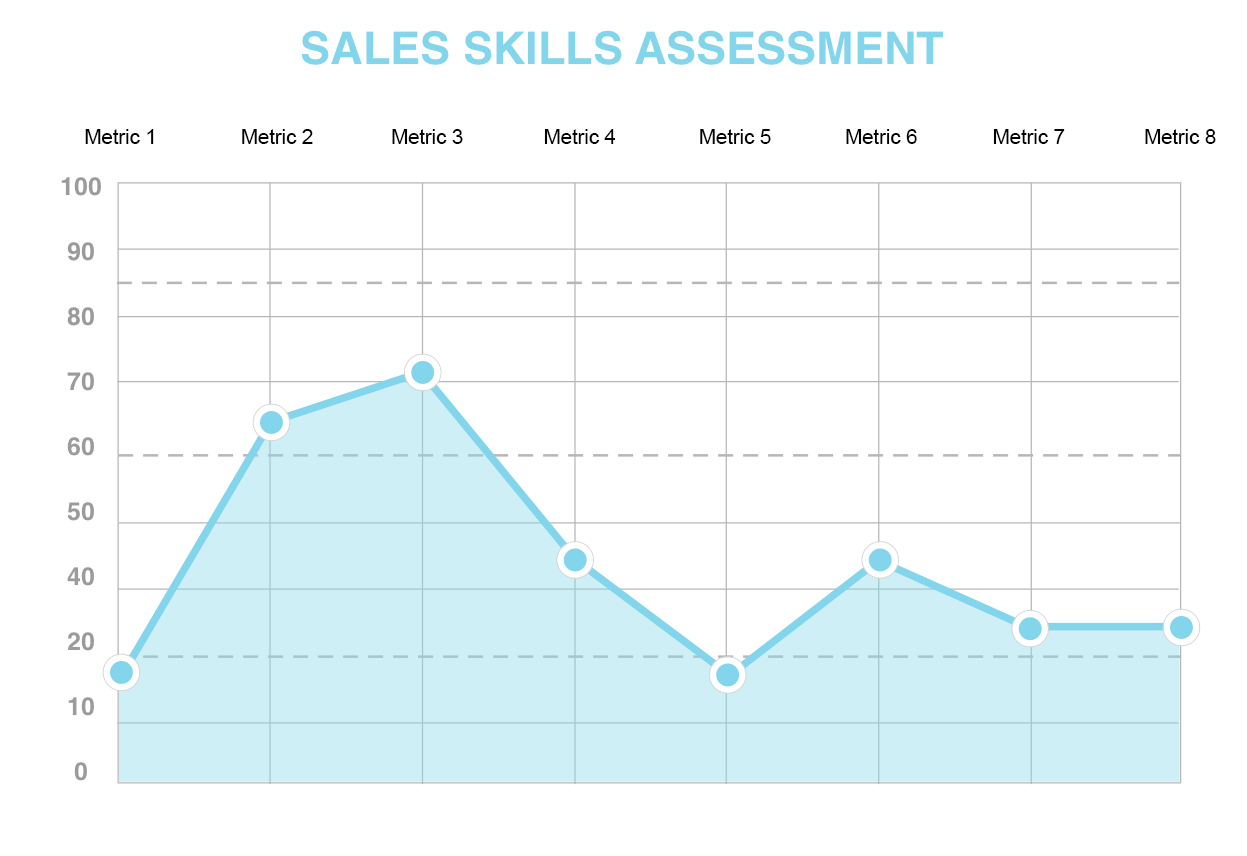
svg.graph circle {
  stroke: white;
  // border-color

  stroke-width: 3;
  // border-width

  fill: #82D5EA;
  // background-color

  z-index: 10;
}
svg.graph .dotted-lines {
  stroke: #979797;
  // border-color

  stroke-dasharray: 1 2;
  // length of dash / gap

  stroke-width: 1;
  // height of border line
}
svg.graph .labels {
font-family: "Muli", sans-serif;
font-size: 14px;
color: #4A4A4A;
text-anchor: middle;
// align-text
}<g class="labels">
<text x="123" y=“33”>
Metric
</text>
</g>
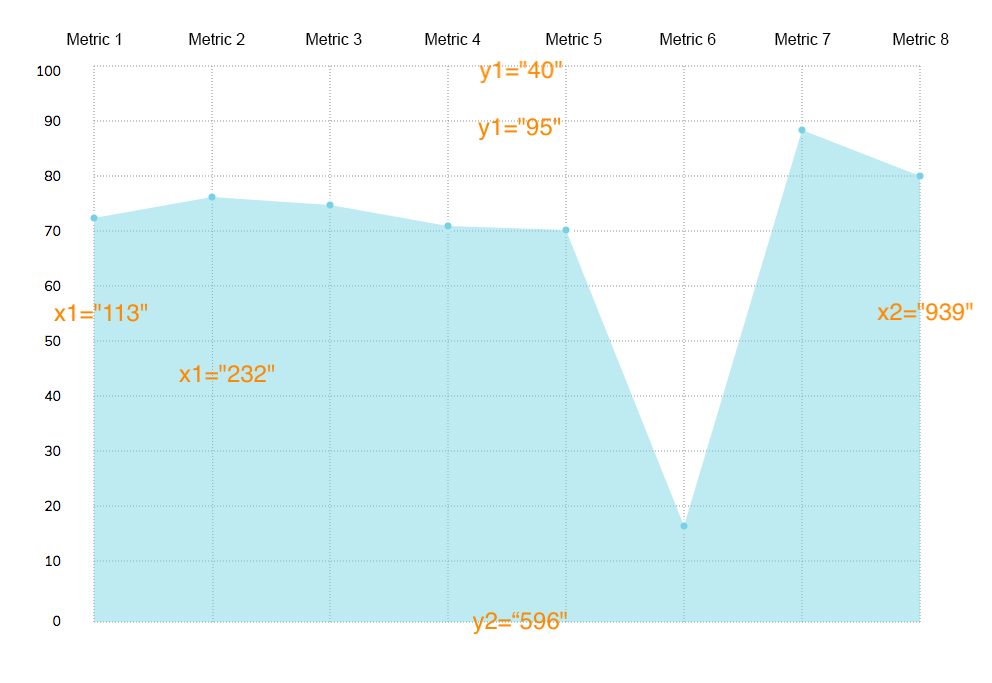
<g class="grid x-grid" id="xGrid">
    <line x1="113" x2="113"
          y1="10"  y2=“360”></line>

...

    <line x1="590" x2="590"
          y1="10"  y2=“360”></line>
</g><g class="grid-lines">
<line x1="113" x2="113"
y1="40" y2=“596">
</line>
<line x1="232" x2="232"
y1="40" y2="596">
</line>
...
<line x1="939" x2="939"
y1="40" y2="596">
</line>
</g><g class="grid-lines">
<% traits.each_with_index do |trait, index| %>
<% x_line = 113.0 + (index * 119.0) %>
<line x1="<%= x_line %>"
x2="<%= x_line %>"
y1="40"
y2="596">
</line>
<% end %>
</g><g class="grid-lines">
<% traits.each_with_index do |trait, index| %>
<% x_line = 113.0 + (index * 119.0) %>
<line x1="<%= x_line %>"
x2="<%= x_line %>"
y1="40"
y2="596">
</line>
<% end %>
</g>y2 = Distance to bottom
y1 = Distance to top
<g class="grid x-grid" id="xGrid">

  <% traits.each_with_index do |trait, index| %>

    <% x_line = 113.0 + (index * 119.0) %>

    <line x1="<%= x_line %>"

          x2="<%= x_line %>"

          y1="40"

          y2="596">
     </line>

  <% end %>

 </g>
119px = Gap between lines
113px = Distance from left
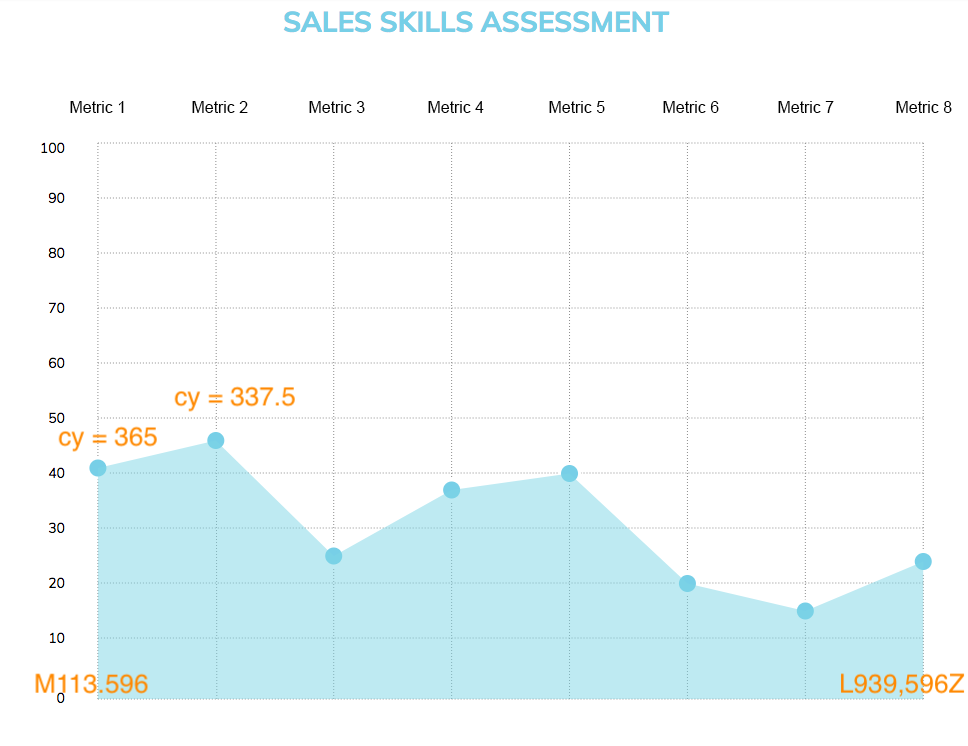
<g class="first_set points"
    data-setname="Some random data">

    <circle cx="113" cy="365"
            data-value="41" r=“10">
    </circle>
    <circle cx="232" cy="337.5"
            data-value="45" r=“10">
    </circle>

 ...

  <circle cx="596" cy="475"
          data-value="22" r=“10">
  </circle>

</g>
<g class="first_set points"
data-setname="Some random data">
<circle cx="113" cy="365"
data-value="41" r=“10">
</circle>
<circle cx="232" cy="337.5"
data-value="45" r=“10">
</circle>
...
<circle cx="596" cy="475"
data-value="22" r=“10">
</circle>
</g>cx and cy
Co-ordinates
data-value is the score
r = radius
<g data-setname="Test scores">
  <% traits.each_with_index do |trait, index| %>

    <% score = scores[trait] %>
    <% xcord = 113.0 + (index * 119.0) %>
    <% ycord = 596.0 - (score * 5.5) %>
    <circle
       cx="<%= xcord %>"

       cy="<%= ycord %>"

       data-value="<%= score %>"

       r=“10">
    </circle>
  <% end %>
</g>
<g data-setname="Test scores">
<% traits.each_with_index do |trait, index| %>
<% score =scores[trait] %>
<% xcord = 113.0 + (index * 119.0) %>
<% ycord = 596.0 - (score * 5.5) %>
<circle
cx="<%= xcord %>"
cy="<%= ycord %>"
data-value="<%= score %>"
r=“10">
</circle>
<% end %>
</g>Formula to calculate the co-ordinate of the score
0
10
Score
Co-ordinates
596px
541px
0
10
Score
Co-ordinates
596px
541px
1
590.5px
{
1
}
5.5px
For every 1 the score increased
the co-ordinate value decreased by 5.5
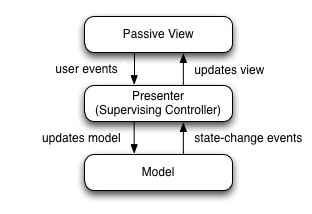
What is a presenter class?
Why a presenter, why not a decorator?
Use a Presenter!
Ryan Bates 2017
# presenters/graph_presenter.rb

class GraphPresenter
  def initialize(view, traits)
    @view   = view
    @traits = traits
  end

  def render
    # Renders the results/_graph.html.erb partial,
    # passing in this presenter as a graph variable

    @view.render("results/graph", graph: self)
  end
  …
end
# How it was then generated through the
# results/show.html.erb page
<%= GraphPresenter.new(self, @traits).render %> # How parts were drawn through the
# results/_graph.html.erb partial
<g class="grid-lines">
<%= graph.x_grid_lines %>
</g>
<g class="data-points">
<%= graph.data_points %>
</g>def x_grid_lines
traits.each_with_index.map do |trait, i|
@view.tag.line x1: xcord(i),
x2: xcord(i),
y1: top_border,
y2: bottom_border
end.join.html_safe
enddef horizontal_spacing
(right_border - left_border) /
(traits.length - 1)
end
def xcord(value)
left_border +
(value * horizontal_spacing)
endhorizontal spacing
was 119px
left border was 113px
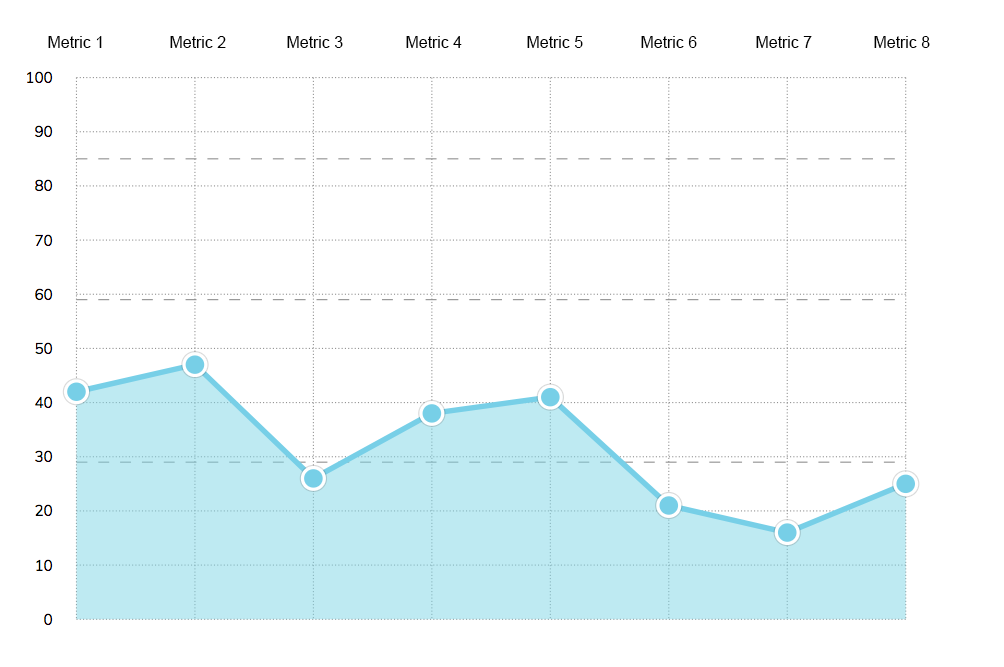
def data_points
  traits.each_with_index.map do |trait, i|

    @view.tag.circle cx: xcord(i),

                     cy: score_cord(trait),

                     r: "10"

  end.join.html_safe
end
def score_adj
vertical_spacing
/ 10.0
end
def score_cord(trait)
bottom_border -
(score_value(trait) * score_adj)
endvertical spacing
was 55px
bottom border was 596px
By RhianaH
Generating SVG graphs using Ruby Presenters