Experiments
Experiments
1 ImageNet Classification
Experiments
1 ImageNet Classification
ImageNet 2012
Experiments
1 ImageNet Classification
ImageNet 2012
- Total number of class : 1000
- Number of trained images : 1.28 million
- Number of evaluated images : 50k
- Number of test images : 100k
Experiments
1 ImageNet Classification
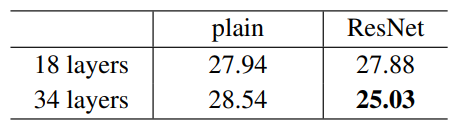
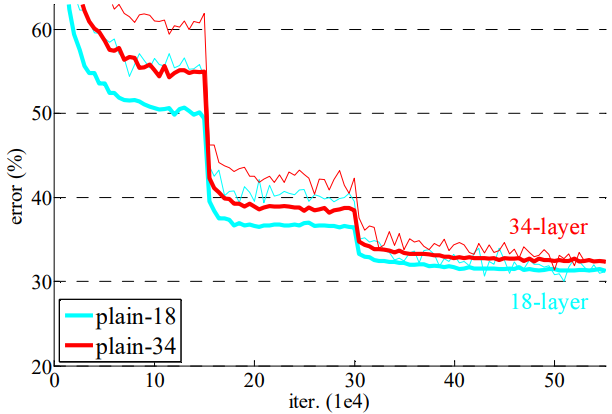
Plain Networks
Experiments
1 ImageNet Classification
Plain Networks
Experiments
1 ImageNet Classification
Plain Networks
Experiments
1 ImageNet Classification
Plain Networks
Experiments
1 ImageNet Classification
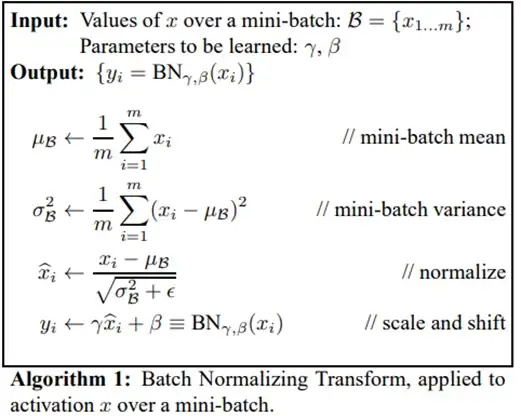
Batch Norm
Experiments
1 ImageNet Classification
Batch Norm
Experiments
1 ImageNet Classification
Experiments
1 ImageNet Classification
Experiments
1 ImageNet Classification
Experiments
1 ImageNet Classification
Experiments
1 ImageNet Classification
Model
SoftMax
Sort
Dog
Cat
Fish
Pig
Bird
.5000
.2500
.1250
.0625
.0625
Top-1
Top-5
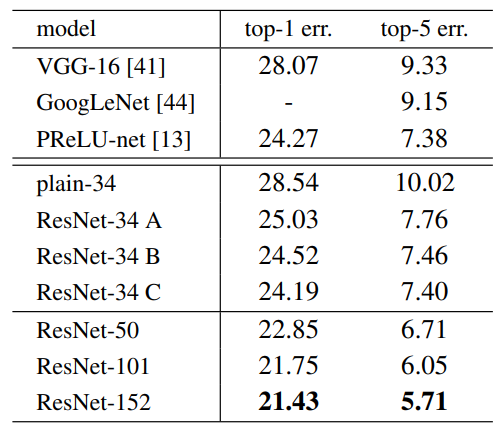
Experiments
1 ImageNet Classification
Residual Networks
Experiments
1 ImageNet Classification
Residual Networks
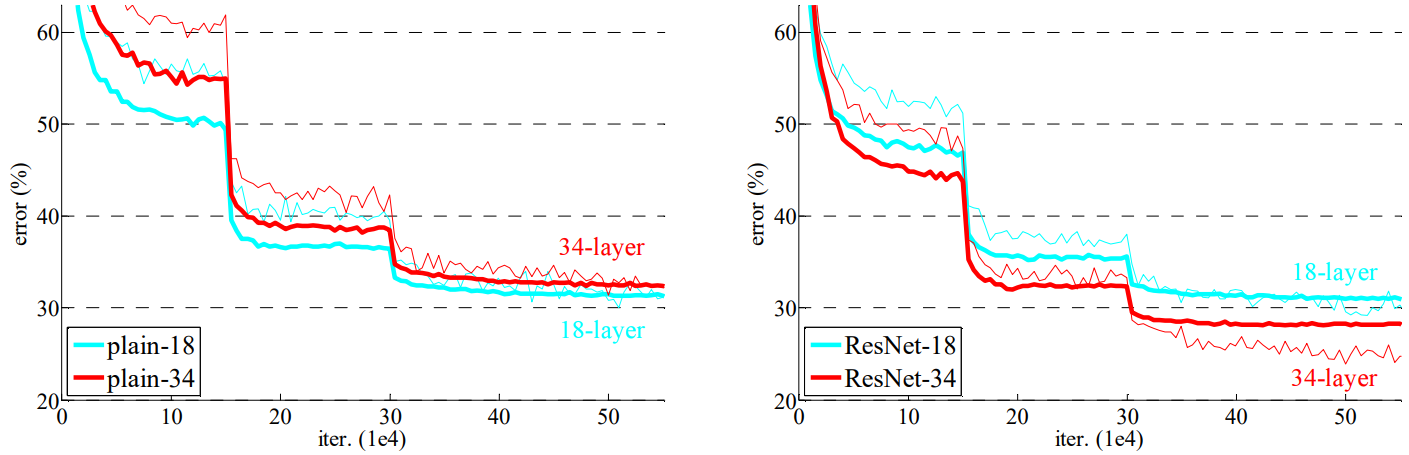
Experiments
1 ImageNet Classification
Residual Networks
Experiments
1 ImageNet Classification
Residual Networks
Theoretical Results
Theoretical Results
2 Convergence of Algorithm 1
Experiments
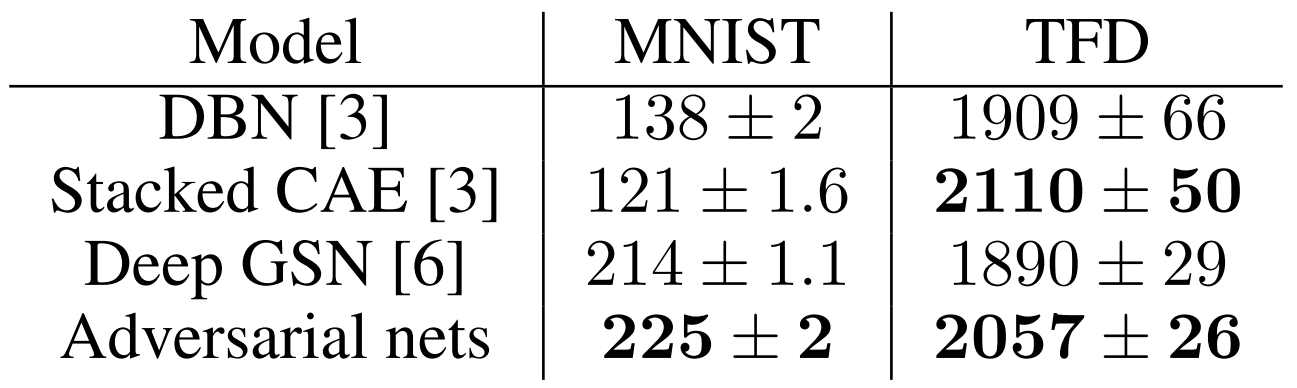
Experiments
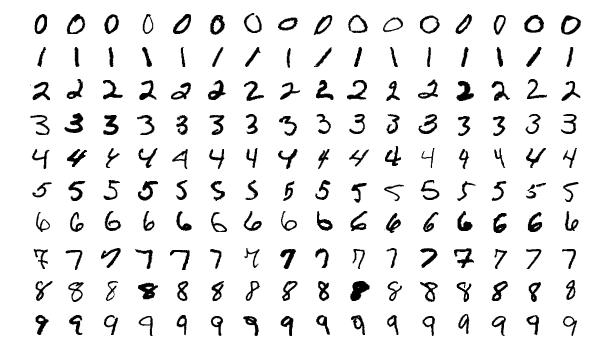
MNIST
Experiments
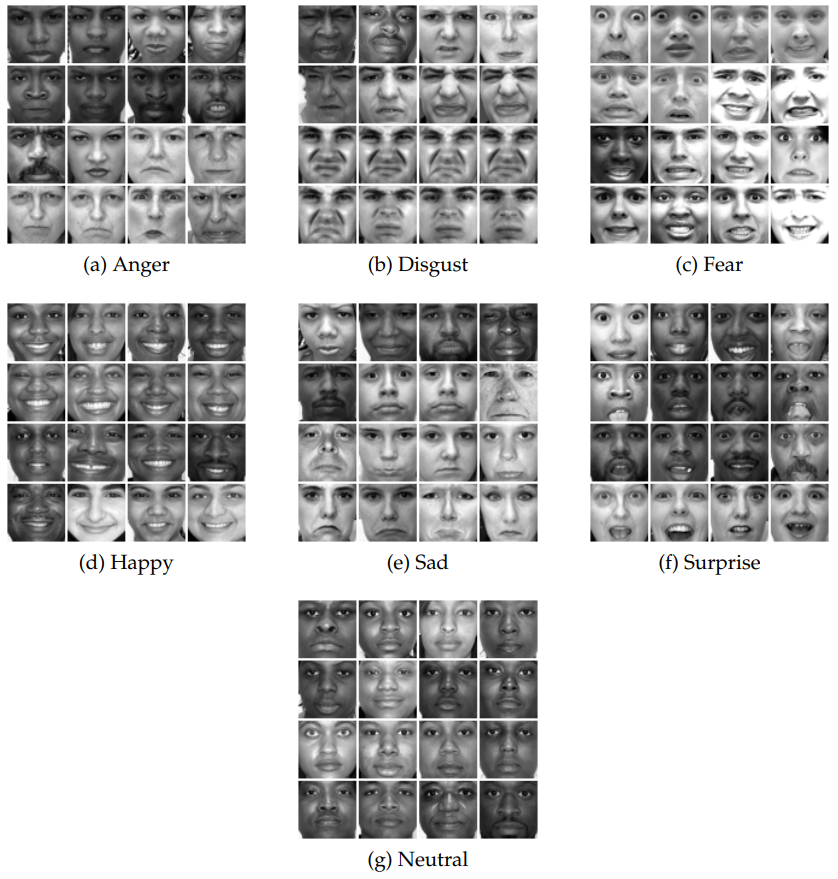
Toronto Face Database
Experiments
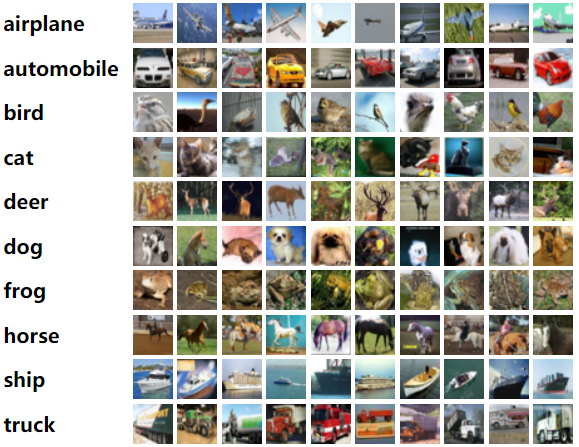
CIFAR-10
Experiments
log-likelihood
Parzen window-based
Experiments
log-likelihood
Parzen window-based
Experiments
log-likelihood
Parzen window-based
L = \frac{1}{N} \sum_{i}^{N} \log{P_G(x^i)}
\{x_1, x_2,\dots x_i\} \text{ is sample from } P_{data}
\{\hat{x}_1, \hat{x}_2,\dots \hat{x}_i\} \text{ is sample from } P_{G}
Experiments
log-likelihood
Parzen window-based
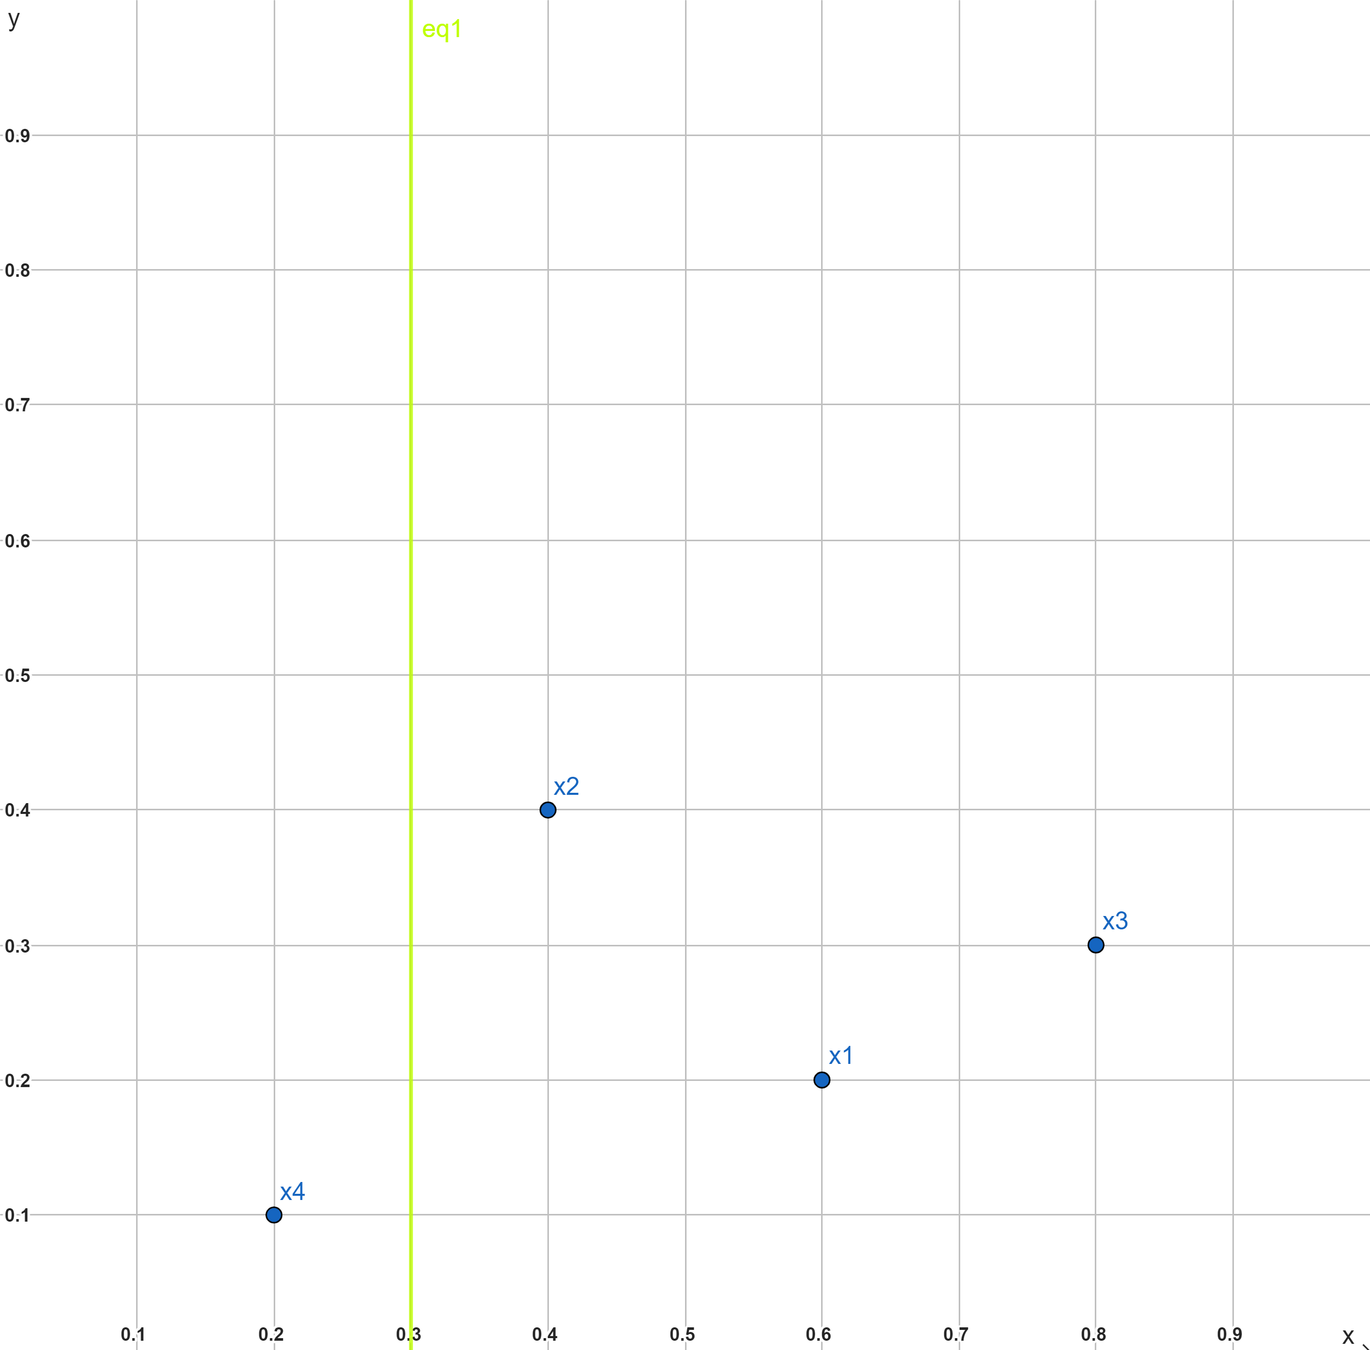
L = \frac{1}{N} \sum_{i}^{N} \log{P_G(x^i)}
P_G(\hat{x}_1)=0.2
P_G(\hat{x}_2)=0.4
P_G(\hat{x}_3)=0.3
P_G(\hat{x}_4)=0.1
Experiments
log-likelihood
Parzen window-based
L = \frac{1}{N} \sum_{i}^{N} \log{P_G(x^i)}
P_G(x_i)=[0, 1]
P_G(\hat{x}_1)=0.2
P_G(\hat{x}_2)=0.4
P_G(\hat{x}_3)=0.3
P_G(\hat{x}_4)=0.1
Experiments
log-likelihood
Parzen window-based
L = \frac{1}{N} \sum_{i}^{N} \log{P_G(x^i)}
P_G(x_i)=[0, 1]
P_G(\hat{x}_1)=0.2
P_G(\hat{x}_2)=0.4
P_G(\hat{x}_3)=0.3
P_G(\hat{x}_4)=0.1
Experiments
log-likelihood
Parzen window-based
Experiments
log-likelihood
Parzen window-based
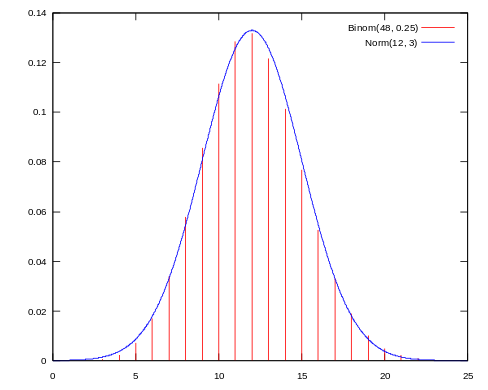
K(x)=\frac{1}{\sqrt{2\pi}} \exp (-\frac{x^2}{2})
Experiments
log-likelihood
Parzen window-based
K(x)=\frac{1}{\sqrt{2\pi}} \exp (-\frac{x^2}{2})
f_n(x)=\frac{1}{n\sigma }\sum_{n}^{i=1}K(\frac{x-\hat{x}_i}{\sigma })
Experiments
log-likelihood
Parzen window-based
f_n(x)=\frac{1}{n\sigma }\sum_{n}^{i=1}K(\frac{x-\hat{x}_i}{\sigma })
K(x)=\frac{1}{\sqrt{2\pi}} \exp (-\frac{x^2}{2})
\sigma =1
Experiments
log-likelihood
Parzen window-based
f_n(x)=\frac{1}{n\sigma }\sum_{n}^{i=1}K(\frac{x-\hat{x}_i}{\sigma })
\sigma=1
K(x)=\frac{1}{\sqrt{2\pi}} \exp (-\frac{x^2}{2})
\sigma =10
cross_val on val_set
Experiments
Visualization of samples from the model
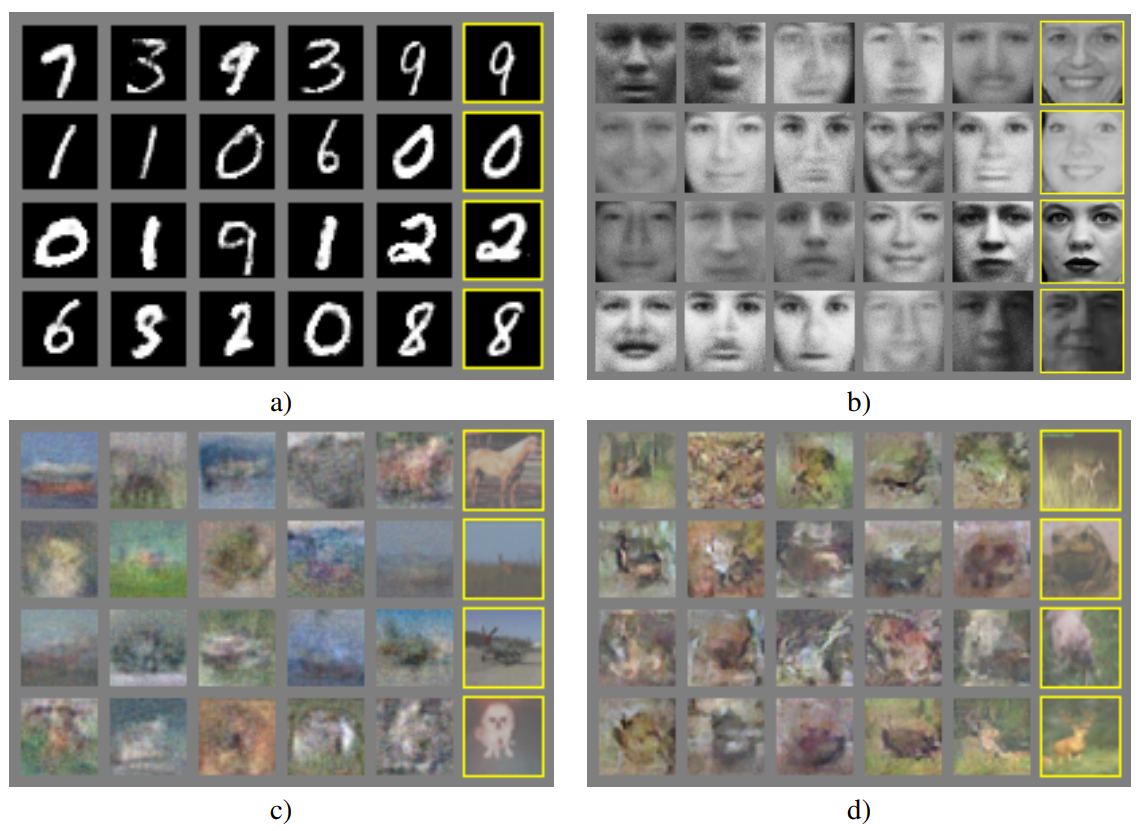
Experiments
Visualization of samples from the model

Experiments
Visualization of samples from the model
z_a
z_b
Experiments
Visualization of samples from the model
z_a
z_b
linearly interpolating
Experiments
Visualization of samples from the model
z_a
z_b
Experiments
Experiments
1 SETUP
Experiments
1 SETUP
Pre-train Data Set
Image net 2012 1k calss 1.3M
Image net 21k 21k class 14M
JFT 18k classes 303 M
Experiments
1 SETUP
CIFAR-10/100
Oxford-IIIT Pets, Oxford-IIIT Flowers
ImageNet original val_labels & cleaned-up ReaL labels
Fine-tune Data Set
Experiments
1 SETUP
VTAB
Natural
Oxford-IIIT Pet
Small NORB
102 Flower
Caltech101
CIFAR-100
SUN397
SVHN
DTD
Specialized
Diabetic Rethinopathy
EuroSAT
PCam
Structured
Dmlab Frames
Resisc45
dSprites
CLEVR
KITTI
Experiments
1 SETUP
Data Pre-Processing
Experiments
1 SETUP
Data Pre-Processing
Experiments
1 SETUP
Data Pre-Processing
Experiments
1 SETUP
Data Pre-Processing
Experiments
1 SETUP
Data Pre-Processing
random chiose
Experiments
1 SETUP
Model Variants
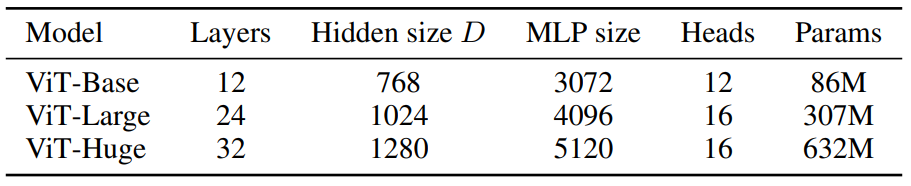
BERT
ViT
(Patch_{size}^{2})^{-1} \propto Complexity \Leftarrow
Experiments
1 SETUP
Model Variants
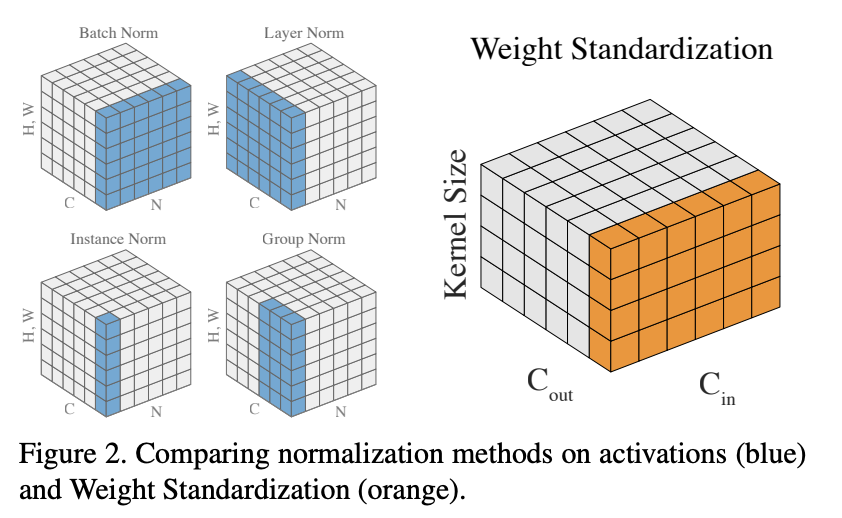
GN
WS
Experiments
2 COMPARISON TO SOTA
Experiments
2 COMPARISON TO SOTA
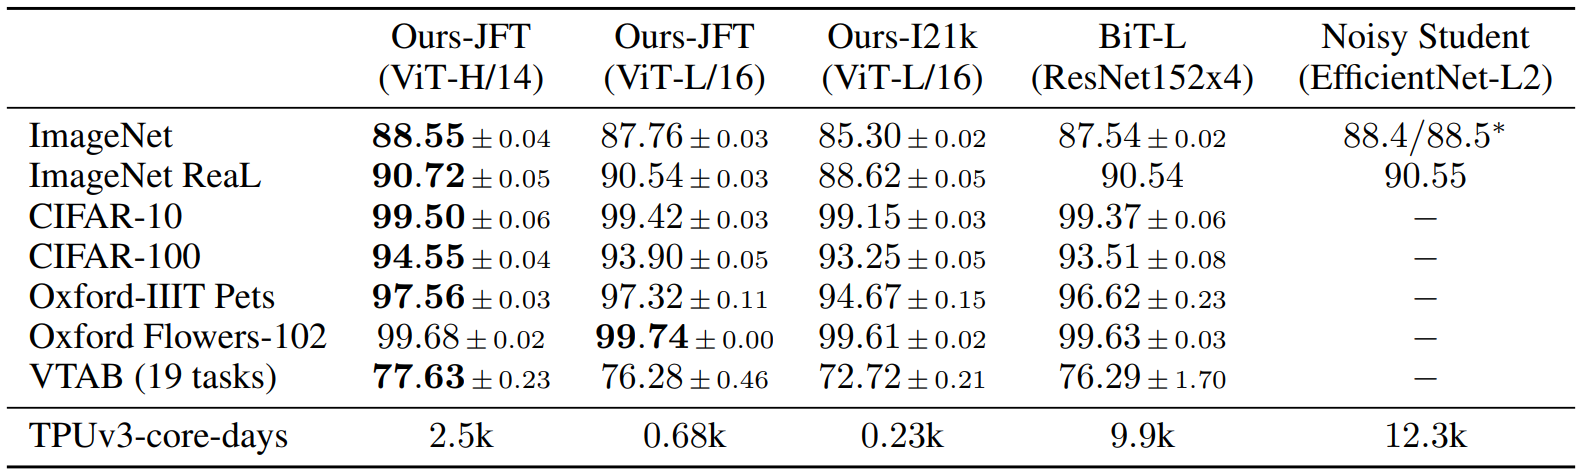
Experiments
2 COMPARISON TO SOTA
2 \text{useTPUcores} \times traingTime_{days}
Experiments
2 COMPARISON TO SOTA
2 \text{useTPUcores} \times traingTime_{hour}
Experiments
2 COMPARISON TO SOTA
Previous
2 \text{useTPUcores} \times traingTime_{hour}
Experiments
2 COMPARISON TO SOTA
Previous
2 \text{useTPUcores} \times traingTime_{hour}
JFT
Experiments
2 COMPARISON TO SOTA
Previous
2 \text{useTPUcores} \times traingTime_{hour}
JFT
same dataset
Experiments
2 COMPARISON TO SOTA
Previous
2 \text{useTPUcores} \times traingTime_{hour}
JFT
Experiments
2 COMPARISON TO SOTA
Previous
2 \text{useTPUcores} \times traingTime_{hour}
Experiments
2 COMPARISON TO SOTA
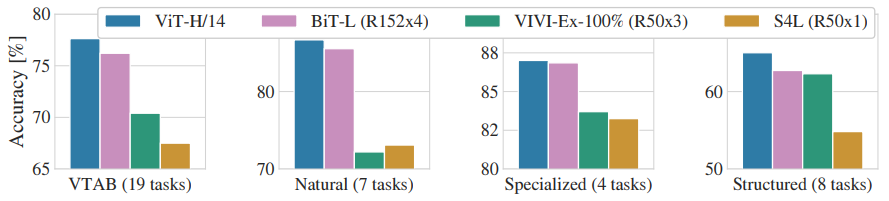
all
By r oger


