


Rob Purser
Development Manager for IoT and Hardware Interfacing for MATLAB at MathWorks. Leads the creation of software that connects MATLAB with the real world
Most IoT data are not used currently. For example, only 1 percent of data from an oil rig with 30,000 sensors is examined.
-- McKinsey & Company
MATLAB: High-level language and interactive environment
Simulink: Block diagram environment for simulation and design. Simulate, generate code, and verify embedded systems
ThingSpeak: Free web service for storing sensor data and developing IoT applications
Tide Prediction - Online Analytics
Nighttime Noise - Historical Analytics
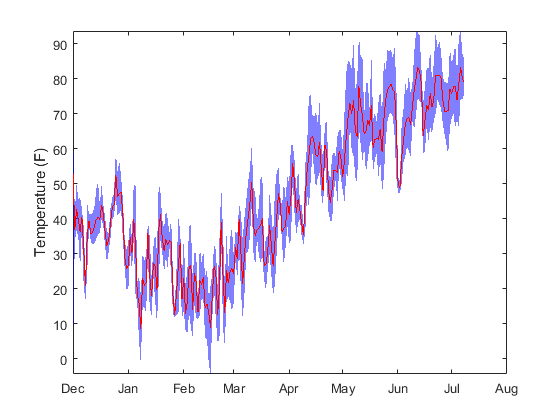
Weather - IoT Analytic Workflow
Counting Cars - Edge Node Analytics
Tide Prediction - Online Analytics
Nighttime Noise - Historical Analytics
Weather - IoT Analytic Workflow
Counting Cars - Edge Node Analytics
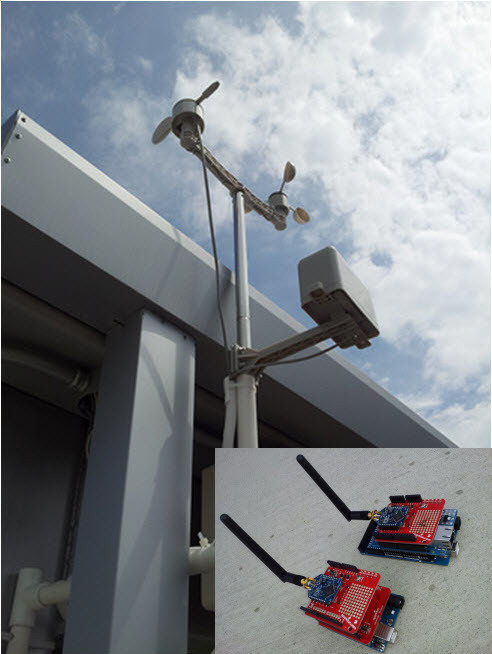
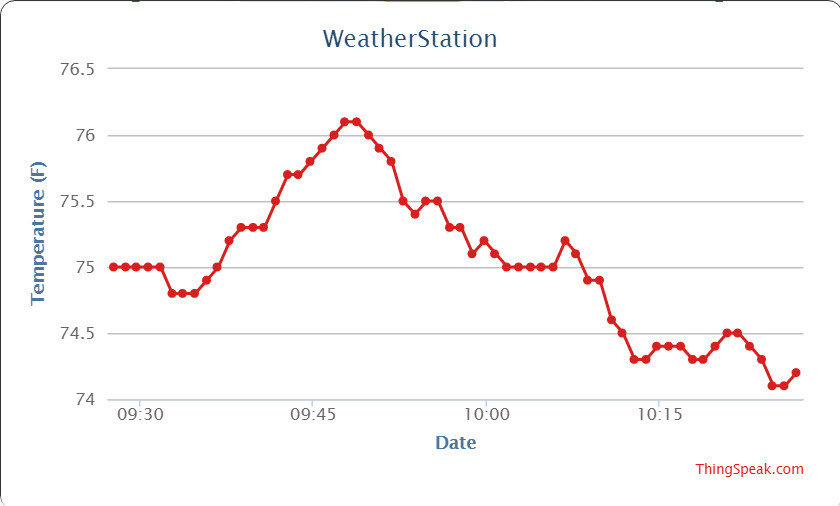
MathWorks Weather Station -- Revisited
Classic IoT Maker Project with Machine Learning
Deep Dive: Google "mathworks weather revisit"
1
2
3
Tide Prediction - Online Analytics
Nighttime Noise - Historical Analytics
Weather - IoT Analytic Workflow
Counting Cars - Edge Node Analytics
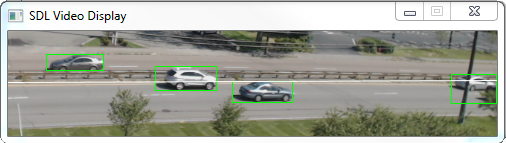
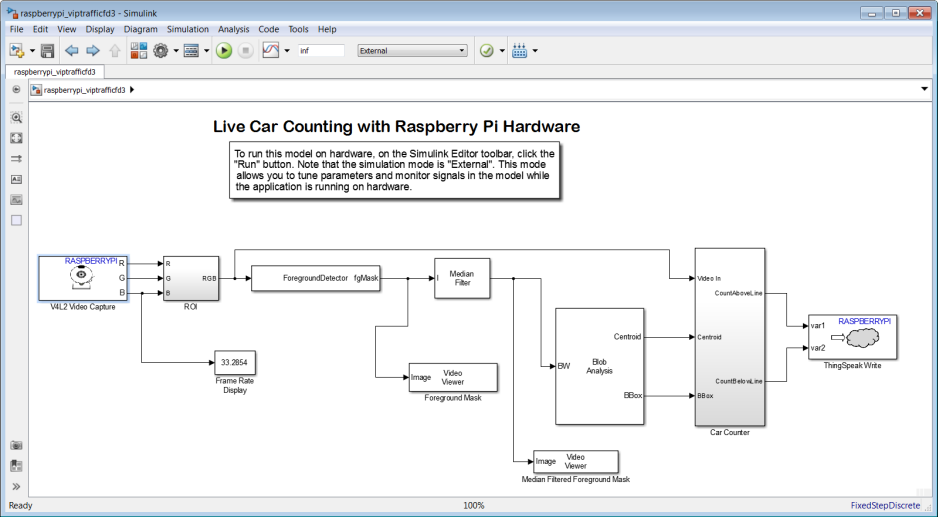
Goal: Build a traffic monitor using a Raspberry Pi & Webcam
Counting Cars
Traffic monitor using a Raspberry Pi & Webcam
Deep Dive: Google "count cars thingspeak"
Counting Cars
Traffic monitor using a Raspberry Pi & Webcam
Deep Dive: Google "count cars thingspeak"
Embedded devices have always used:
Powerful mobile processors enable:
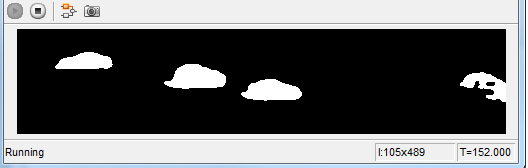
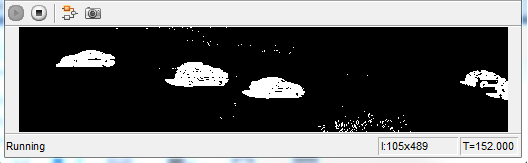
Foreground Detection, 2-D Median Filter, Blob Analysis
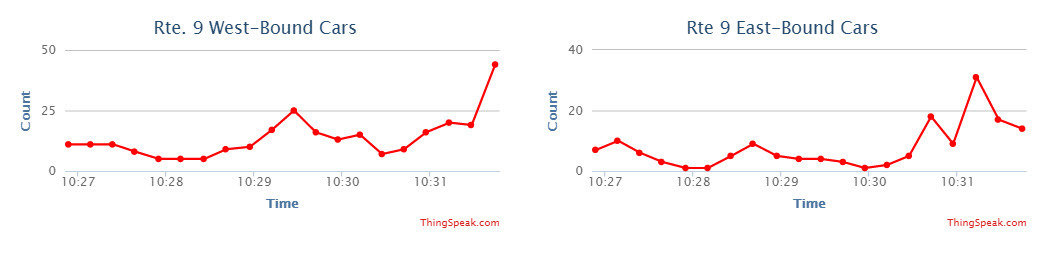
Feeds custom counting block and Transmit to ThingSpeak
Foreground Detection, 2-D Median Filter, Blob Analysis
Feeds custom counting block and Transmit to ThingSpeak
Foreground Detection, 2-D Median Filter, Blob Analysis
Feeds custom counting block and Transmit to ThingSpeak
Foreground Detection, 2-D Median Filter, Blob Analysis
Feeds custom counting block and Transmit to ThingSpeak
Foreground Detection, 2-D Median Filter, Blob Analysis
Feeds custom counting block and Transmit to ThingSpeak
Foreground Detection, 2-D Median Filter, Blob Analysis
Feeds custom counting block and Transmit to ThingSpeak
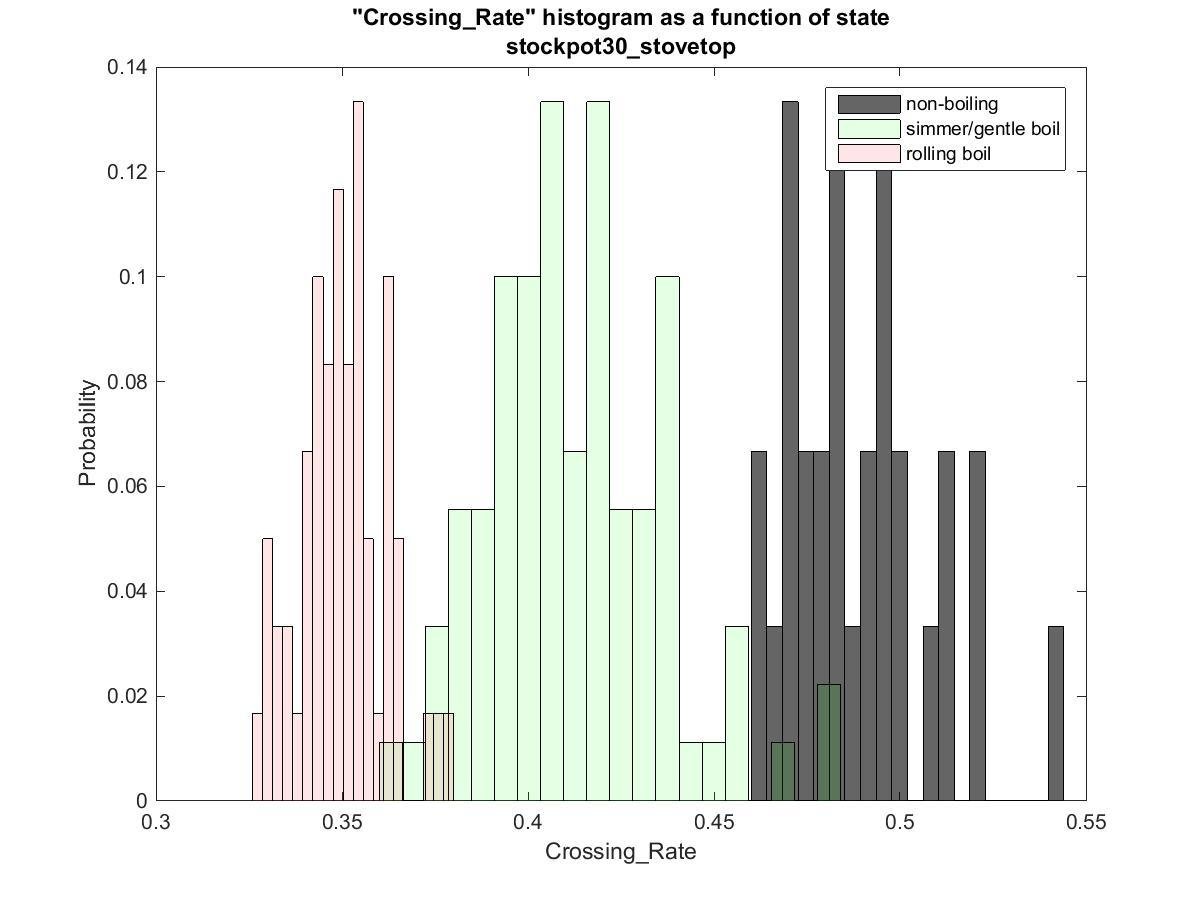
Want a deeper dive? Freescale Smart Stovetop
Using machine learning in embedded applications
Source: Freescale
Embedded devices now have enough compute power to use algorithms that previously were once only practical on desktop class machines or FPGAs
Tide Prediction - Online Analytics
Nighttime Noise - Historical Analytics
Weather - IoT Analytic Workflow
Counting Cars - Edge Node Analytics
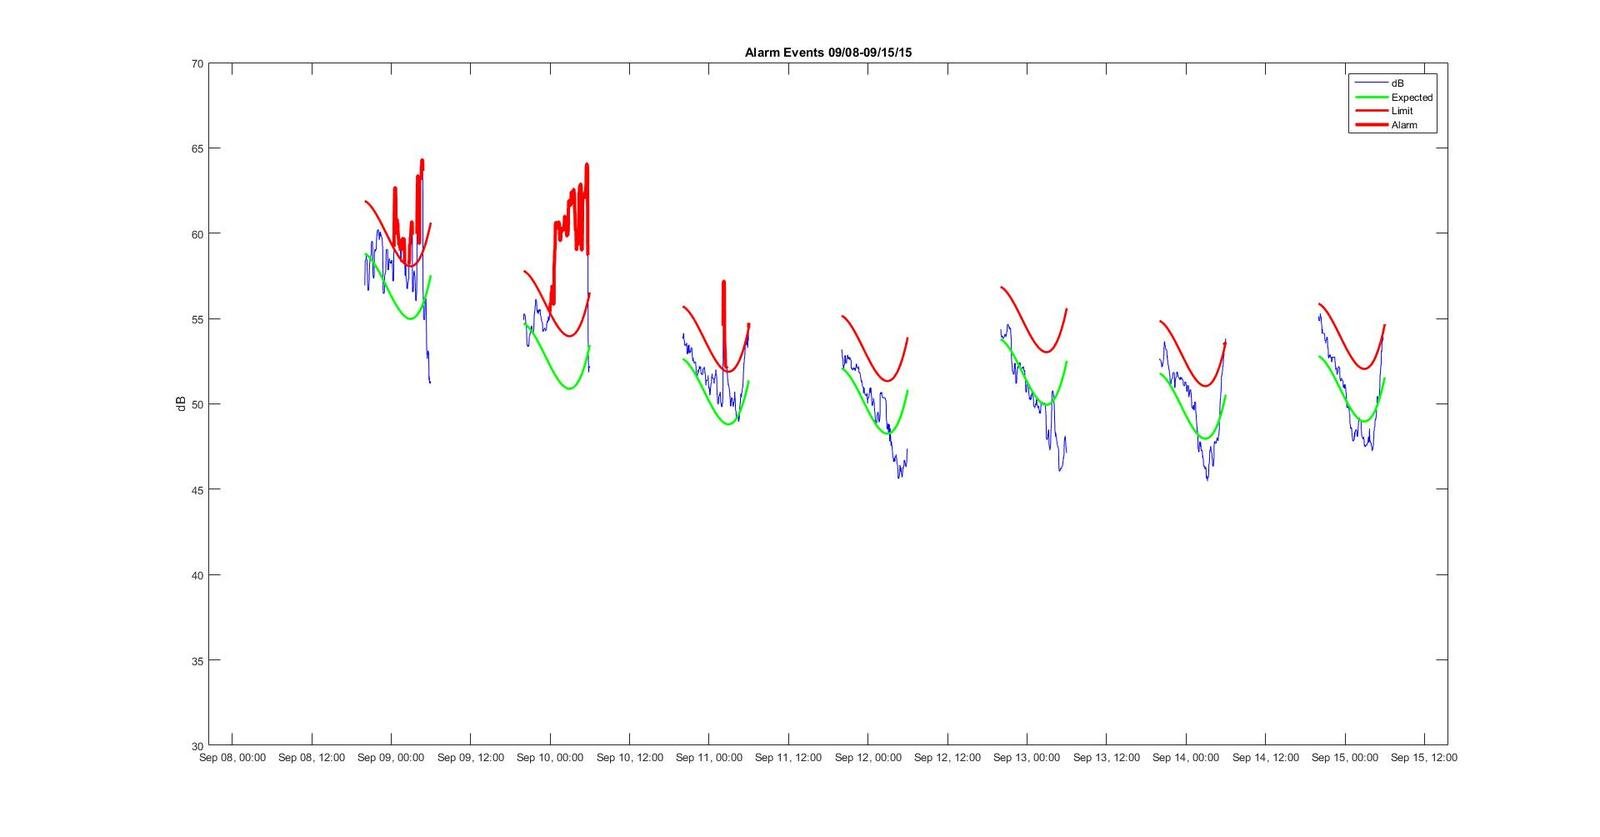
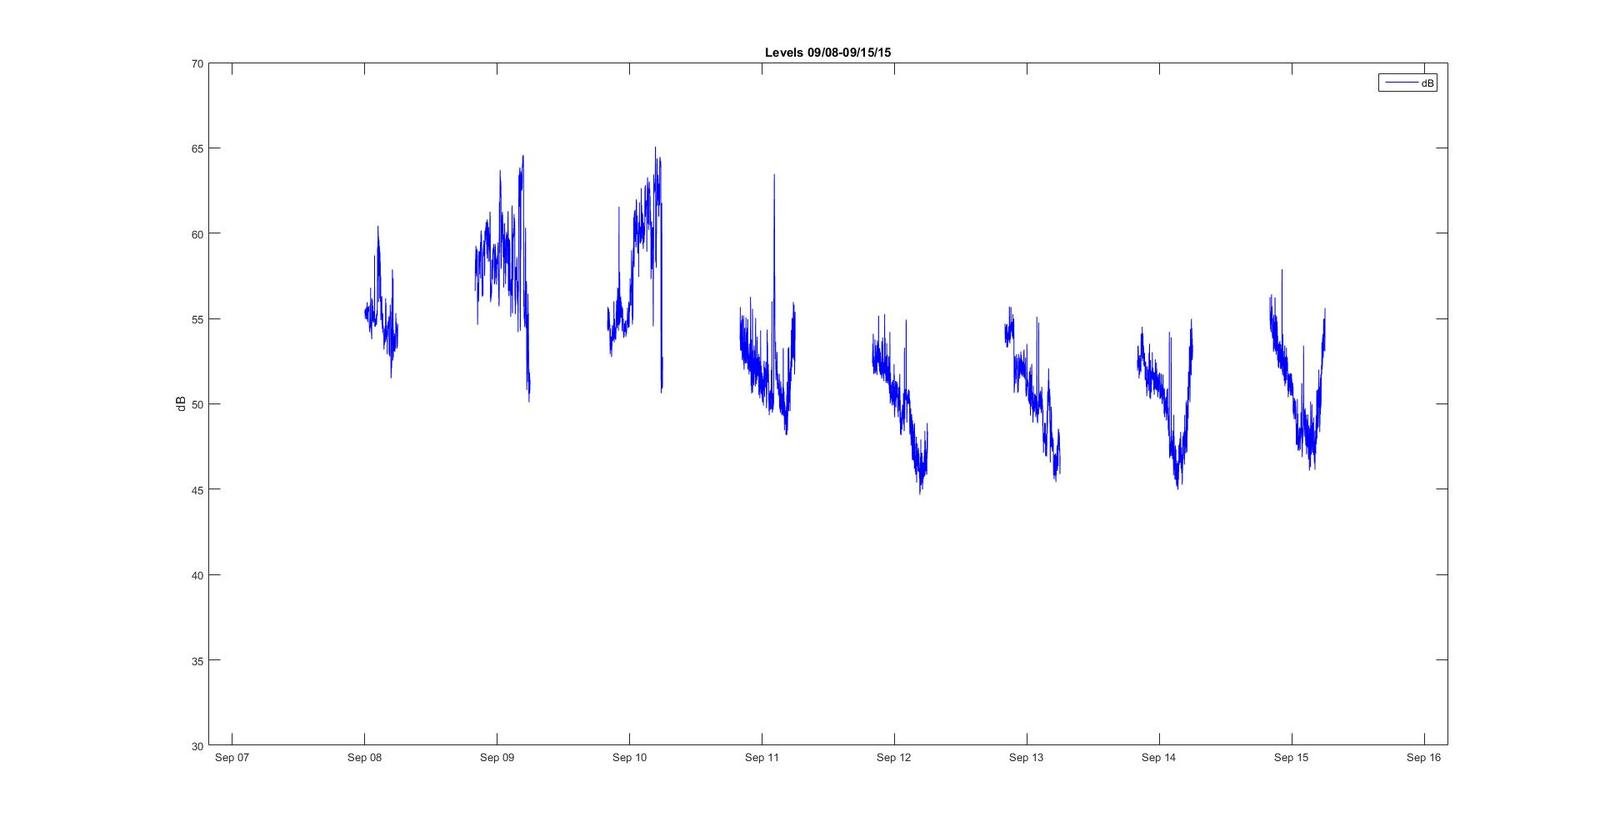
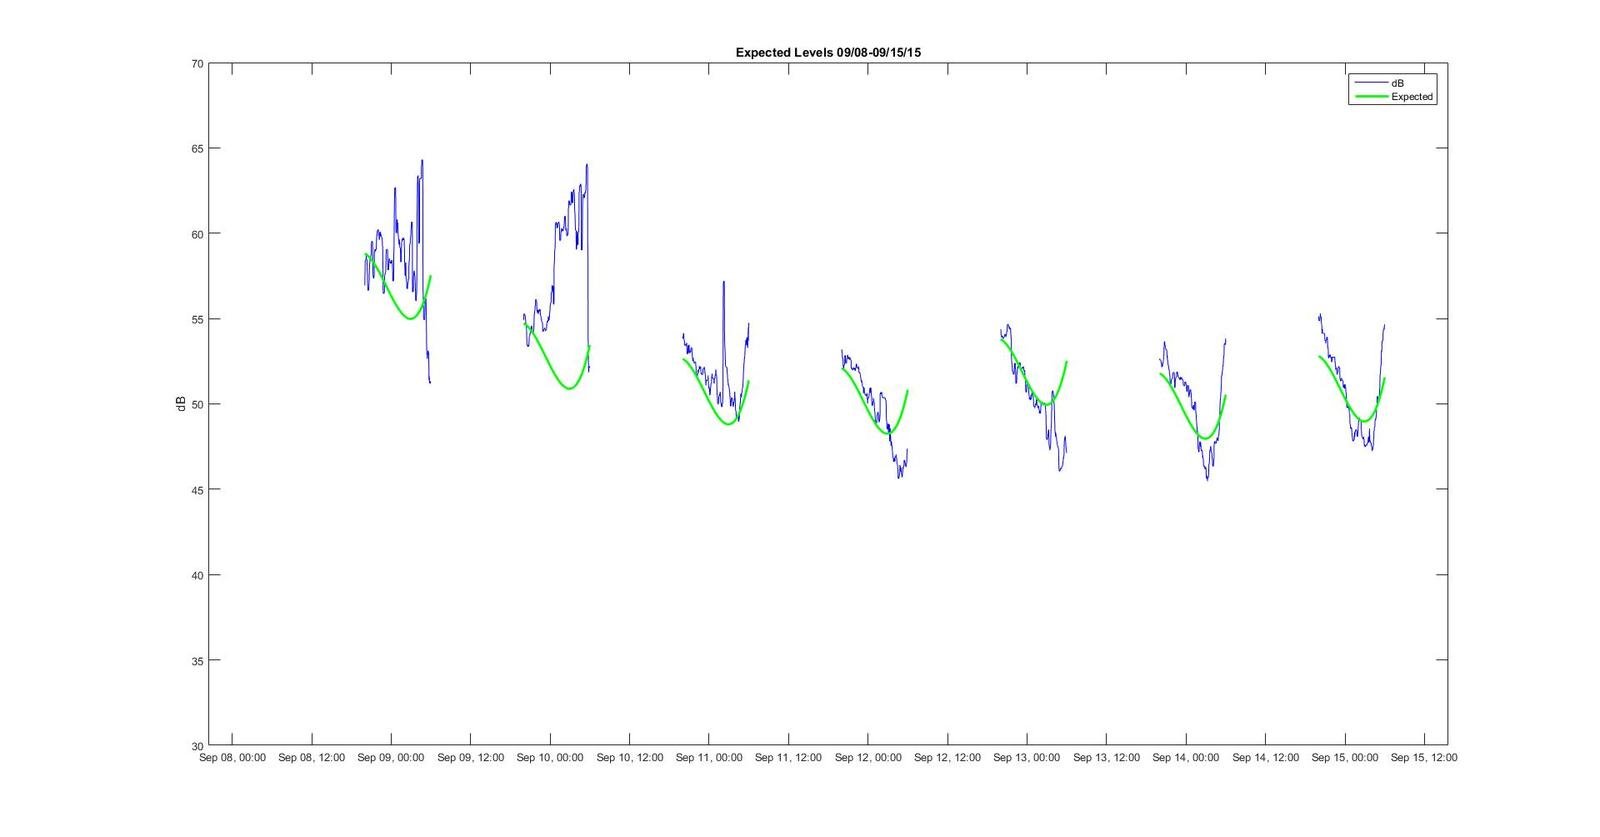
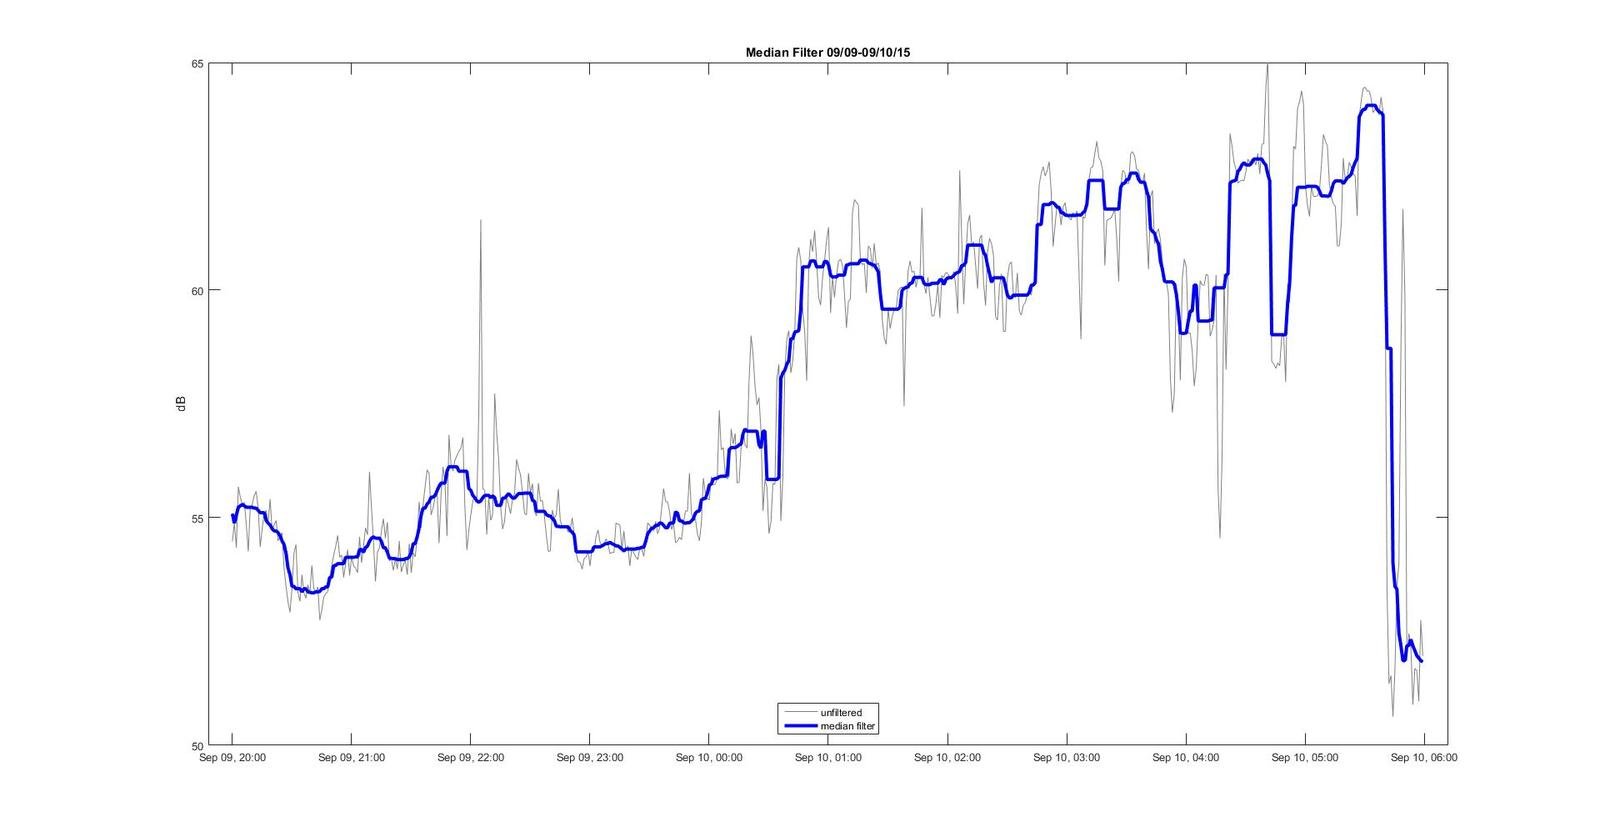
Night Noise Analysis
Identify unusual changes in ambient noise level at night
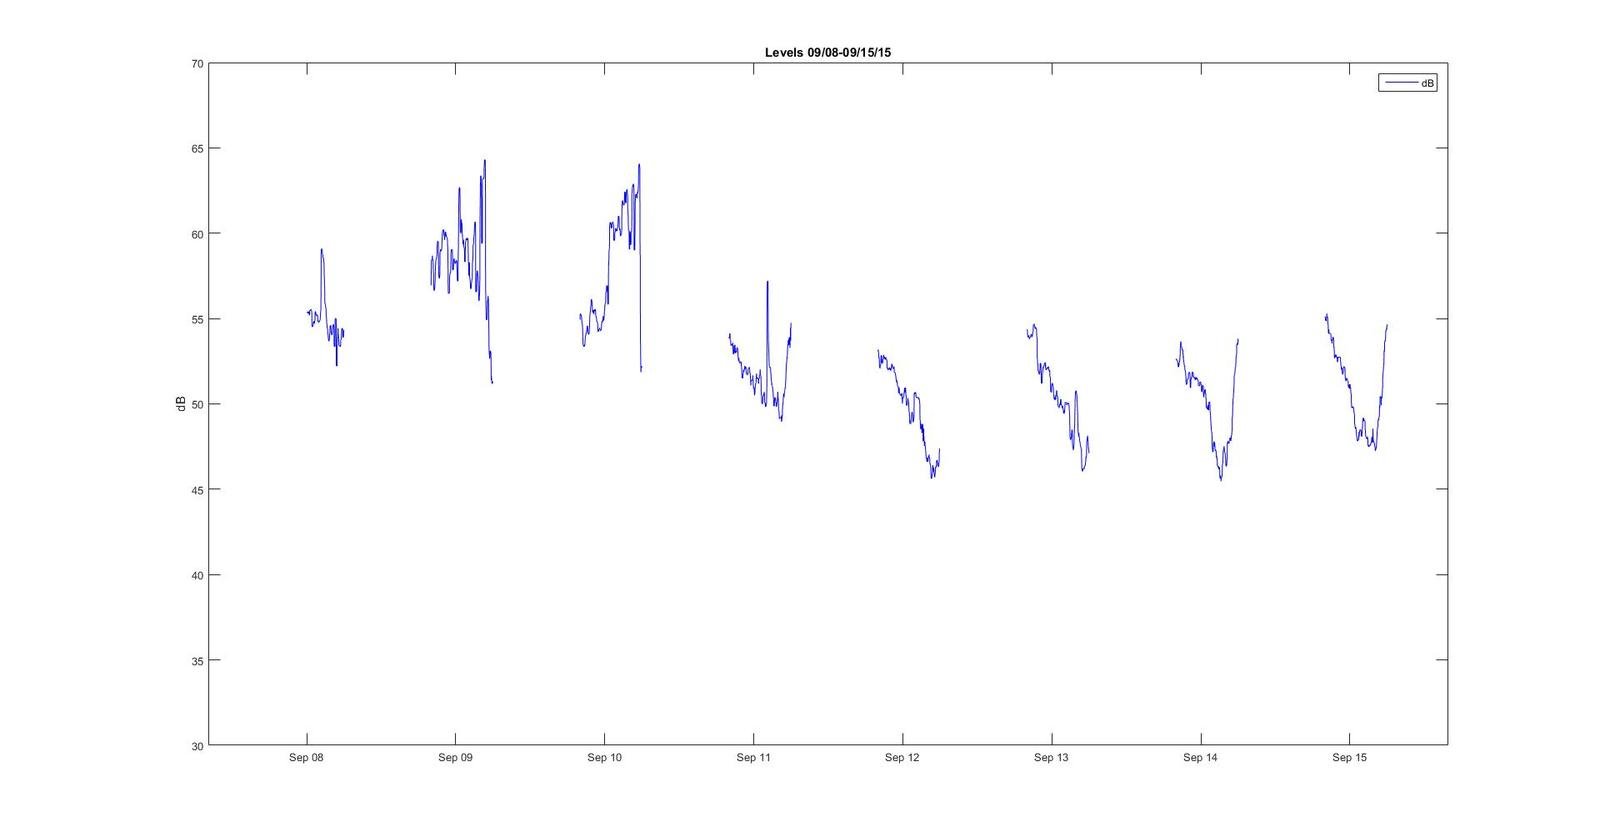
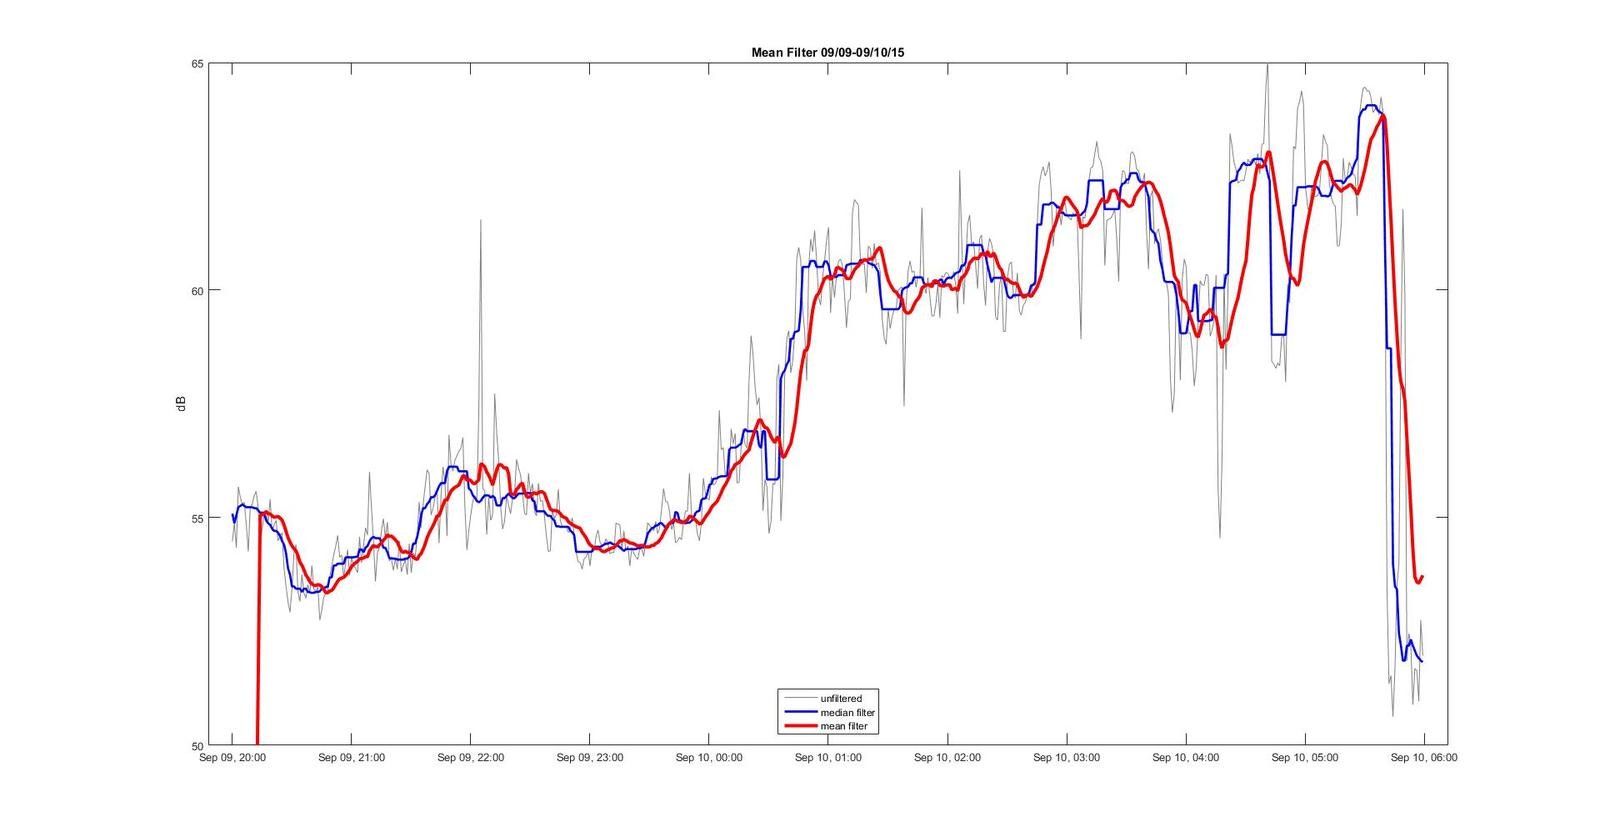
Median Filter
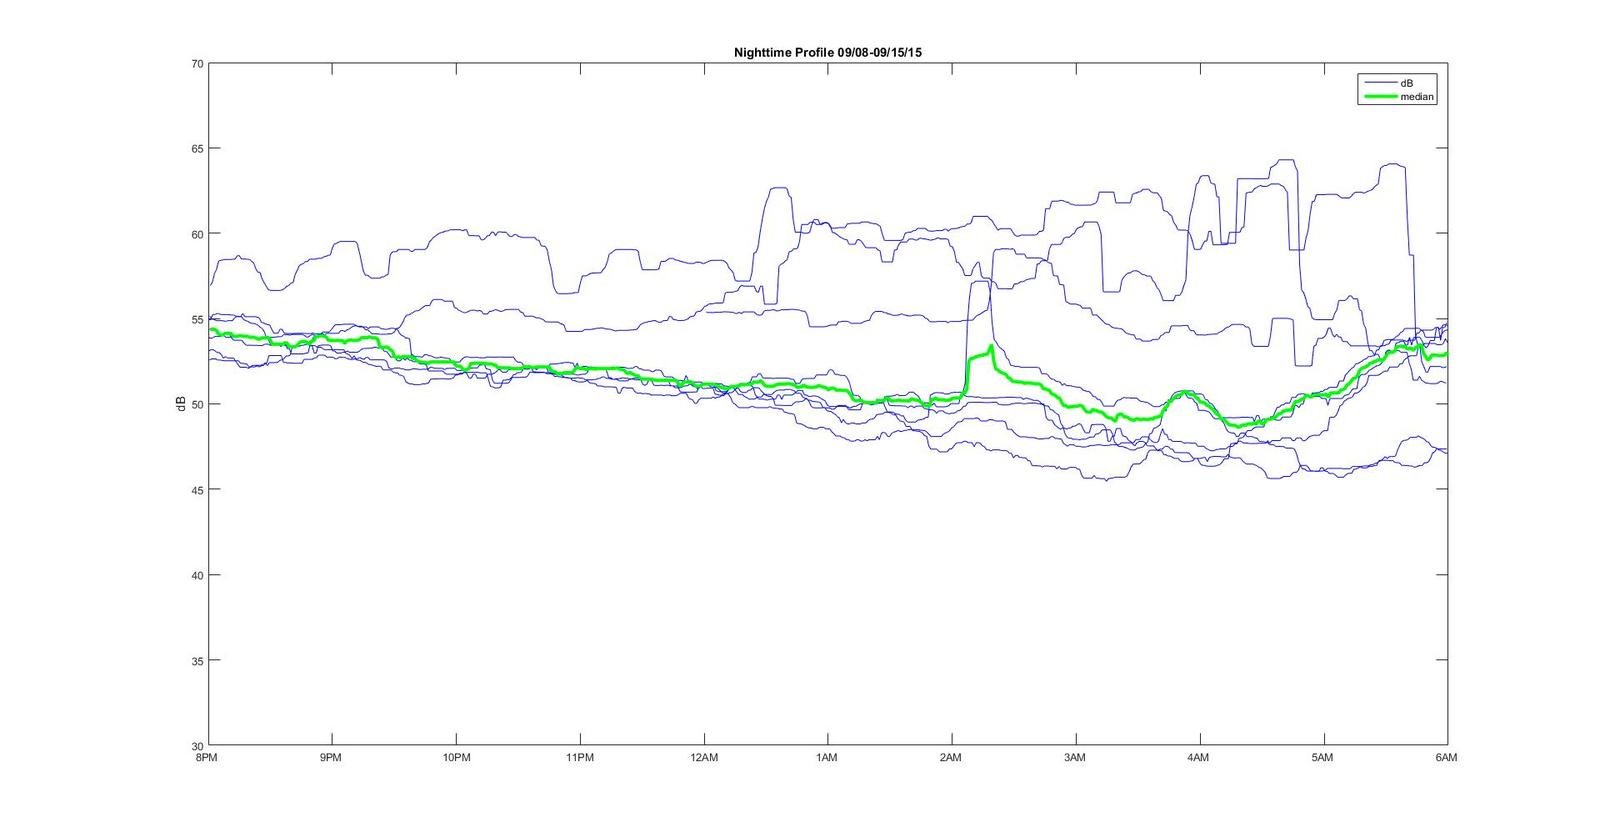
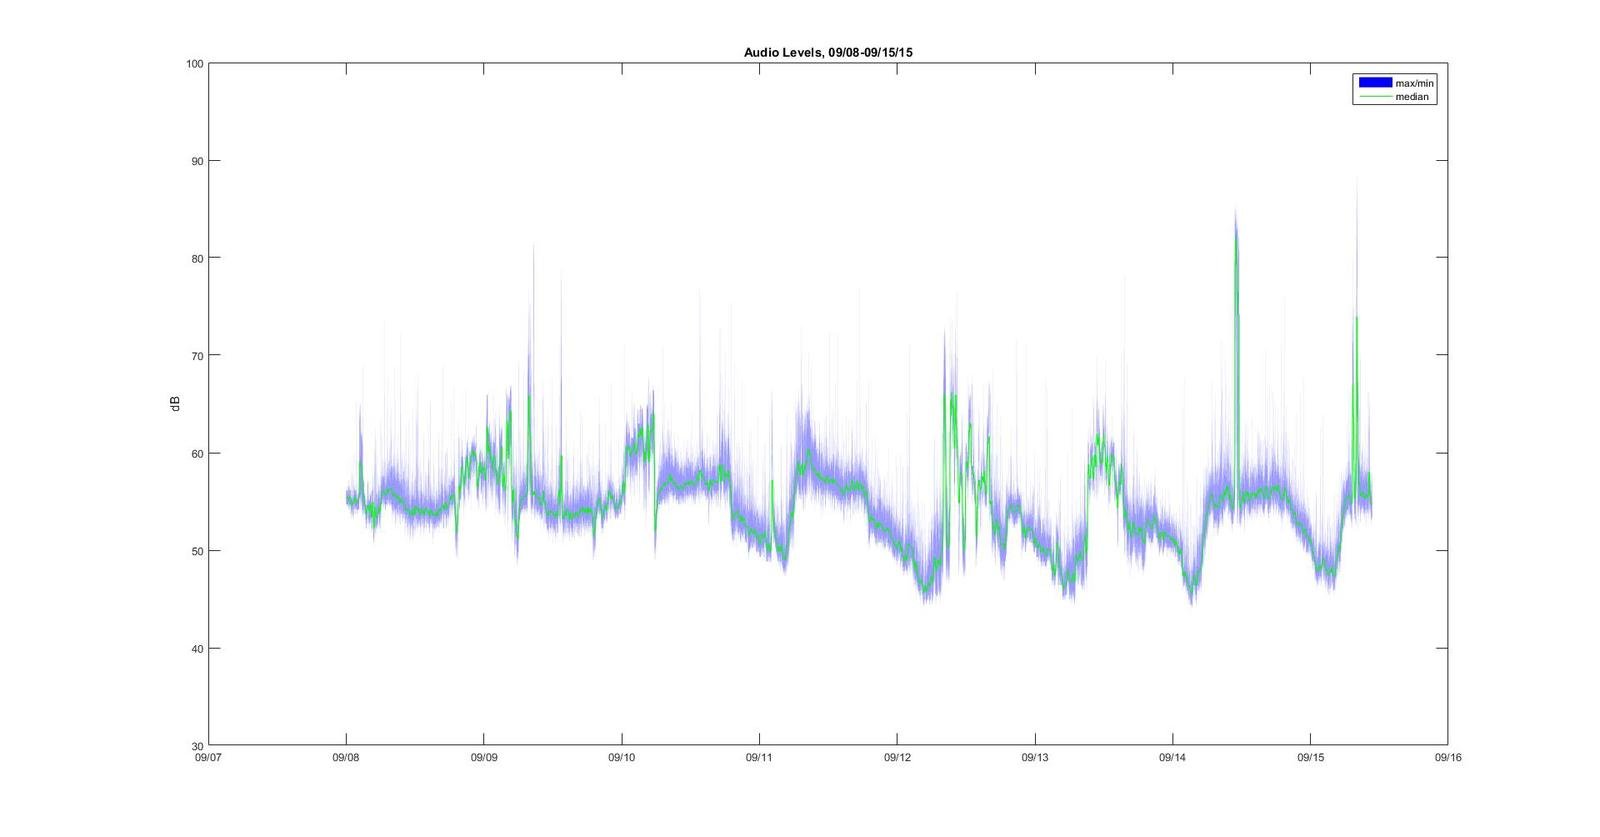
Overlaid with Expected Levels
Determined expected based on median at a given time
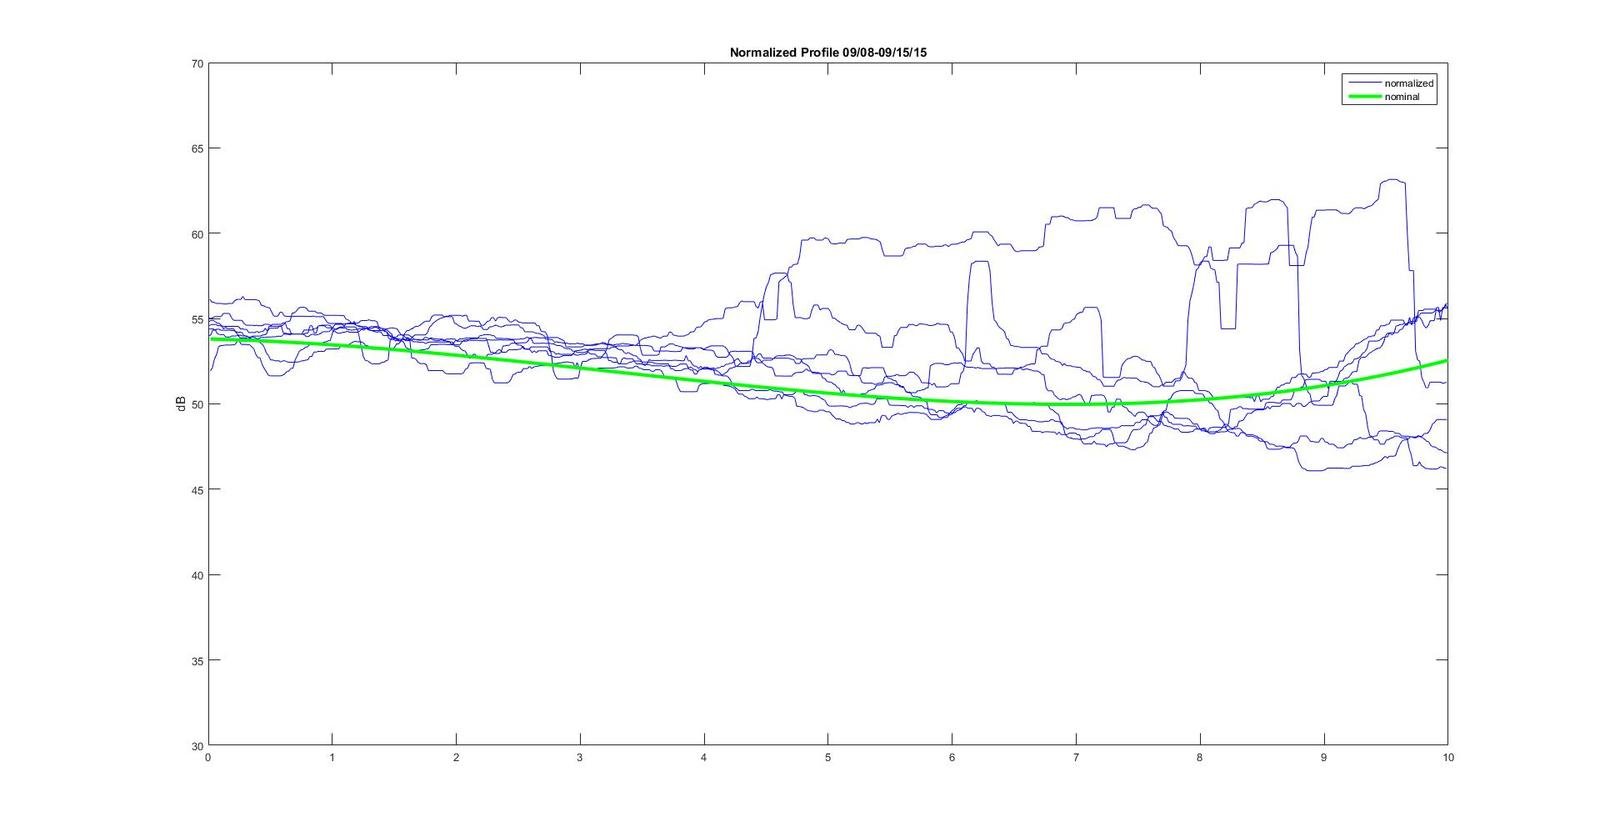
Normalized based on first 3 hours
Polynomial fit of expected noise levels
Set Expected Levels for a given night
Move polynomial up or down to compensate for variation
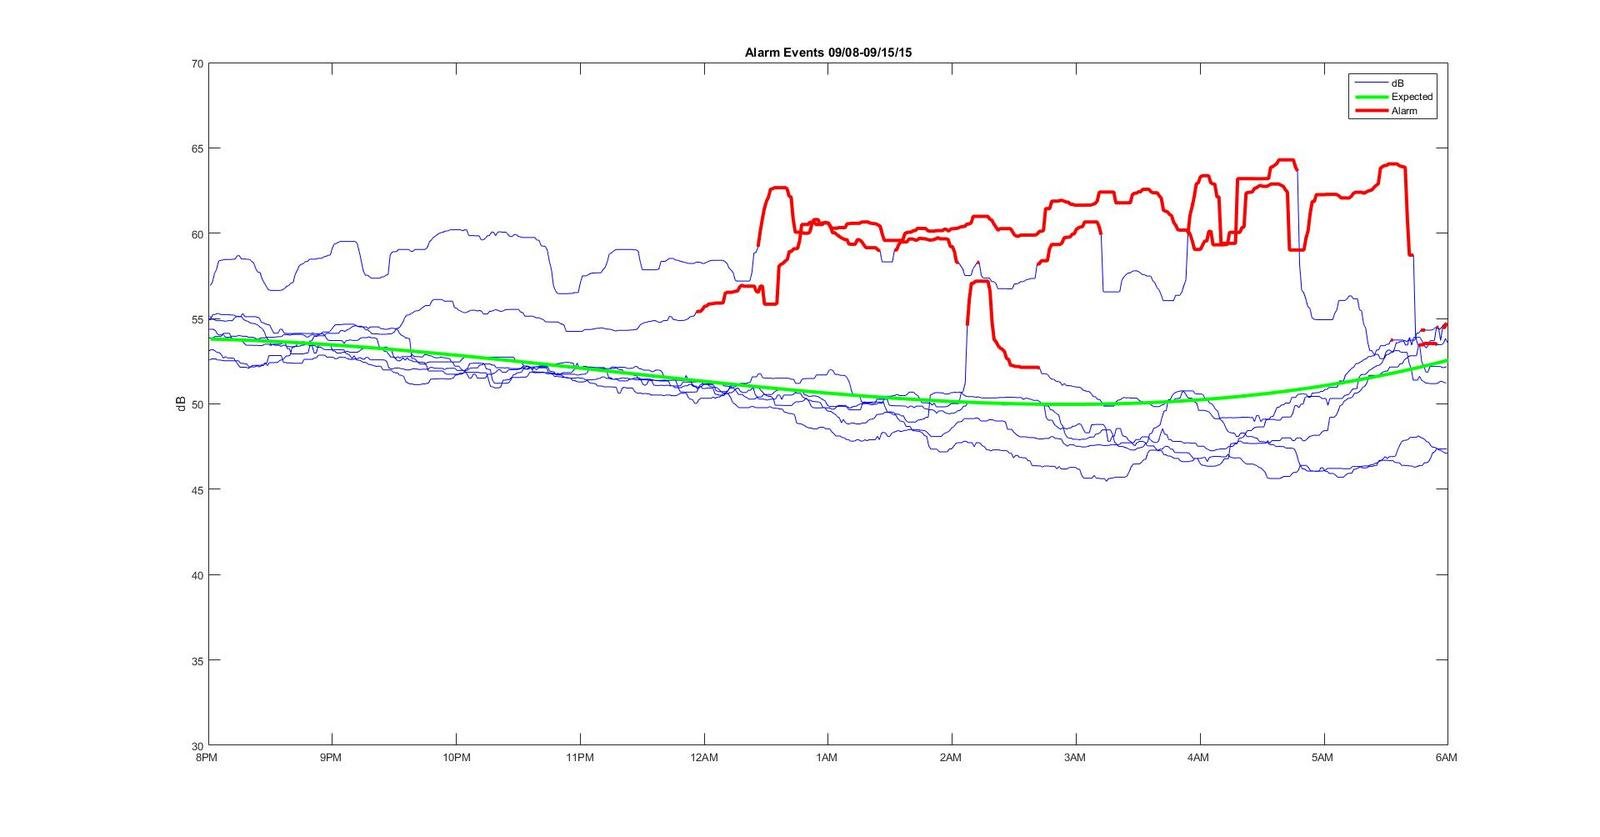
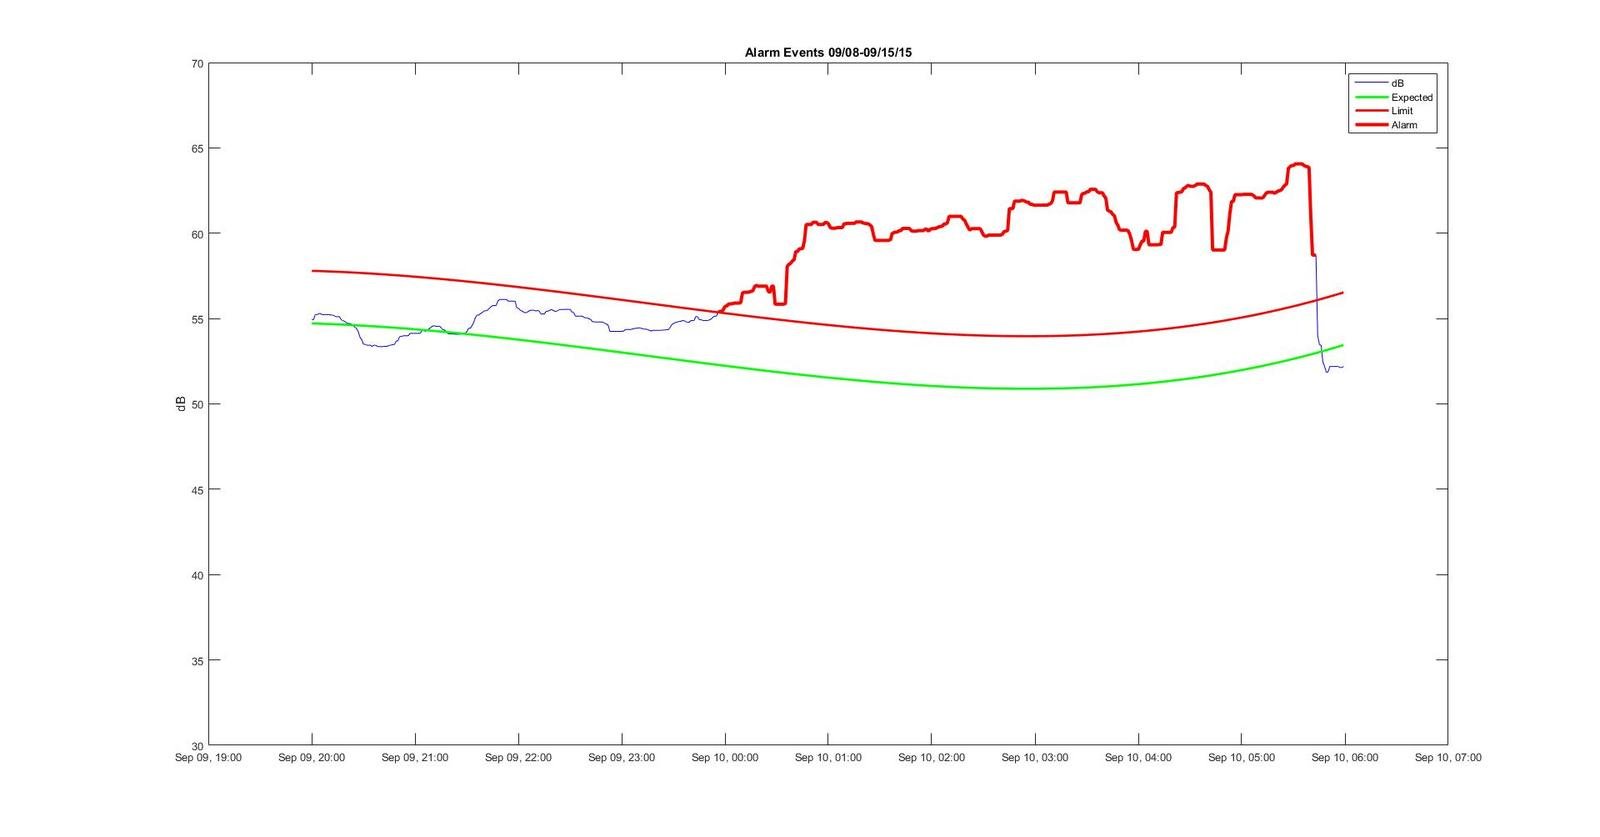
Identify alarm conditions
> 1 std deviation above expected
Identify alarm conditions
> 1 std deviation above expected
To do: Investigate what happened on September 10th...
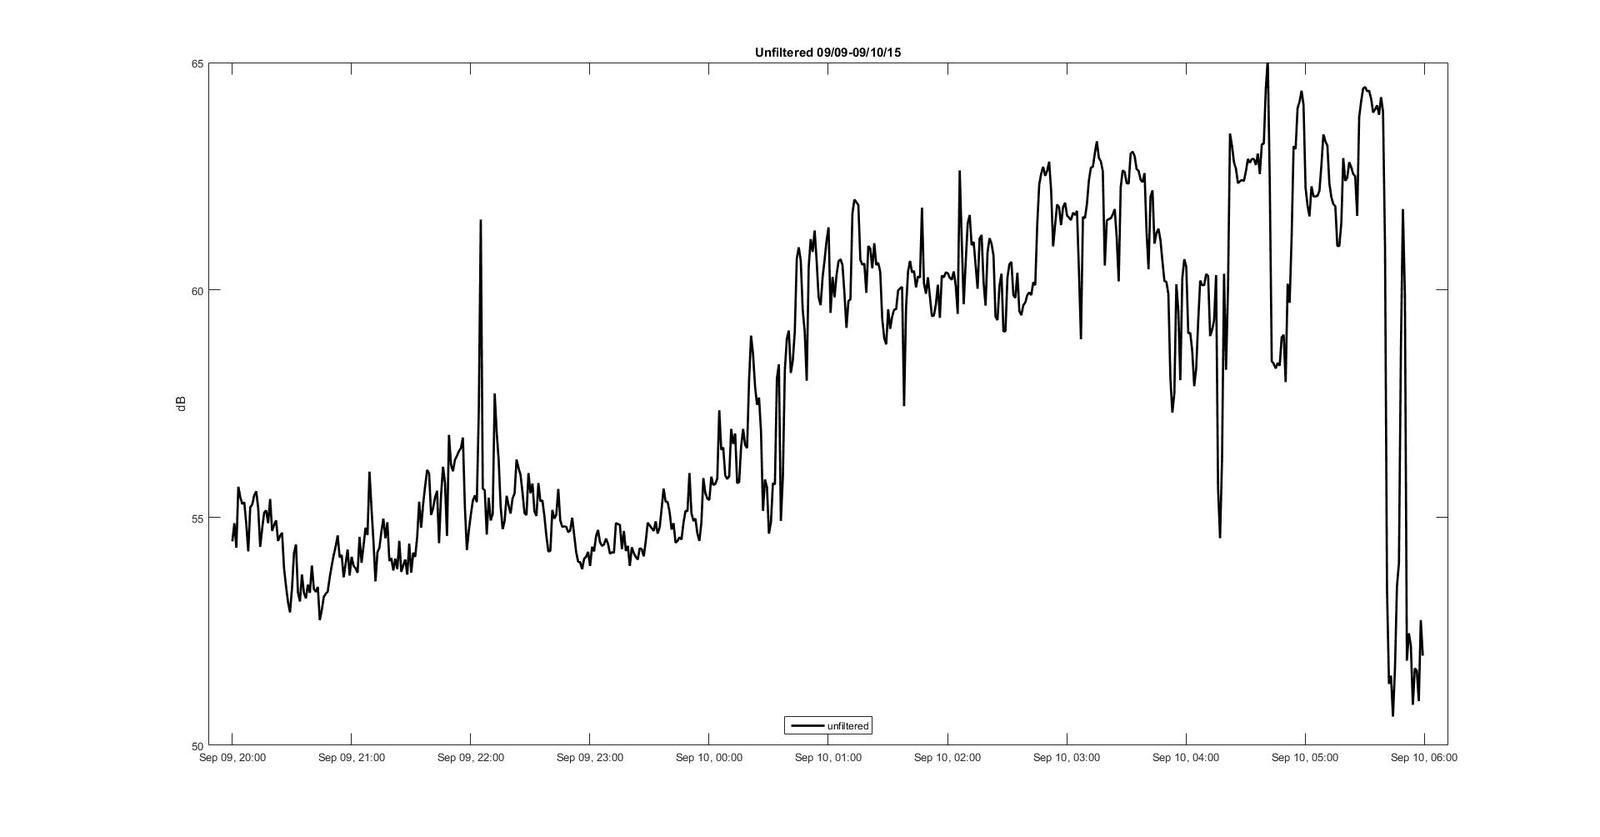
Raw data from a single night
Windowed median filter with 15 minute window
Contrast with mean filter with same window
Things to keep in mind:
Tide Prediction - Online Analytics
Nighttime Noise - Historical Analytics
Weather - IoT Analytic Workflow
Counting Cars - Edge Node Analytics
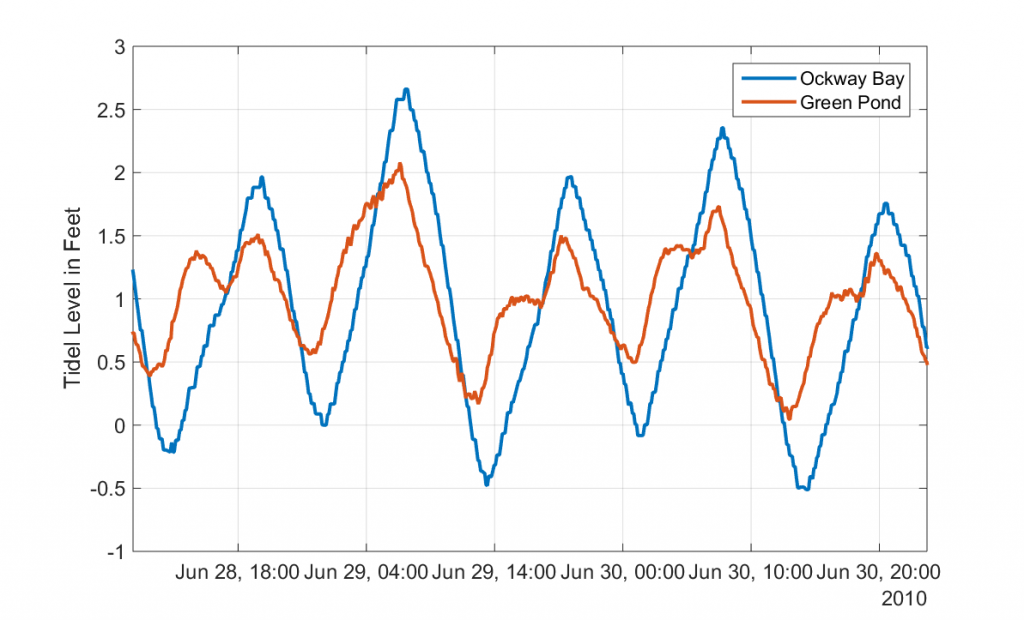
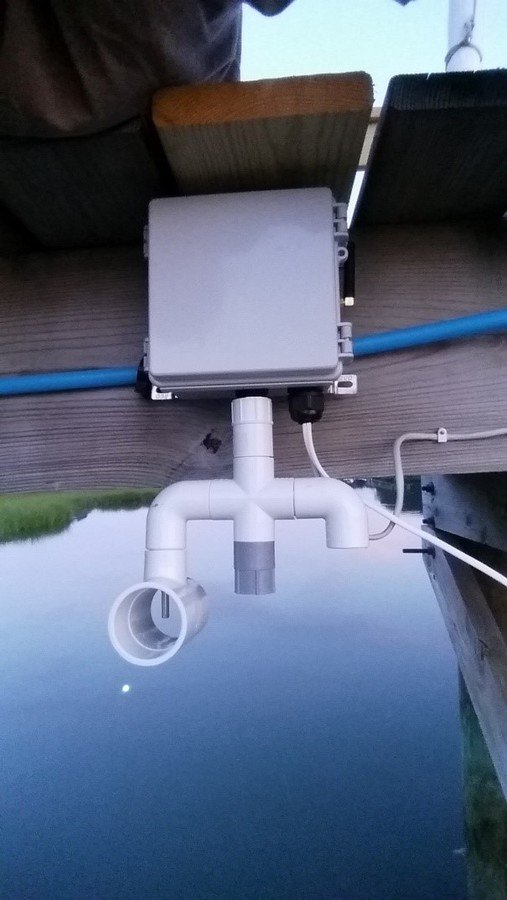
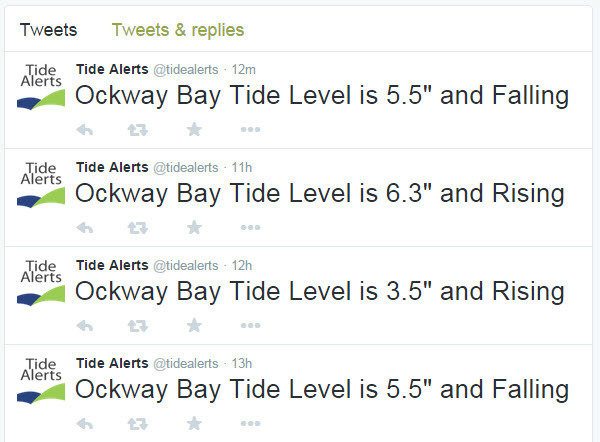
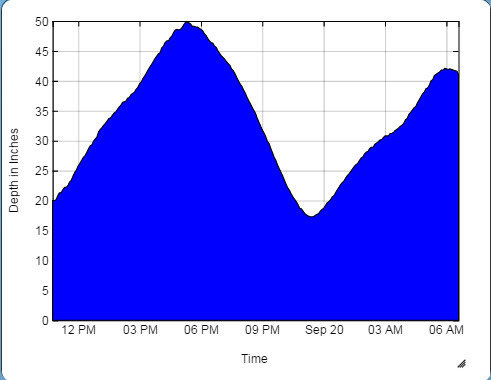
On Line Tide Alerts
Tide Measurement and Prediction
Deep Dive: Google "tide matlab thingspeak"
Source: SUNY StoneyBrook
23 astronomical components in tidal harmonics...
plus geography and weather -- it's always an approximation!
Tidal variation between bays 6 miles apart
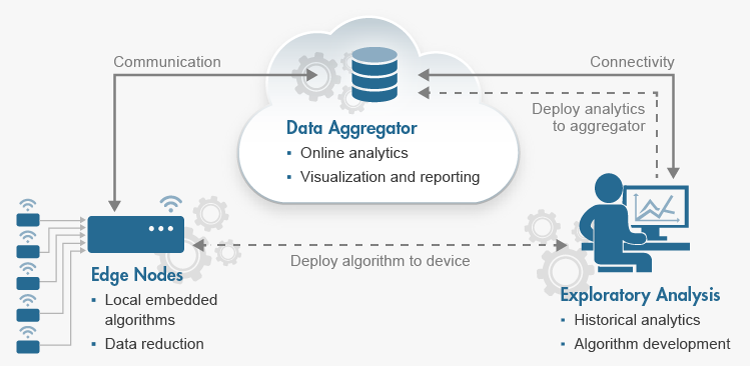
Edge Node
On-Line Analysis
On-Line Analysis
Rob Purser -- rob.purser@mathworks.com, @rpurser47
http://slides.com/rpurser/environmental_analysis
By Rob Purser
Data from our environment surrounds us: sensors and inexpensive edge nodes make it easier than ever to collect lots of data on our surroundings, both indoors & outdoors. From weather data and noise levels to counting cars on the highway outside our window, we can correlate this data with external sources of data to gain deeper insights into our surroundings. Working with live environmental time series data brings unique challenges that span traditional instrumentation, embedded programming, signal processing, and statistics. We’ll discuss some of the environmental Internet of Things data collection and analysis that we’ve done, and three kinds of analytics that we’ve applied: sensor analytics at the edge node, historical data analytics, and online analytics at the data aggregator as the data comes in. You’ll see practical techniques for working with this data, tools, and visualizations.


