


Sarah Dean PRO
asst prof in CS at Cornell
Lydia T. Liu, Sarah Dean, Esther Rolf, Max Simchowitz, and Moritz Hardt
University of California, Berkeley
“21 definitions of fairness” [Narayanan 2018]
. . .
?
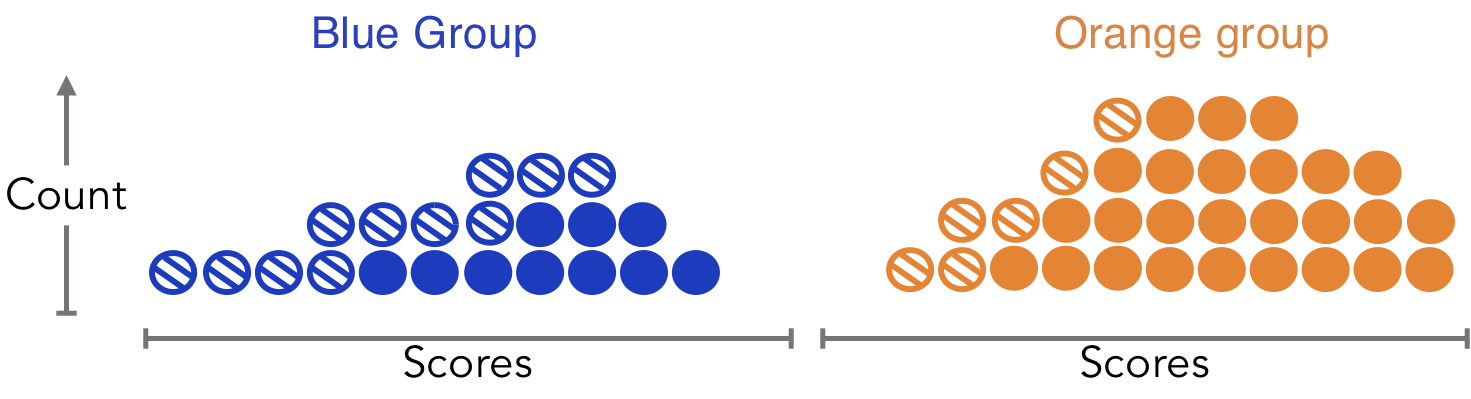
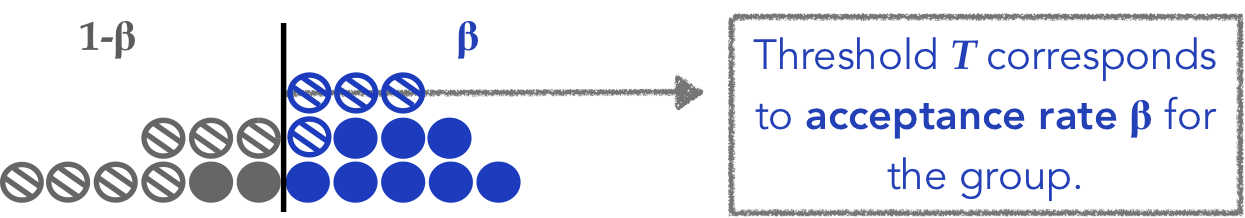
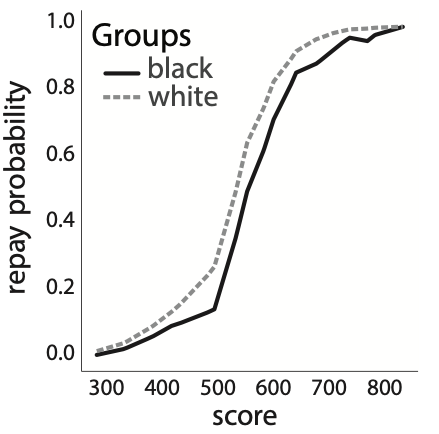
Two groups with different score distributions (e.g. credit scores)
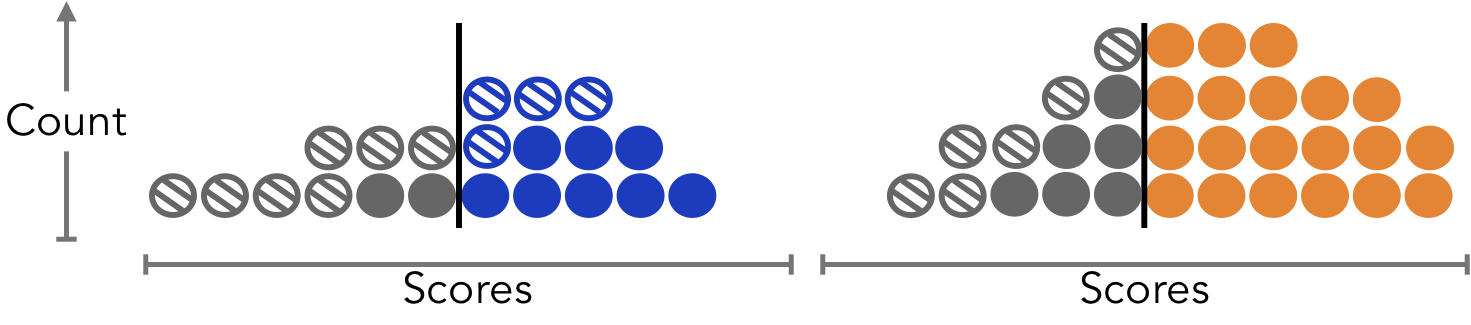
Approve loans according to Demographic Parity.
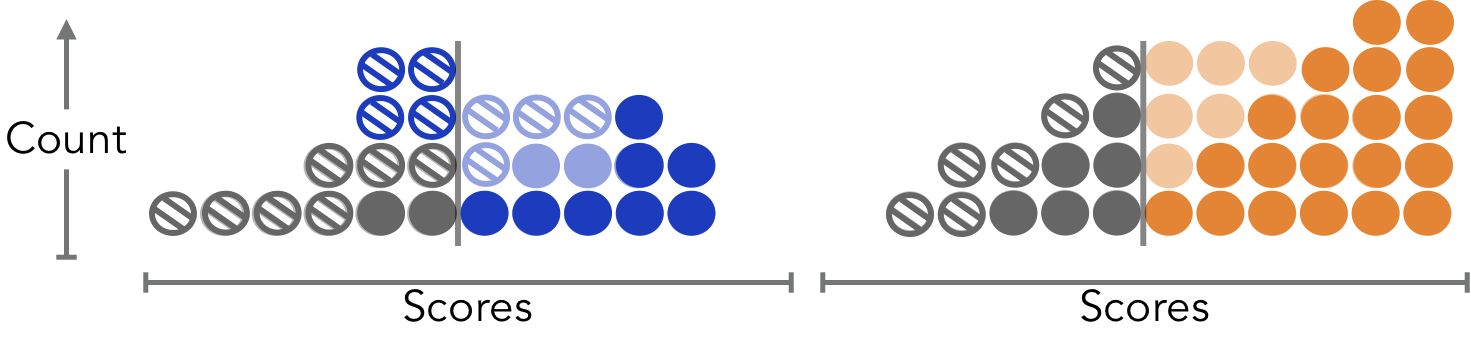
Credit scores change with repayment (+) or default (-).
Harm!
Fairness criteria didn’t seem to help the protected group,
once we considered the impact of loans on scores.
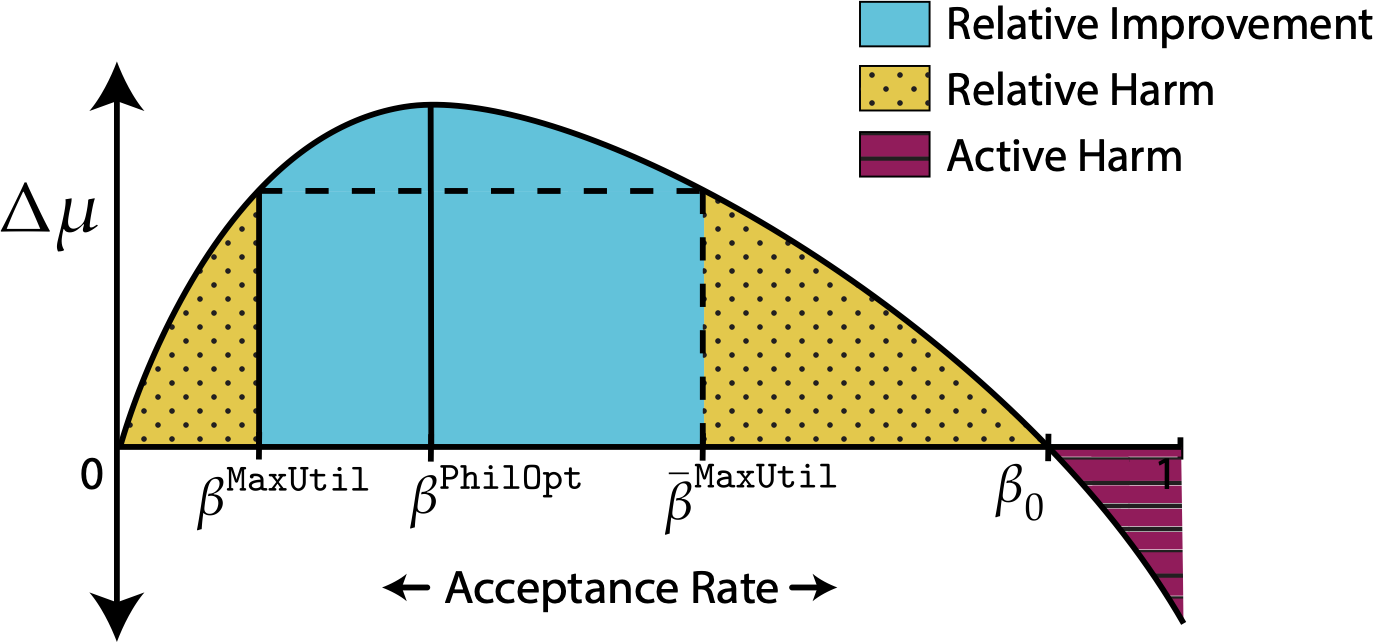
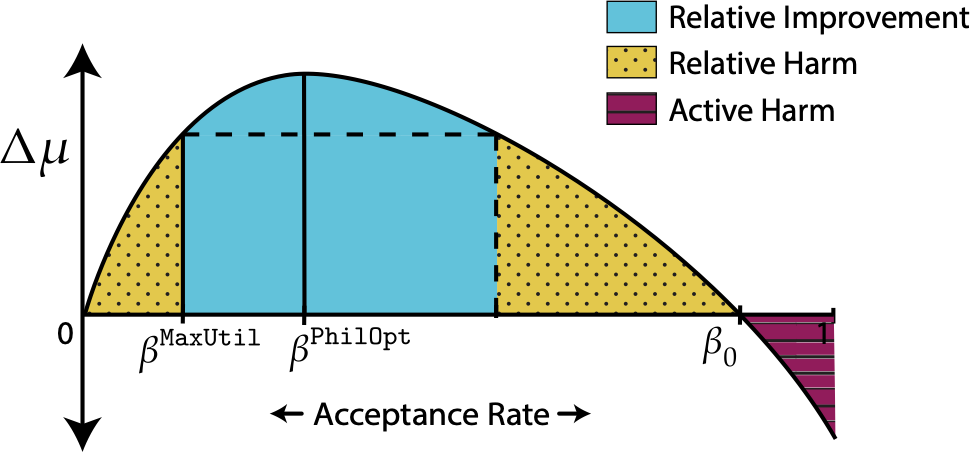
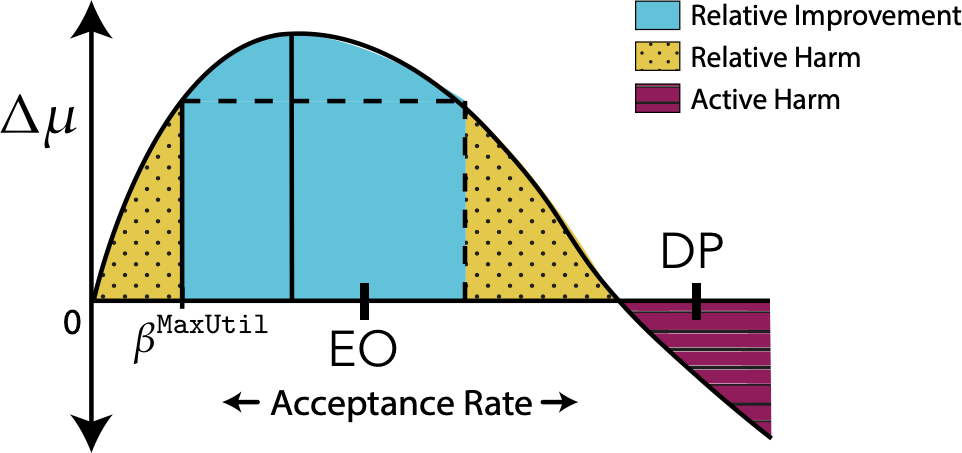
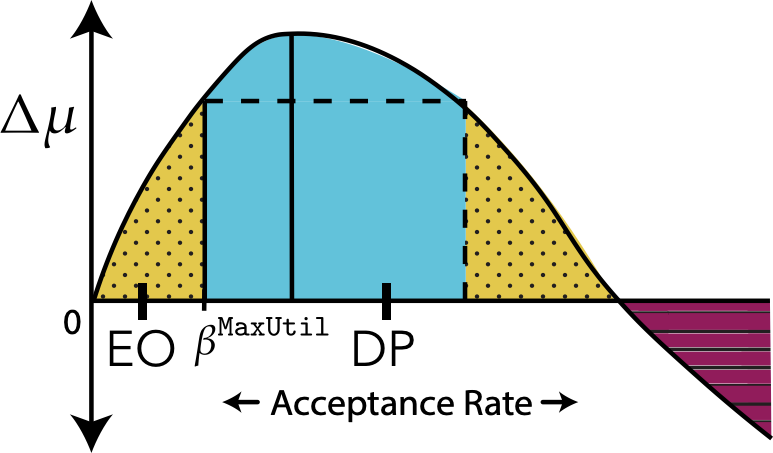
Lemma: \(\Delta\mu\) is a concave function of acceptance rate \(\beta\) under mild assumptions.
average score change
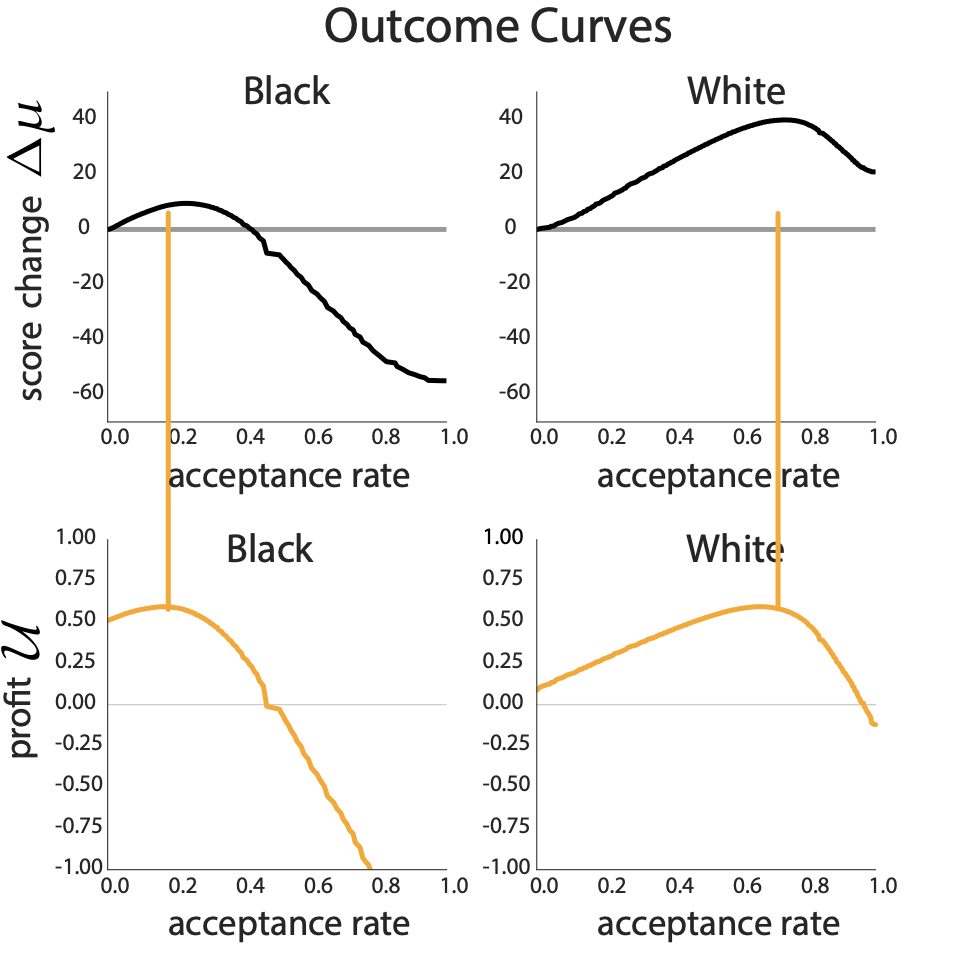
Alternative to unconstrained utility maximization
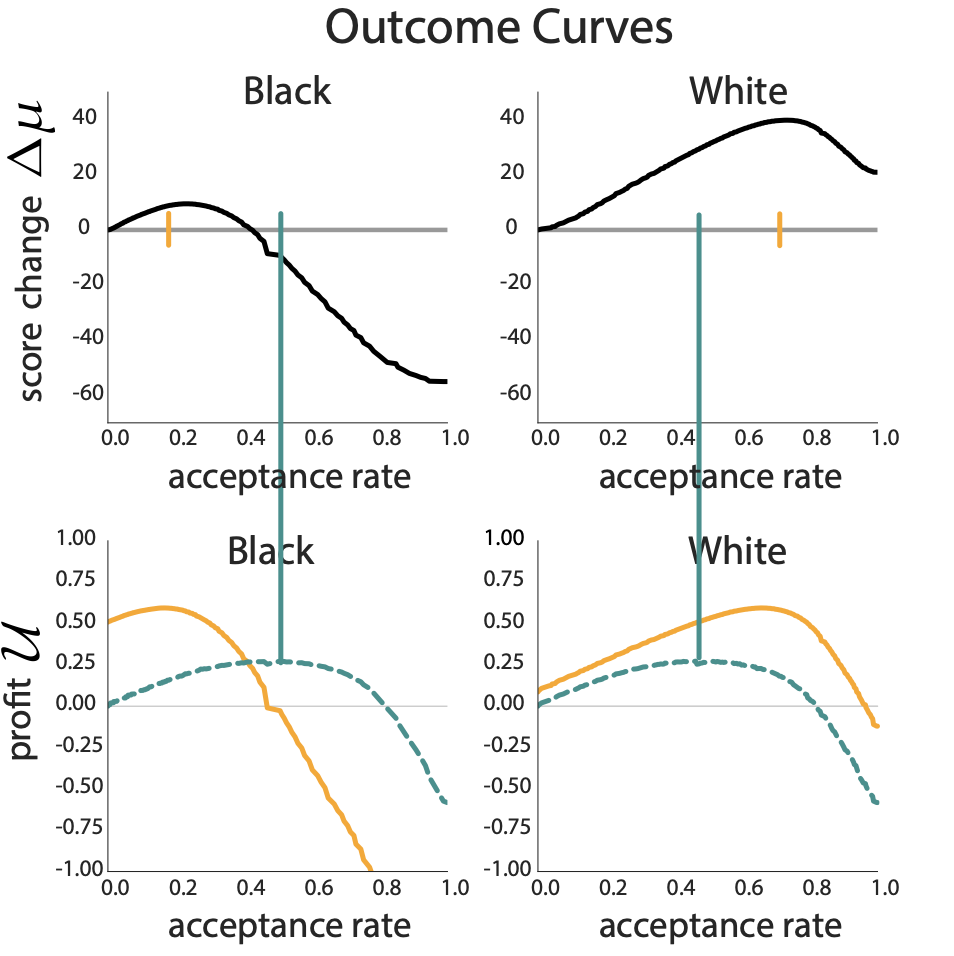
Demographic Parity: Equal Acceptance Rate
Equal Opportunity: Equal True Positive Rates
All outcome regimes are possible
Result 1
Equal opportunity and demographic parity may cause relative improvement, relative harm, or active harm.
Unconstrained utility maximization never causes active harm.
Result 2
Demographic parity (DP) may cause active or relative harm by over-acceptance; equal opportunity (EO) doesn't.
Result 3
Equal opportunity may cause relative harm by under-acceptance; demographic parity never under-accepts.
Choice of Fairness Criteria Matters
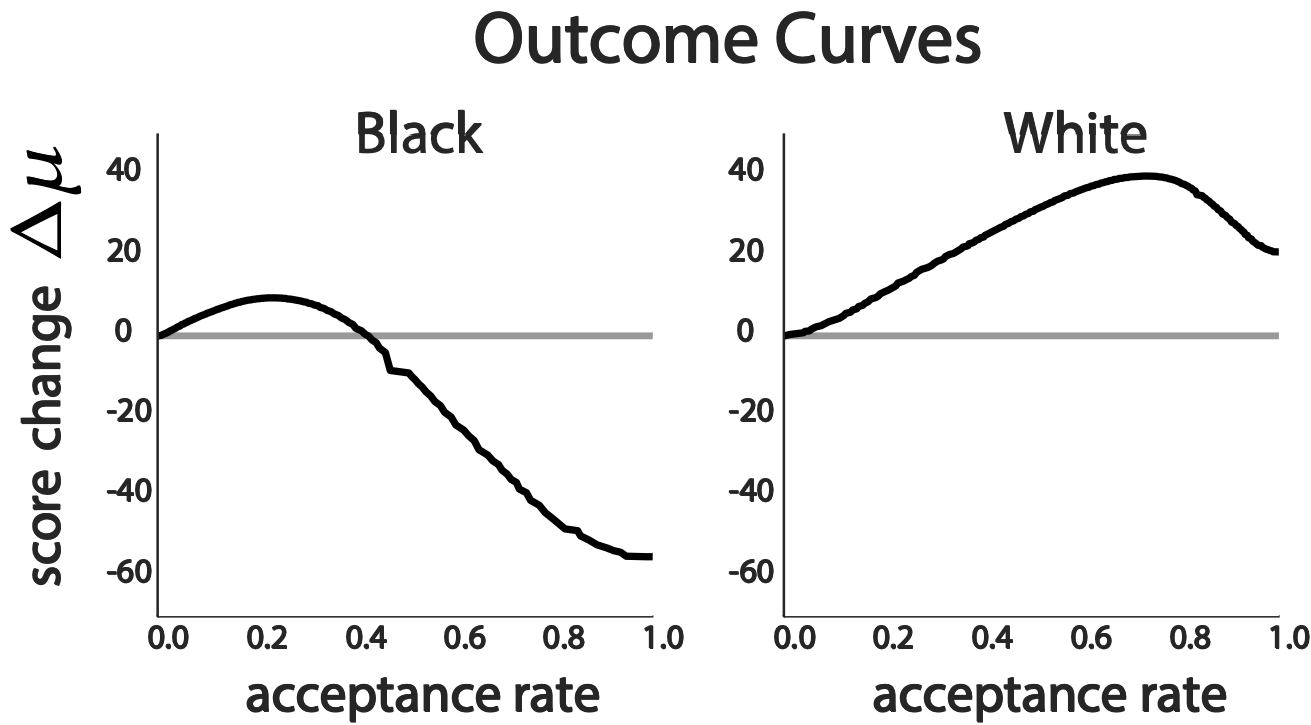
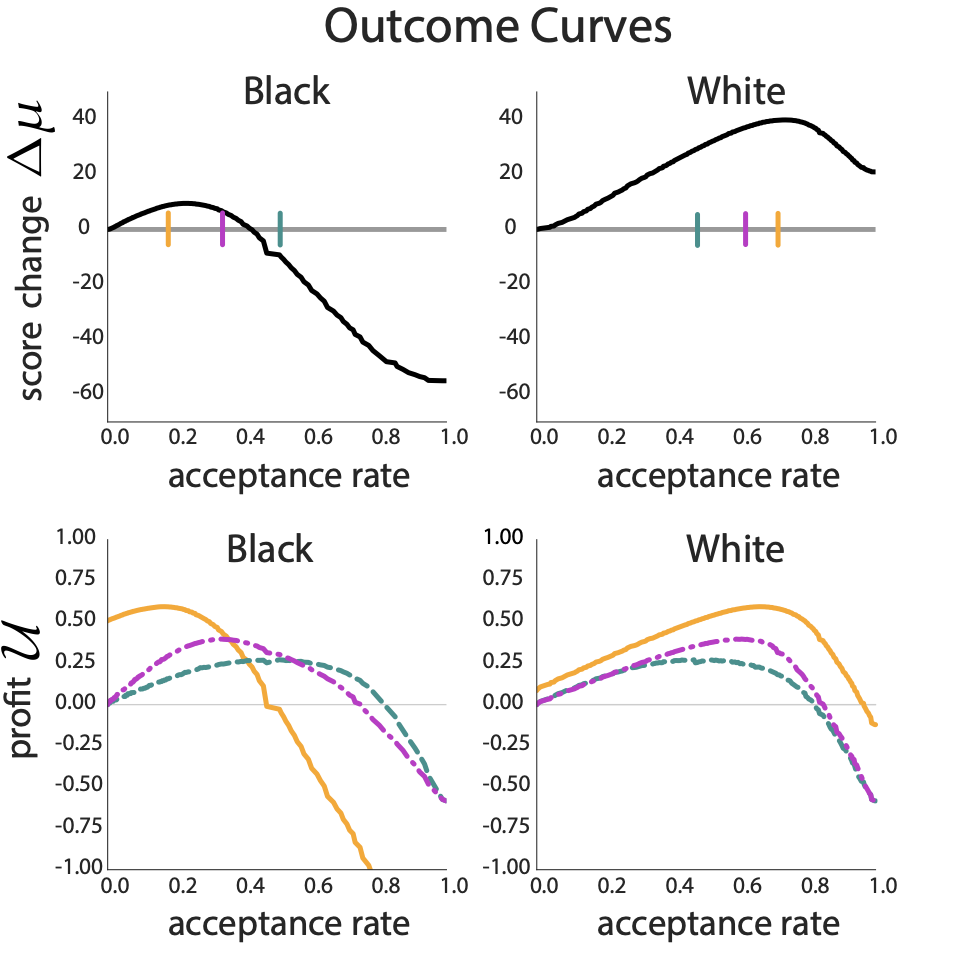
Experiments on FICO Credit Scores
Why the large difference in delayed impact?
Maxima of outcome and utility curves under fairness criteria are more misaligned in the minority black group
Details in full paper:
https://arxiv.org/abs/1803.04383
Algorithmic decisions are everywhere
\(\mathbb{E}[\mathrm{utility}|T] = \mathbb{E}[\mathrm{reward~from~repayments}|T] - \mathbb{E}[\mathrm{loss~from~defaults}|T]\)
\(R_\mathrm{new} = \begin{cases} R_\mathrm{old}+c_+ &\text{if repaid} \\ R_\mathrm{old}-c_- &\text{if defaulted} \end{cases}\)
\(\Delta \mu = \mathbb{E}[R_\mathrm{new}-R_\mathrm{old}]\)
Measurement Error Increases Potential for Improvement
Result 4
If scores are systematically underestimated in the protected group, then regime of relative improvement is widened
What we did
Experiments on FICO Credit Scores
By Sarah Dean


