Vittorio Iocco
Sheng Long
Mara Ulloa
Connor Mayberry
TK Kwon

How Did COVID-19 Affect CTA Ridership Across Chicagoland?
Domain Task
Q: Is there any correlation between ridership changes during COVID19 and socioeconomic status?
Communication Goal
\(\to\) Demonstrate visually that the impact of COVID-19, measured by changes in CTA ridership between 2019, 2020, and 2021, is not felt the same across stations with different socioeconomic backgrounds
Changes in aggregate weekly ridership across all stations
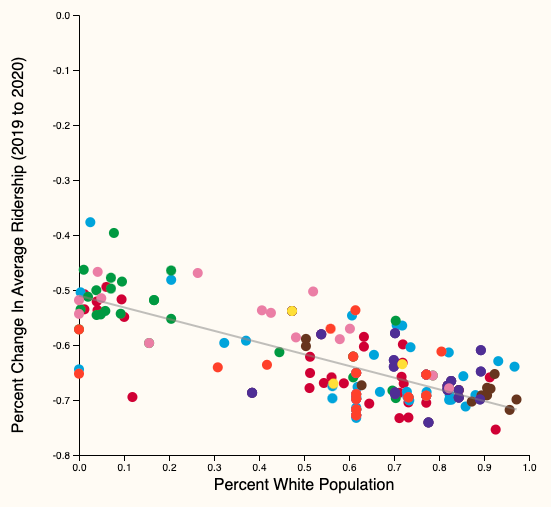
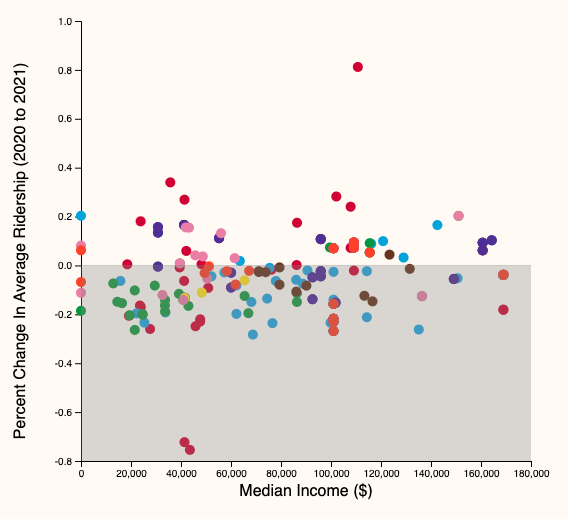
Changes in aggregate yearly ridership per station


Changes in aggregate weekly ridership across all stations
Changes in aggregate yearly ridership per station
- Line graph 📉 to show substantial decrease
- Animation (🔎) to emphasize the scale of events
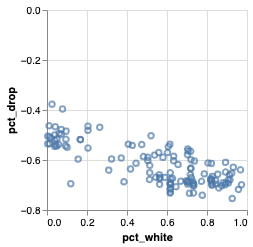
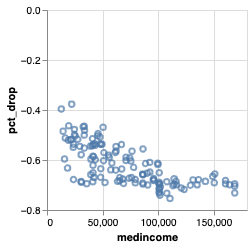
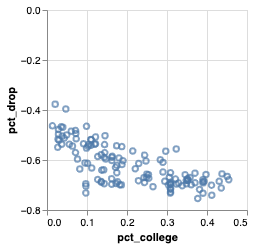
- Scatter plot
- Each dot \(\to\) 🚉
- X-axis: income, % white population, % bachelor's degree
- Y-axis: % change in aggregate ridership
- color: the CTA line they belong to
Line graph
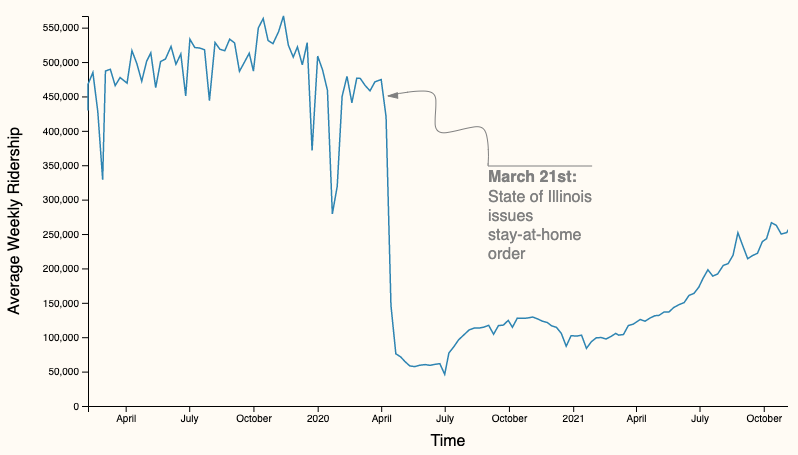
2019-1-02 to 2021-12-01
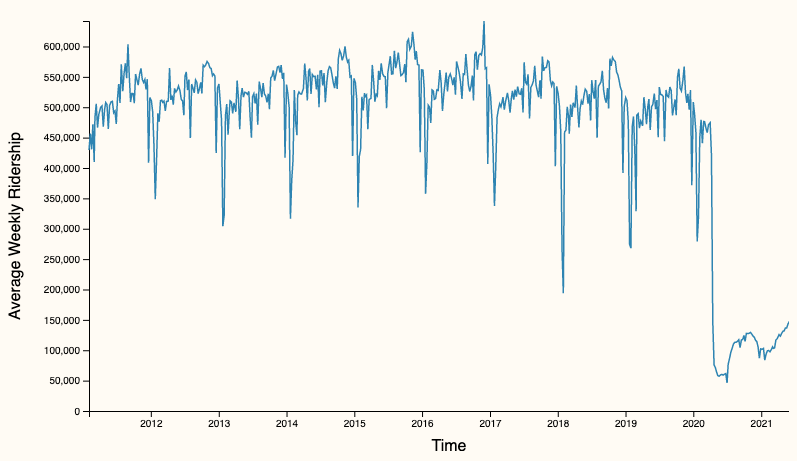
2011-01-02 to 2021-12-01
Scatter plot
Narration
-
Martini glass
-
answer question with graphs
-
user exploration in the end
-
-
Scrolly-telling
-
Animation allows us to show the sheer amount of stations
-

Thank you!
Now, demo time!

The general model
A collection of \(n\) items
-
For each item \(i\in [n]\), there is
an associated score \(\tau_i\)
an associated quality \(\omega_i \in \mathbb{R}\)
-
\(\pi: [n] \to [n]\) denotes a permutation;
\(\pi(i)\) denotes the item with the \(i\)th largest score
The general model cont'd
-
\(M_{ij}\in (0,1)\): the probability that item \(i\) wins the comparison against item \(j\)
"noise"
usually takes the form of a function \(\Phi\) (or \(F\)) in parametric models
could also be expressed as \(p(i, j)\)
-
By definition,
\(M_{ij}+M_{ji}=1\) -- every comparison has one winner
\(M_{ii} = 1/2\) -- completeness
Scores
-
Borda score \[\tau_i := \frac{1}{n}\sum_{j=1}^n M_{ij}\]
Interpretation: ...
Bradley-Terry-Luce (BTL) \[\tau_i := \exp(\omega_i)\]
Noise and Comparison
-
Possible extension of \(M_{ij}\): (if \(i\) ranks higher than \(j\))
\(M_{ij} = 1/2 + \gamma, \gamma \in (0, 1/2]\)
-
Comparison pairs can be chosen non-adaptively (offline) or adaptively (online)
"Adaptive" in the sense that pairs chosen for comparison is based on previous results
Non-adaptive example: uniform random
Adaptive example: Knockout tournament
A graphical illustration
- complete rank
- top \(k\) items / approximate rank
quality \(\omega_i\)
1
2
\(n\)
...
adaptive
non-adaptive
pairwise comparisons
noise \(M_{ij}\)
score \(\tau_i\)
e.g. Borda score
e.g. difficulty level of question answered
\(={n \choose 2}\)
\(<{n \choose 2}\)
Parametric Models
Requires \(M_{ij}\) to be a specific function of the difference between item \(i\) and item \(j\)'s qualities
-
That is, \[M_{ij} = F(\omega_i - \omega_j)\;\; \forall i, j \in [n]\] such that the function \(F:\mathbb{R} \to [0, 1]\) is a strictly increasing and continuous CDF
We also use \(\Phi\) sometimes to represent \(F\)
\(F\) is typically assumed to be known
Parametric Model Properties
-
By construction, any parametric model has the following property:
If \(\omega_i > \omega_j\) for some pair of items \((i,j)\), then we are also guaranteed that \(M_{il} > M_{jl}\) for every item \(l\)
From this property, we have the ranking induced by the scores \(\{\tau_i\}_{i=1}^n\) is equivalent to that induced by \(\{\omega_i\}_{i=1}^n\)
Bradley-Terry-Luce (BTL)
A specific case of the parametric model
Recall that the probability that \(i\) wins over \(j\) is given by \[P(\tau_i>\tau_j) = \frac{\tau_i}{\tau_i+\tau_j}\]
If we define the scoring function to be \(\tau_i = \exp(\omega_i)\), then \[M_{ij}=P(\tau_i>\tau_j)=\frac{e^{\omega_i}}{e^{\omega_i}+e^{\omega_j}}=\frac{1}{1+e^{-(\omega_i-\omega_j)}}\]\[=F(\omega_i - \omega_j)\]
TrueSkill / ELO (chess)
A more concrete example
Each player has skill \(s_i\) (quality \(\omega_i\))
-
Each player has performance \(p_i\) (score \(\tau_i\))
\(p_i \sim \mathcal{N}(s_i, \beta^2)\)
Probability that player \(i\) wins player \(j\): \[P(p_i > p_j|s_i, s_j) = \Phi\left(\frac{s_i - s_j}{\sqrt{2}\beta}\right) (M_{ij})\]
\(\Phi\) is CDF of \(\mathcal{N}(0, 1)\)
Mallows
\(F\) is now the Gaussian CDF
Non-parametric Model
Strong Stochastic Transitivity (SST)
A superset of parametric models
Does not assume the existence of a quality vector \(\omega \in \mathbb{R}^n\)
Does not assume the existence of any specific form for \(M_{ij}\)
Assumes the existence of the total ordering of \(n\) items
Strong Stochastic Transitivity (SST) cont'd
Assumes \(M_{il} \geq M_{jl}\) for every pair \((i, j)\) in which \(i\) is ranked above \(j\) in the total ordering and every item \(l\) (Shah and Wainwright 2018)
-
Alternative definition: (Falahatgar et al. 2017)
\(M_{il} \geq \max (M_{ij}, M_{jl})\)
Exact recovery of top \(k\) items
depends on the degree of separation between \(k\) ranked and \((k+1)\) ranked item
-
Define \(k\)-separation threshold:
\(\Delta_k(M) := \tau_{(k)}(M) - \tau_{(k+1)}(M) \)
Approximate ranking
Approximate in the sense that the top \(k\) items obtained has a Hamming error between itself and the true ordering
Hamming distance / error between two sets \(A\) and \(B\) is defined as \[D_H=|(S \cup S^*) \setminus (S \cap S^*)|\]
Separation threshold between \(k\)-th ranked item and \((k+1)\)-th ranked item
Approach I'd like to take
Assume parametric model -- not too sure
Use Borda score
Assume adaptive comparison pair selection ? maybe start with non-adaptive, uniform randomly chosen
end goal: learn the best possible rank with the fewest possible sample complexity
CS Interactive Info Vis project
By Sheng Long


