B-DC 221
2021
Computation in Design 3
Information Design Project
Computation in Design 3
Information Design Project
2021
Overview
Computation in Design 3
Introduction
The guiding principle behind this project is the transformation of numerical data through code and design into visual information and knowledge. When we look at data, we see numbers and complexity that are often inaccessible to the layman.
The challenge for a designer is to propose ideas and solutions for how data can be transformed from its raw format into a simple, elegant form to synthesise and reveal insights conveyed through meaningful narrative and experience. In a series of group exercises and followed by an individual project, students learn, analyse, visualise and interpret data using a number visualisation techniques and existing or self-generated datasets.
Keywords
Code, Data, Data Visualisation, Information Design, Sense-Making
1
B-DC 221
Computation in Design 3
Information Design Project
2021
Overview
Process
This class is divided into two parts. First, students undertake a series of exercises that deepen their understanding of the interrelation of data, code and design.
The exercises are conducted in groups to explore data and code together. Students then delve into their individual project to apply techniques, skills and knowledge they have learned before. It is through this project that they create a visual representation of a dataset to create an experience or narrative with a particular aim in mind.
2
Computation in Design 3
Information Design Project
B-DC 221
Computation in Design 3
2021
Overview
Project
(De)coding Data is a self-directed project in which students start from a selected or generated data set to develop visual representations that provide access to and insights into the hidden patterns, details, information and meaning that the dataset can reveal.
Final Deliverable
Multi-page microsite containing final outcome, process and documentation.
3
Computation in Design 3
Information Design Project
B-DC 221
Computation in Design 3
2021
What is this class is about
B-DC 221
Data
Information
Experience
Collect data
Visually represent numerical data
Express data through code
Present information that makes it most accessible, readable and easily understood by the users
Help users understand numerical data by organising and simplifying data and information in visual and written form
In this class we will cover the practical application of coding and data visualisation techniques to create visual forms to make data and information easily understood and accessible to users.
Through a series of exercises students will collect, interpret and visualize data in analog and digital form which can be experiential and interactive
In a multi-page website, students document their results and make them accessible to users through a meaningful and purposeful user experience and narrative
Computation in Design 3
Information Design Project
2021
Schedule
1
Weekly Schedule
This is week
B-DC 221
Computation in Design 3
Information Design Project

2021
Schedule
1
Introduction and Urban Fieldworks 1
Introduction, expectations, Digital Portfolio
Exercise 1
2
Urban Fieldworks 2
Exercise 1 continues
3
Urban Fieldworks 3
Exercise 1 continues and concludes
In-class group presentations
4
Data and Code 1
Data formats and graphs
Exercise 2
Review the data collected during the field trip and use it with the code templates provided to create a location-based visualization and a simple data graph.
Work on an artifact that interprets data and stories collected. This artifact can be a drawing, a data-physicalisation, a coded sketch.
Probe numeric data and address how it can be formatted, analysed and presented through code.
Introduction and overview of classes, exercises and documentation procedures. This is then followed by the Urban Fieldworks exercise.
Weekly Schedule
Topics
What we will cover
B-DC 221
Computation in Design 3
Information Design Project
2021
5
Data and Code 2
Data to graph
Exercise 2 continues
6
Data and Code 3
Sense Making
7
Documenting term 1
Multi-page website
Exercise 1 and 2 conclude
8
Independent study
Presentation on Sense Making: How to make sense of data? How to narrate data? How to visually tell a story from data?
Work with data and code continues with the representation of data through code and drawings.
Weekly Schedule
Topics
What we will cover
Conclude term 1 with documenting outcomes created so far in a multi-page website based on a given template
B-DC 221
Computation in Design 3
Information Design Project
No class
Schedule
2021
9
(De)coding Data Project 1
Introduction and briefing
Project Ideation starts
10
11
(De)coding Data Project 3
Consultation and feedback
In-class development
Workcheck
12
(De)coding Data Project 4
Consultation and feedback
Coding-clinics
Students are briefed on their term 2 project. Then they start the ideation process to identify the data and the topic they plan to work on.
Ideation concludes and project development starts, students further develop their project by narrowing down the concept and technical aspects.
Weekly Schedule
Project development continues, students should have progressed with their project to present a work-in-progress update and receive feedback.
Topics
What we will cover
(De)coding Data Project 2
Formalising project idea
Consultation and feedback
Sketching and data collection
Mostly independent work, in-class consultations are offered to receive feedback on aesthetics and narrative. Coding-clinics can be used to resolve code related issues.
B-DC 221
Computation in Design 3
Information Design Project
Schedule
2021
13
(De)coding Data Project 5
Prototype presentation and review
Feedback
14
15
Assessment
Students present a working prototype of their project in their respective classes. Feedback received should allow students to independently finalise their project.
Weekly Schedule
Topics
What we will cover
Independent Study
B-DC 221
Computation in Design 3
Information Design Project
Students work on and conclude their project independently based on submission requirements
Schedule
2021
Lecturers Classes Links
B-DC 221
Computation in Design 3
Information Design Project
Andreas Schlegel
D501
A
Clara Koh
D501
B
Yasser Bin Suratman
D501
C
Olivia Chua
B1-06C
D
Vikas Bhatt Kailankaje
B1-06B
Ong Kian Peng
B1-04B
2021
Digital Portfolio
The Digital Portfolio is a digital archive which you will use to document and archive your work on a weekly basis. A given folder structure tells you which documents are required. You should update your Digital Portfolio every week. There are two main elements that are required
1. Archive Exercises
2. Project
B-DC 221
Computation in Design 3
Information Design Project
Recommended, same procedure as in Level 1
2021
Digital Portfolio
B-DC 121
After you have downloaded the Digital Portfolio template, you should see the following.
Folder structure
Available for download as .zip from Google Drive
Document your process and outcomes
Archive and organise materials for your deliverables
Read and follow the Digital Portfolio Guidelines
Keep(s) your work organised
Computation in Design 3
Information Design Project
Recommended, same procedure as in Level 1
Some of you have just joined Level 2, in case you are facing issues with the Digital Portfolio, please let me know and we can resolve them later in class.
2021
B-DC 121
Computation in Design 3
Information Design Project

2021
Resources
Readings
Links
References
B-DC 221
Computation in Design 3
Information Design Project
In this section you will find resources for learning, curiosity and inspiration; a collection of links, works, artists, designers that will grow over the course of the semester.
2021
Resources
Readings
Links
References
B-DC 221
Computation in Design 3
Information Design Project
Klanten, Robert. Data Flow: Visualising Information in Graphic Design. Gestalten, 2008.
Gross, Benedikt, et al. Generative Design: Visualize, Program, and Create with JavaScript In p5.Js. Princeton Architectural Press, 2018.
Urban Fieldworks
Data Visualisation
Information Design
Design
Data Storytelling
2021
Resources
Readings
Links
References
B-DC 221
Computation in Design 3
Information Design Project
2021
Resources
Readings
Links
References
B-DC 221
Computation in Design 3
Information Design Project
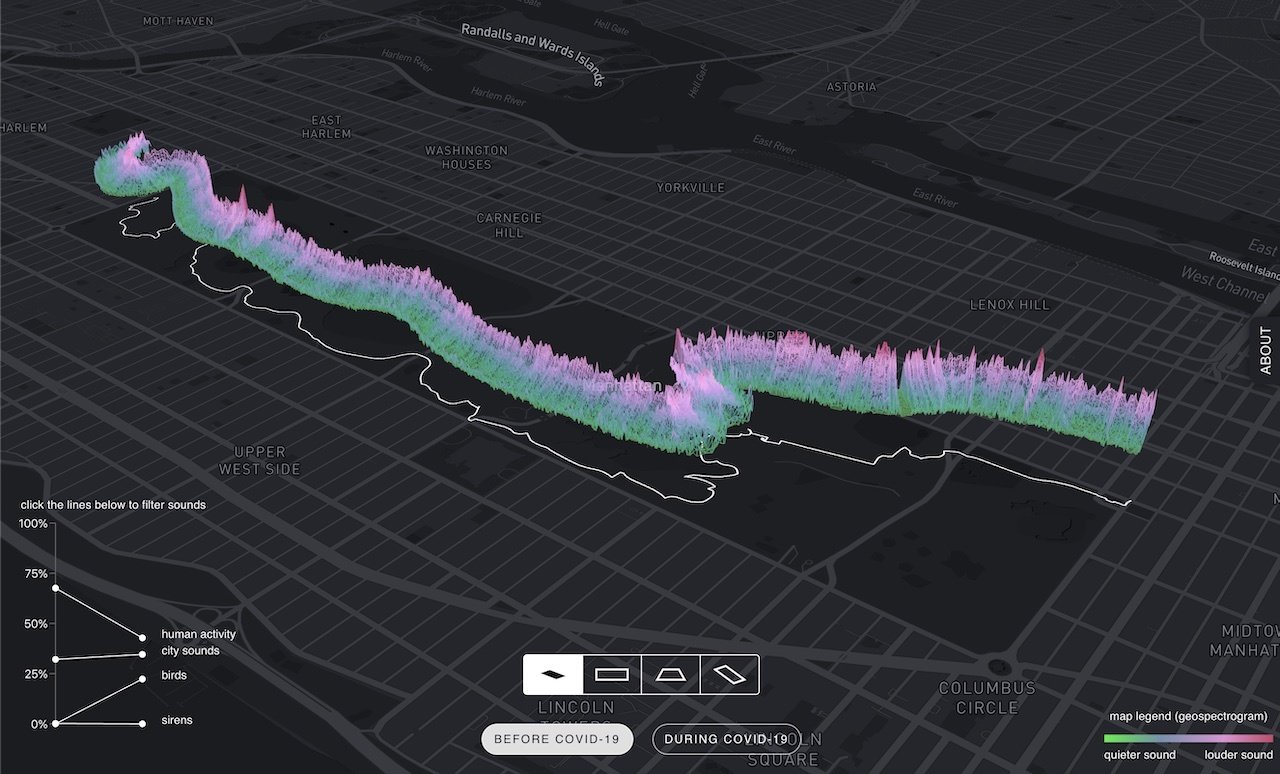
Senseable City Lab
The Senseable City Laboratory is a research initiative at the Massachusetts Institute of Technology that looks at the transformation of cities through design, science and data.
2021
Resources
Readings
Links
References
B-DC 221
Computation in Design 3
Information Design Project
Accurat

Accurate is a data visualisation design and development studio. Accurat embraces complexity, pursues beauty, doesn't rely on standards, knows that data is not just numbers.
2021
Resources
Readings
Links
References
B-DC 221
Computation in Design 3
Information Design Project
Giorgia Lupi
Giorgia Lupi is an information deisgner and a partner at Pentagram advocating for Data Humanism. She is the co-author of Dear Data, a year-long analog data drawing project.

2021
Resources
Readings
Links
References
B-DC 221
Computation in Design 3
Information Design Project
Dear Data

Dear Data is a year-long, analogue data drawing project between Stefanie Posavec and Giorgia Lupi, an information designer based in New York.
2021
Resources
Readings
Links
References
B-DC 221
Computation in Design 3
Information Design Project
Stefanie Posavec
Stefanie Posavec is a designer, artist, and author exploring playful, friendly approaches to communicating data and information to all ages and audiences.

2021
Resources
Readings
Links
References
B-DC 221
Computation in Design 3
Information Design Project
George Galanakis
George Galanakis is an experimental new media artist working at the convergence of data, minimalism and experience.
2021
Resources
Readings
Links
References
B-DC 221
Computation in Design 3
Information Design Project
Moritz Stefaner
Moritz Stefaner lives and breathes data visualization as an independent designer, consultant and researcher.
He helps organizations, researchers and businesses to find truth and beauty in relevant and meaningful data.

2021
Resources
Readings
Links
References
B-DC 221
Computation in Design 3
Information Design Project
Federica Fragapane

2021
Resources
Readings
Links
References
B-DC 221
Computation in Design 3
Information Design Project
Nathan Lau
Nathan Lau has been visualizing data for over a decade. He has a PhD in statistics from UCLA, with a focus on visualization for presenting data to everyone. He wants as many people as possible to understand data, and he thinks visualization — from statistical charts to infographics to data art — is the best way to get there.
2021
Resources
Readings
Links
References
B-DC 221
Computation in Design 3
Information Design Project
Cole Nussbaumer Knaflic


It’s surprisingly easy to make a confusing graph. No one sets out with that purpose, but it happens frequently—across all industries and by all sorts of well-intending people. One way to avoid this challenge is to never simply show data, but rather to tell a story with it.
2021
Resources
Readings
Links
References
B-DC 221
Computation in Design 3
Information Design Project
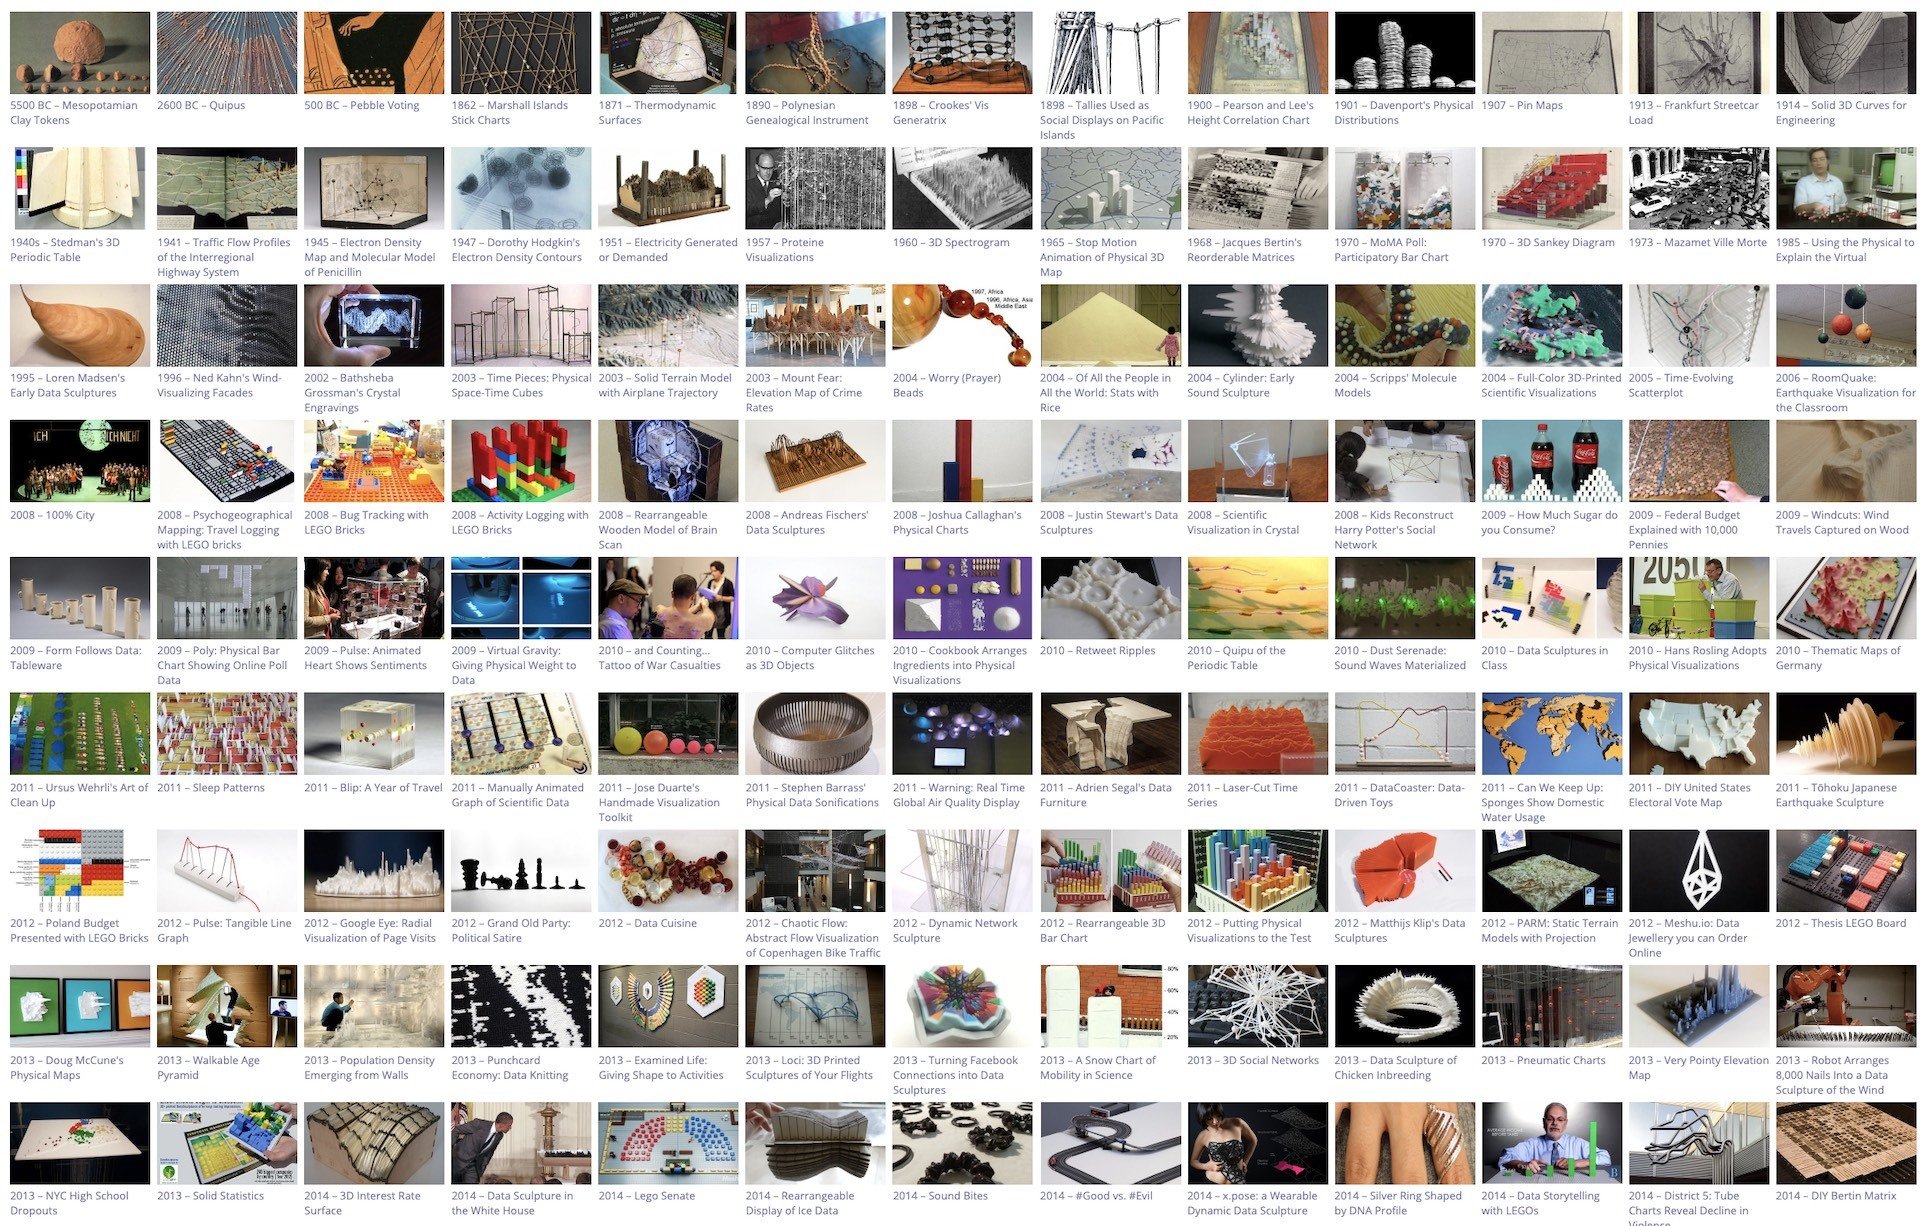
Data Physicalization
A gallery of physical visualizations and related artifacts from 5500 BC till today. Data physicalization aims to help people explore, understand, and communicate data using computer-supported physical data representations. These representations are called physicalizations, analogously to visualizations – their purely visual counterpart.
2021
Resources
Readings
Links
References
B-DC 221
Computation in Design 3
Information Design Project
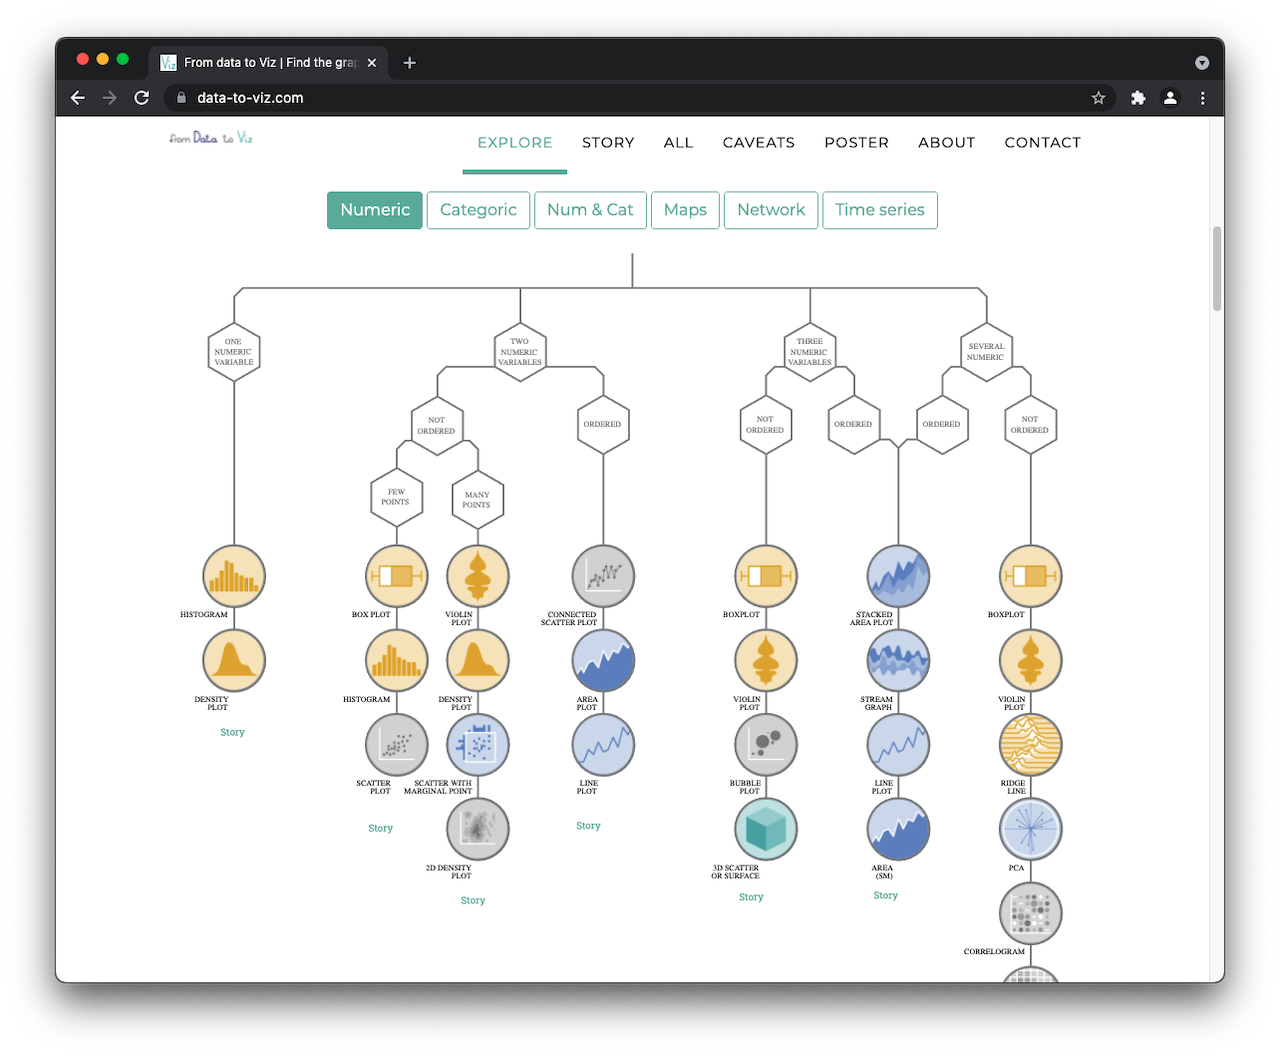
data-to-viz.com
From Data to Viz is a classification of chart types based on input data format. It comes in the form of a decision tree leading to a set of potentially appropriate visualizations to represent the dataset.
The project is built on two underlying philosophies. First, that most data analysis can be summarized in about twenty different dataset formats. Second, that both data and context determine the appropriate chart.
2021
Resources
Readings
Links
References
B-DC 221
Computation in Design 3
Information Design Project
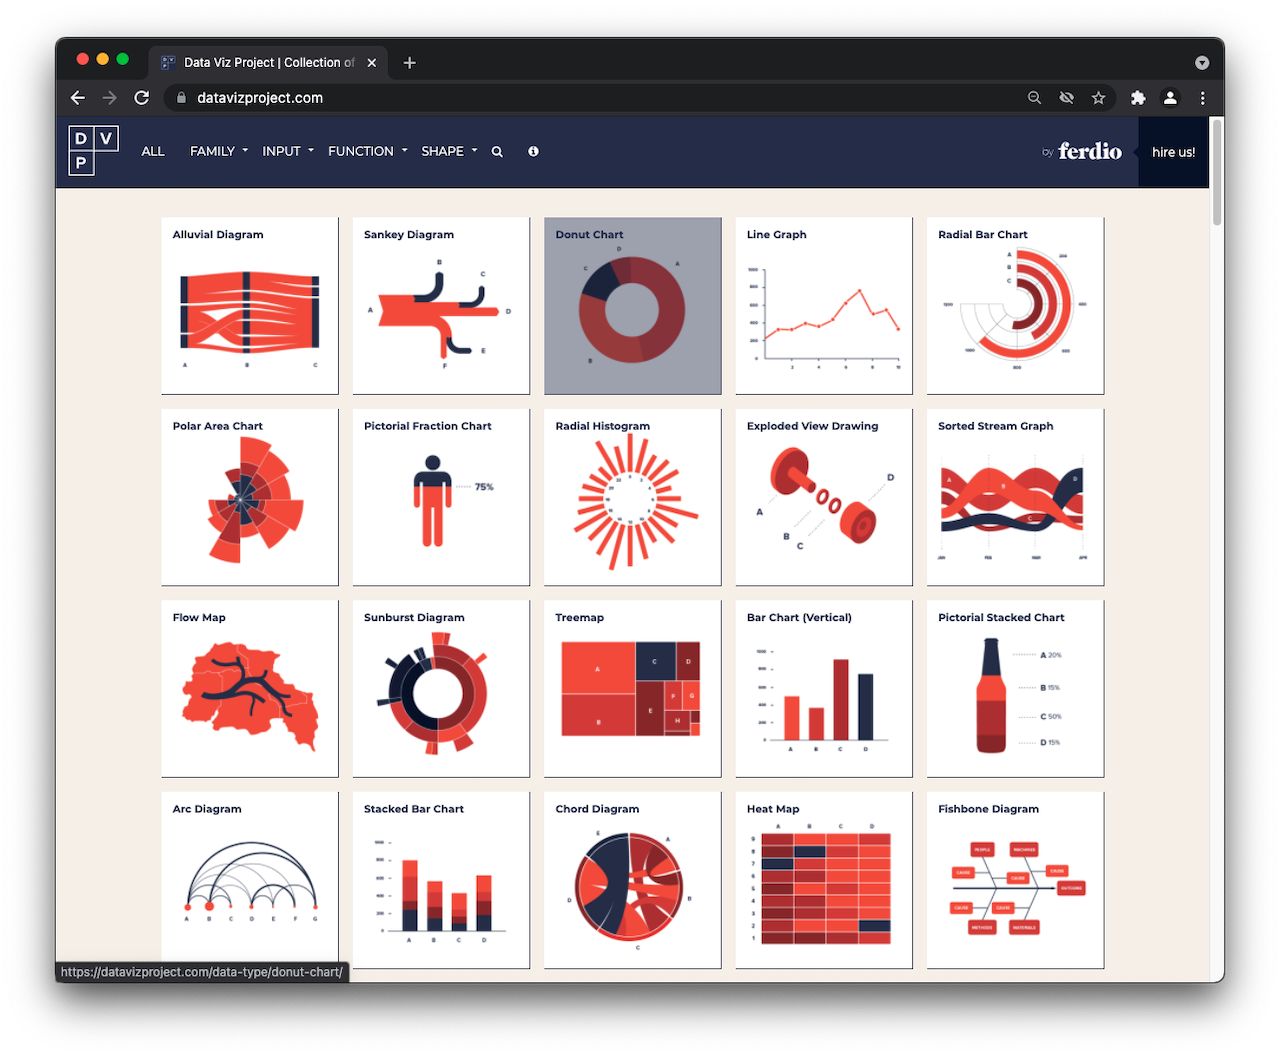
datavizproject.com
This is a website trying to present all relevant data visualizations, so you can find the right visualization and get inspired how to make them.
2021
Resources
Readings
Links
References
B-DC 221
Computation in Design 3
Information Design Project
2021
Year 1
B-DC 221
What did we cover and practice in year 1?
Computation in Design 3
Information Design Project
Website
Creative Coding
Collaboration
Making
2021
B-DC 221
analytical and computational
experimentation and curiosity
Urban Fieldworks
Data and Code
(De)coding Data
Computation in Design 3
Information Design Project
group
week 1 – 3
group / individual
week 4– 7
individual project
week 9 – 13
This Semester
Information Design Project
2021
B-DC 221
Computation in Design 3
Information Design Project
Week 1
2021
Urban Fieldworks 1
Exercise 1
B-DC 221
Computation in Design 3
Information Design Project

Conduct field trip
Collect data
Work in a group

2021
Week 1
Conduct field trip
Collect data
Work in a group
Urban Fieldworks is an exercise that investigates the ordinary happenings and encounters found within an urban landscape.
It offers participants the opportunity to observe and sense their environment through digital and analog means to then visualise numerical data and create an artefact from their findings.
The following will require you to take a number of steps to complete this exercise. These steps are explained in detail. Together with your group members have a focused read and give it a good thought before you may ask for clarification or help.
B-DC 221
Computation in Design 3
Information Design Project
Urban Fieldworks 1
2021
Week 1
We shall not cease from exploration, and the end of all our exploring will be to arrive where we started and know the place for the first time.
B-DC 221
Computation in Design 3
Information Design Project
T.S. Eliot
Exploration
T.S. Eliot, the 1948 winner of the Nobel Prize in Literature, is one of the giants of modern literature, highly distinguished as a poet, literary critic, dramatist, and editor and publisher.
Urban Fieldworks 1
2021
B-DC 221
Computation in Design 3
Information Design Project
Urban Fieldworks 1

Field trip
Data
Artefact
Urban Explorations Project Singapore, 2012
2021
Week 1
B-DC 221
Computation in Design 3
Information Design Project
Urban Explorations sample projects
Urban Fieldworks 1


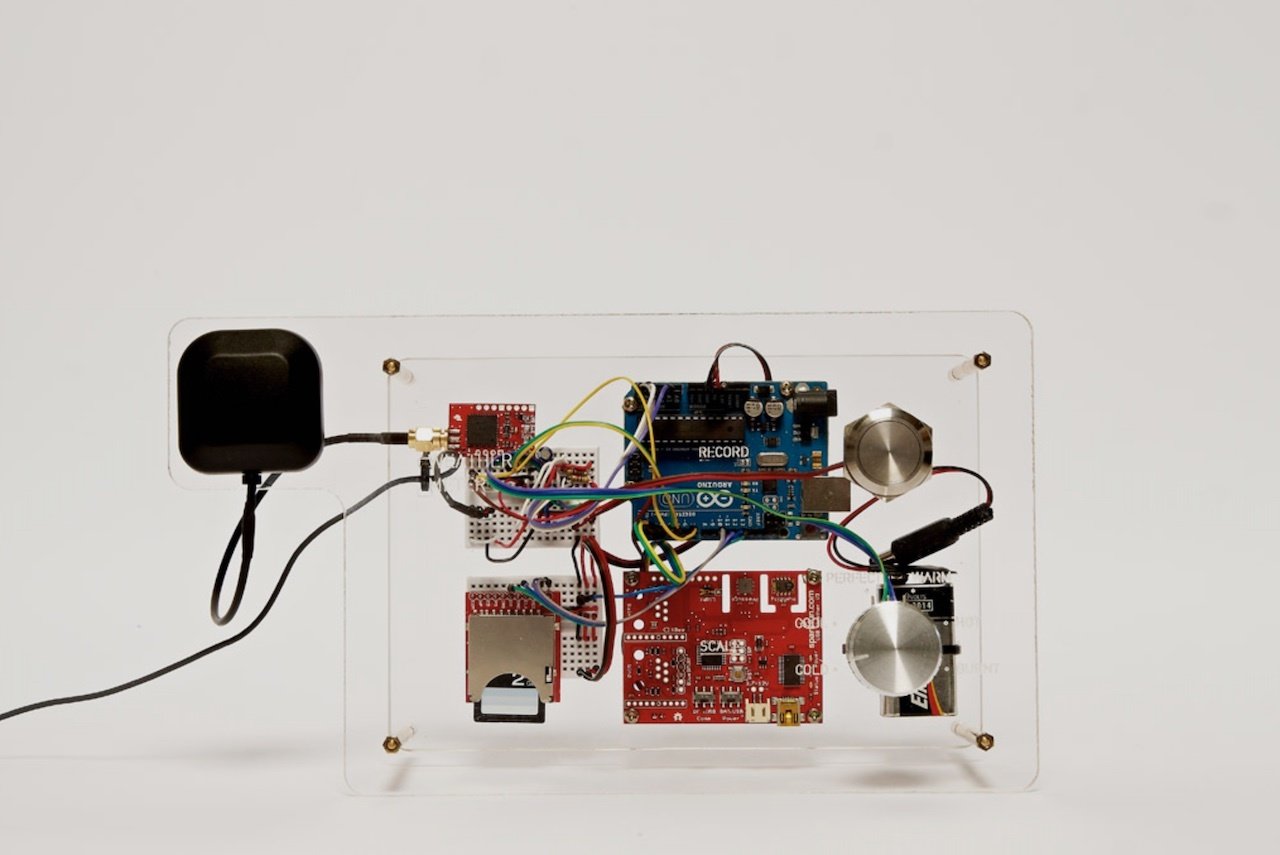
Judith Lee
Panting Trees
Singapore
2012
Temperature
Custom-built tool
SD card
Degrees
Patrick Kochlik
Scentscapes
Singapore
2012
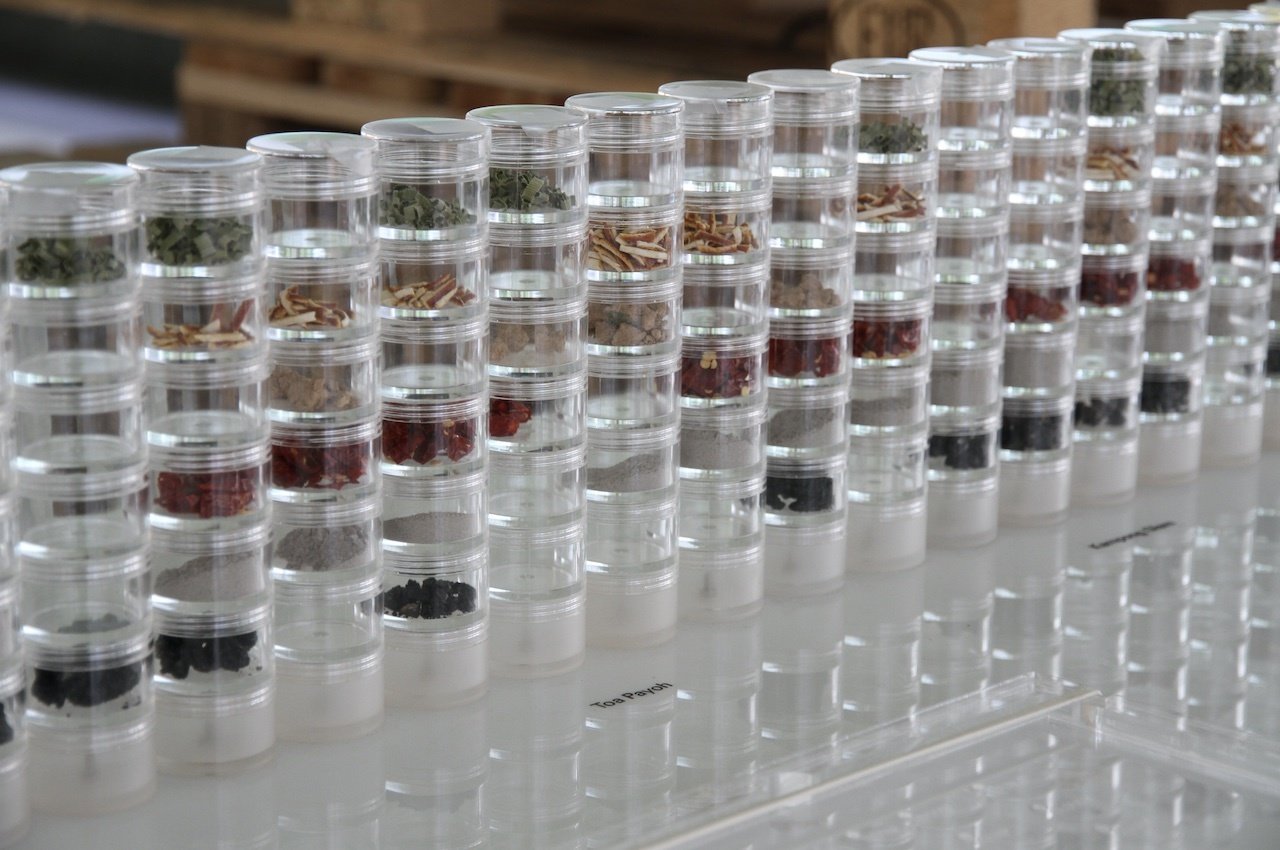
Scent
Nose Henning's Odour System
Paper
Scale 1-10
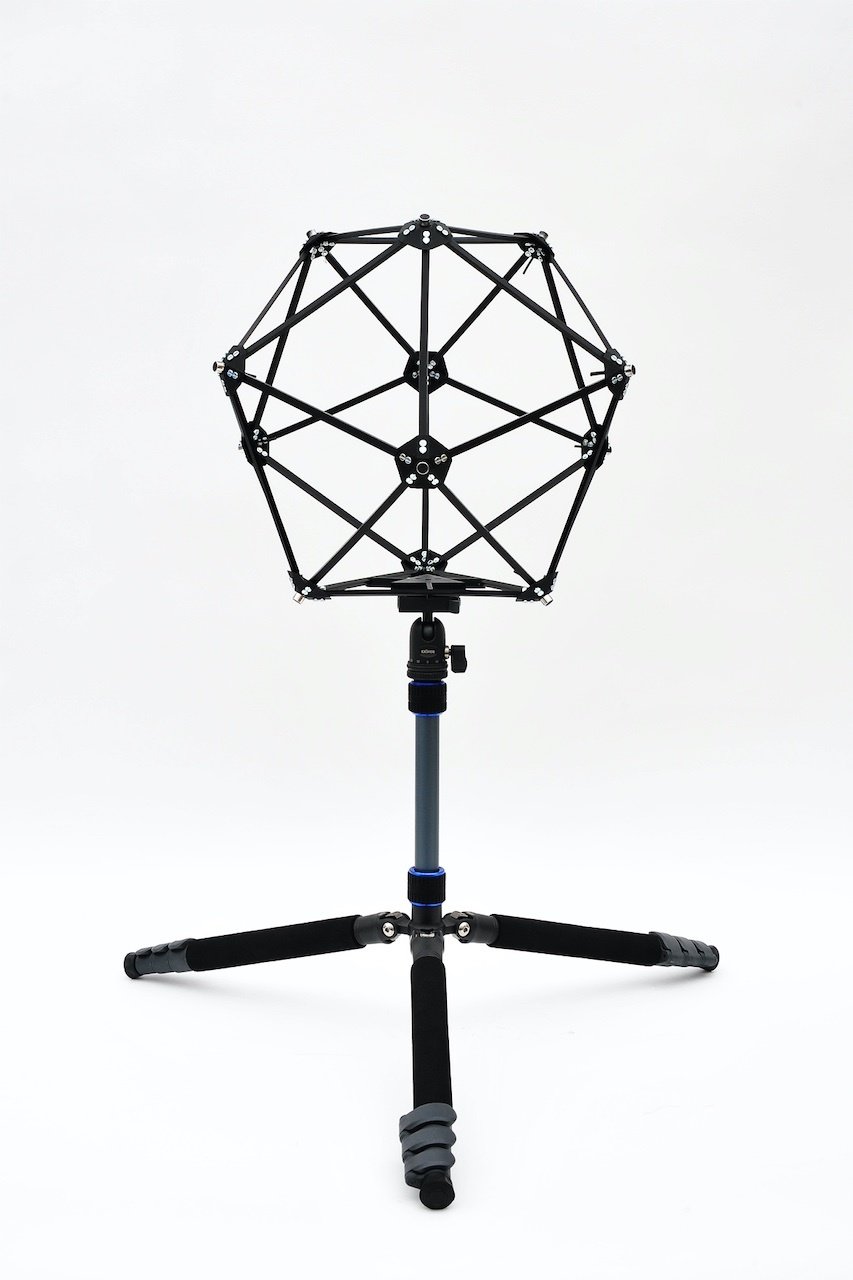
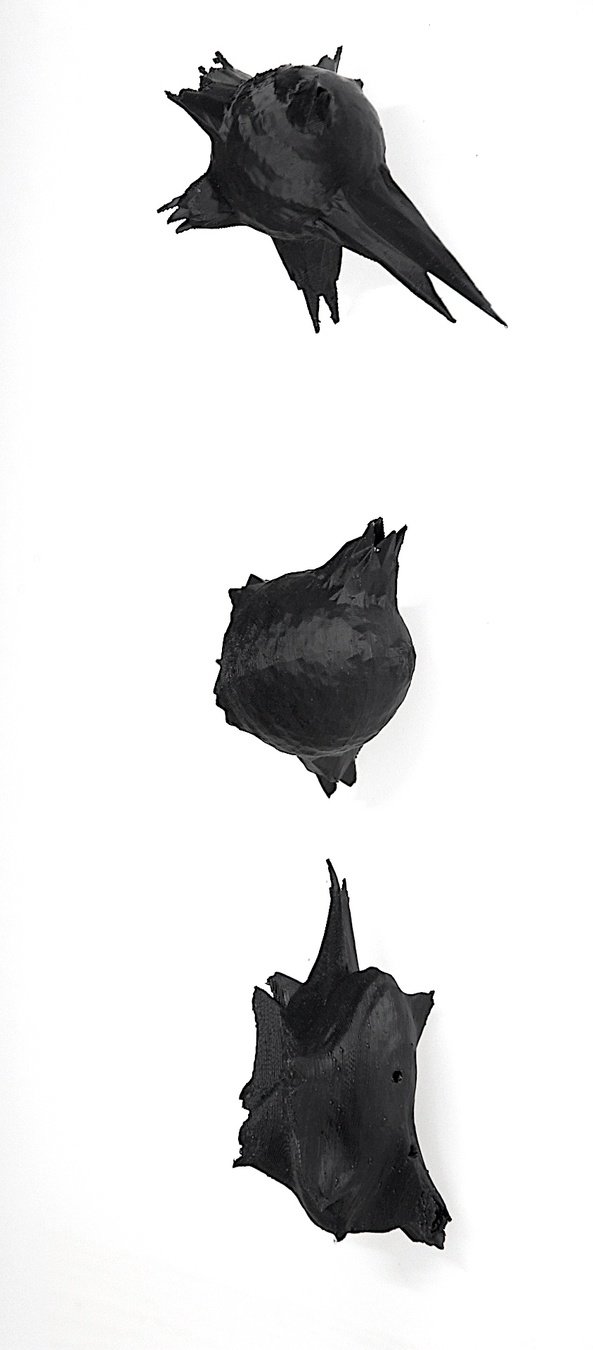
Ong Kian Peng
Acoustic Territories
Paris
2015
Noise
Microphone
SD card
Sound level
Name
Project title
Location
Year
Topic
Sensor
Recording
Number
2021
B-DC 221
Computation in Design 3
Information Design Project
Urban Fieldworks 1

2021
B-DC 221
Computation in Design 3
Information Design Project
Urban Fieldworks 1

2021
B-DC 221
Computation in Design 3
Information Design Project
Urban Fieldworks 1


2021
B-DC 221
Computation in Design 3
Information Design Project
Week 1
Passing through different ambiences and for example
collect numbers and then later make a data visualisation
collect samples and then later make an assemblage from found objects
collect audio fragments and then later make a sound track
collect video snippets and then later make a short video
Numerical data, ask yourself a question like for example
How much, on a scale of 1-10, do i like the place I am visiting right now?
How many photos did I take at the places i visited?
How many people did I see over a period of 5 minutes at the paces I visited / waited for public transportation / queued in line?
How beautiful is a place on a scale of 1-10?
How green is a place on a scale of 1-10?
How many happy people did I count in a particular place over 5 minutes?
We count on you that you can find an exciting and engaging question that eventually leads to your topic and data collection activity in this group exercise.
Other data
Photos, videos, sound recordings, samples, notes
For example
Urban Fieldworks 1
Field trip
Data
Artefact
later
2021
B-DC 221
Computation in Design 3
Information Design Project
Week 1
Urban Fieldworks Starter Kit
Urban Fieldworks 1
2021
B-DC 221
Computation in Design 3
Information Design Project
Urban Fieldworks 1
2021
B-DC 221
Computation in Design 3
Information Design Project
Description
Steps to take
Collecting data
Group work
Idea sparks
Activity fields
Activity plan
Data goal
Checklist
Week 1
Going through the pdf document
Urban Fieldworks 1
The pdf document describes in detail the steps for you required to take. In your group, do read through the pages carefully, then discuss together the approach you want to take to collect your data. If unclear, do consult with your lecturers.
A copy of the pdf comes with the Digital Portfolio you have downloaded.
2021
B-DC 221
Computation in Design 3
Information Design Project
Week 1
The purpose behind the idea sparks is for you to define a scenario for your activity and then to collect and record data. These sparks are suggestions for you to go on a field trip with a purpose in mind, as a starting point to explore and pay closer attention to your surroundings.
What is an idea spark and how can I use it?
Idea sparks are divided into categories, each of which has a number of sub-categories. These are simply suggestions to get the ideation process started and help participants select sub-categories that most inspire them.
What is an idea spark used for?
The Idea Sparks are then used on the next page of the booklet, the activity fields, that define the scenario for your activity to collect data on your field trip.
Idea sparks
Urban Fieldworks 1
Questions you may have
2021
B-DC 221
Computation in Design 3
Information Design Project
Week 1
The purpose of the activity fields is to define how you will conduct your data collection method during your field trip. This will help you narrow down what type of data you will collect, how you will collect it, and where you will collect it.
Activity fields
Urban Fieldworks 1
What am I supposed to do here?
Select one or more sub-categories from section Idea sparks and write them inside the dedicated activity field.
Are there any examples?
See examples on the next slide
Questions you may have
2021
B-DC 221
Computation in Design 3
Information Design Project
Activity fields
Urban Fieldworks 1


1
2
3
4
2021
B-DC 221
Computation in Design 3
Information Design Project
Activity fields
Urban Fieldworks 1

2021
B-DC 221
Computation in Design 3
Information Design Project
Week 1
Based on your activity fields, formulate your activity plan in 100-200 words with your topic in mind. What are you going to do, what methods will you use to execute your plan?
Activity plan
Urban Fieldworks 1
Data goal
What is your objective in collecting comparable numerical data? What will or can you do with the data you collect? This goal can be refined over time.
2021
B-DC 221
Computation in Design 3
Information Design Project
Week 1
Urban Fieldworks 1
The spreadsheet
First row is reserved for labels
Second and all consecutive rows are the data entries
Each data entry consists of
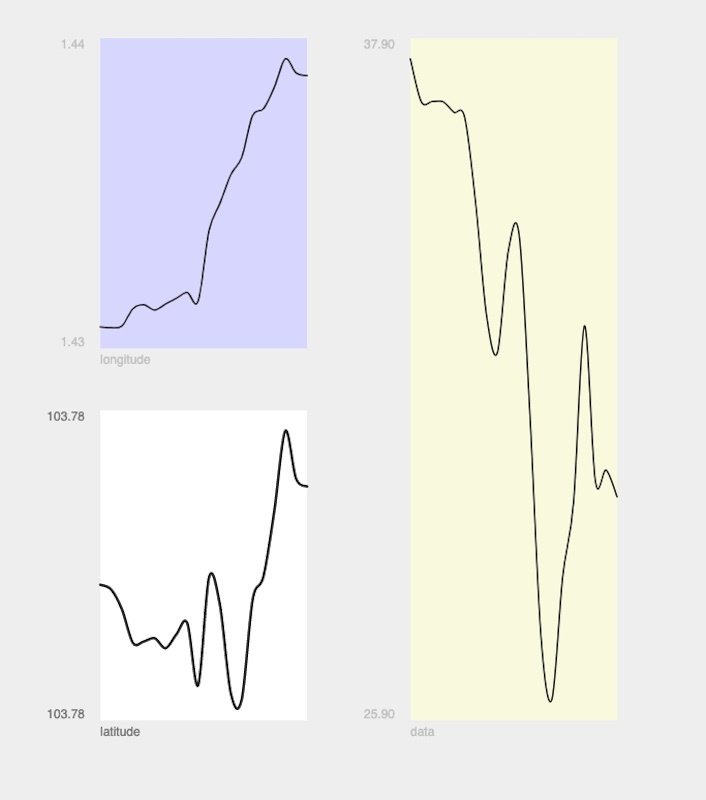
timestamp (YYYY-MM-DD-hh-mm)
latitude (decimal number)
longitude (decimal number)
data (integer or decimal number)
you will find a copy of this spreadsheet document in the Digital Portfolio, edit and record your data from there.
2021
B-DC 221
Computation in Design 3
Information Design Project
timestamp, latitude, longitude, numerical data
What is a timestamp and how do I record it?
A timestamp marks the time that an event occured. To record a timestamp, read the time and date from your phone or watch. Later you will record the time taken in a given format so that it can easily be read by a program. See format to the right.
What is latitude and longitude and how do I record it?
Latitude and longitude are geographical coordinates which can be calculated by a GPS device like your phone. We will need both latitude and longitude in decimal degrees format (DD), usually they come formatted in Degrees Minutes Seconds (DMS) https://www.pgc.umn.edu/apps/convert/
What is numerical data and how do I record it?
numerical data can be an integer or a decimal number, you can record these numbers, together with a timestamp and the geo-location, using a spreadsheet, alternatively write them down on paper or in a mobile app likes Notes. Later when you are back at your desk, transfer your records to a spreadsheet based on the provided template.
What do I photograph or video record or sound record? And why?
This is to document your field trip, you can also use the geo-location feature of your camera app to record these details with each image taken (if enabled and available for your mobile os). One way to extract this information is to manually extract the coordinates from an image using photos and preview (Tools - show inspector) on mac os. In a later session you will need these images and videos for documentation purposes.
Data entries
Urban Fieldworks 1
YYYY-MM-DD-hh-mm
2021-08-19-15-04
decimal
1.4365651667
integer or decimal
12 or 4.75
2021
B-DC 221
Computation in Design 3
Information Design Project
Individually or together where applicable / possible; once or over a period of different days with Covid restrictions and measures in mind.
How to conduct the field trip
Urban Fieldworks 1
Physical
Virtual In case of Covid restrictions.
Virtual field trips can be conducted in Google Maps or similar environments. images and videos can be recorded from screen, browser activities, IP-cameras, etc. Geo-locations can be retrieved from google maps. Be creative, don't see this as a limitation but opportunity.
Alternatively collect data through self tracking, quantified self.
The quantified self refers both to the cultural phenomenon of self-tracking with technology and to a community of users and makers of self-tracking tools who share an interest in "self-knowledge through numbers".
Document your field trip(s) by taking photos, videos, audio recordings if applicable, these can later be used for documentation and the making of the artefact
Collect at least 30 individual data entries per group, a data entry consists of a timestamp, geo location, numerical data see previous slides
There is a spreadsheet template that you should use to record your data see previous slides
2021
Week 1
One of the basic situationist practices is the derive, a technique of rapid passage through varied ambiences. Derives involve playful constructive behaviour and awareness of psychogeographical effects, and are thus quite different from the classic notion of journey or stroll.
B-DC 221
Computation in Design 3
Information Design Project
Theory of the Derive (Debord), 1958.
Derive
Urban Fieldworks 1
2021
B-DC 221
Computation in Design 3
Information Design Project
Breakout into individual groups using Google Meet, students to organise amongst themelves
Zoom meeting remains open
Students can request for assistance in the Zoom chat where they provide their Google Meet link and message their lecturers
until 5:15pm
Week 1
Getting Started
2021
Wrapping up
Week 1
Week 1
Week 2
Field trip to collect numerical data based un Urban Fieldworks pdf
Spreadsheet use the provided template to tabulate numerical data
Field trip documentation can include images, videos, sound recordings, notes
Homework
B-DC 221
Computation in Design 3
Information Design Project
Wrapping up this first session
Any questions regarding exercise or Digital Portfolio
Urban Fieldworks 2
Exercise 1
Week 2
2021
B-DC 221
Computation in Design 3
Information Design Project

Review field trip
Visualise data graph and map
Prepare for Artefact
Work in a group
2021
Week 2
Review field trip
Visualise data graph and map
Prepare for Artefact
Work in a group
In this session we will review your field trips in your respective classes with your respective lecturers first.
B-DC 221
Computation in Design 3
Information Design Project
Urban Fieldworks 2
Select up to 3 images (or videos, sounds, notes) that you took on your field trip and share your experience with your lecturer and peers.
Following the sharing session we will take and visualise your data as a graph and on a map.
At the end of this session each group will have created two visualisation using code.
1
2
In preparation for next week, you will be introduced to a series of examples to create an artefact that expresses your topic and data visually.
3
2021
B-DC 221
Computation in Design 3
Information Design Project
Each group to select up to 3 images (or videos, sounds, notes) that you took on your field trip and share your experience with your peers.
together with and in your respective class until 3:10pm
Week 2
Brief data collection sharing session
1
Urban Fieldworks 2
What went well, what did not go as planned? Briefly explain what your plan and goal was in gathering your numerical data? What can or will you do with this data?
Field Trip
Activity Plan
Data goal
2021
B-DC 221
Computation in Design 3
Information Design Project
Week 2
Data to Code to Graph
Urban Fieldworks 2
Following the sharing session we will take and visualize your data as a graph and on a map.
2
We will do so by transferring your spreadsheet to a .csv formatted file and then upload that file to a series of prepared p5js sketches that you can use as a starting point.
together with your group until 4:30pm
2021
B-DC 221
Computation in Design 3
Information Design Project
Week 2
Urban Fieldworks 2
First step, spreadsheet to .csv
Header
Rows
Columns
Data to Code to Graph
2021
B-DC 221
Computation in Design 3
Information Design Project
Week 2
Urban Fieldworks 2
First step, spreadsheet to .csv
Comma Separated Values, a .csv file
Spreadsheet

Data to Code to Graph
2021
B-DC 221
Computation in Design 3
Information Design Project
Week 2
Urban Fieldworks 2
1. 00:00 create a Google Spreadsheet
2. 00:10 populate spreadsheet with data
3. 00:51 export to csv
4. 01:04 rename downloaded .csv file to data.csv
5. 01:10 upload data.csv file to p5js sketch
6. 01:51 run sketch
First step, spreadsheet to .csv
Note that your dataset contains 4 or more columns instead of the 2 in this demonstration video
Data to Code to Graph
2021
B-DC 221
Computation in Design 3
Information Design Project
Week 2
Data to Code to Graph
Urban Fieldworks 2
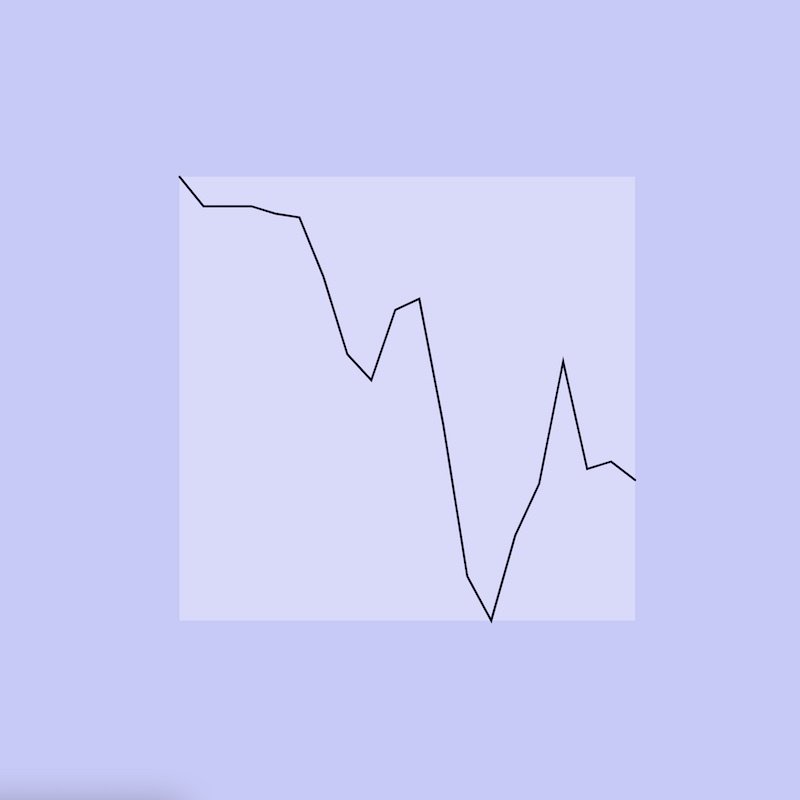
2 Graphs
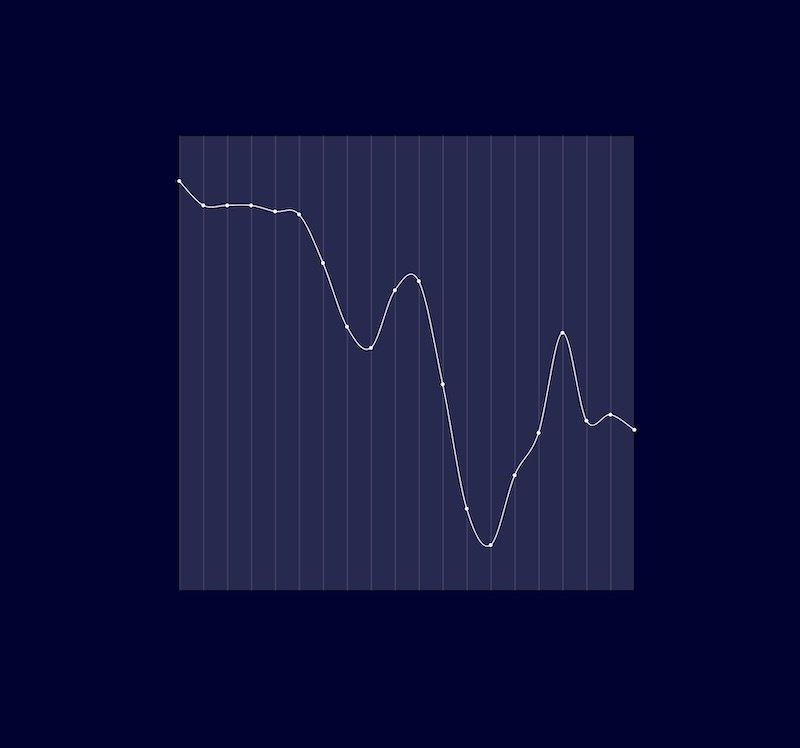
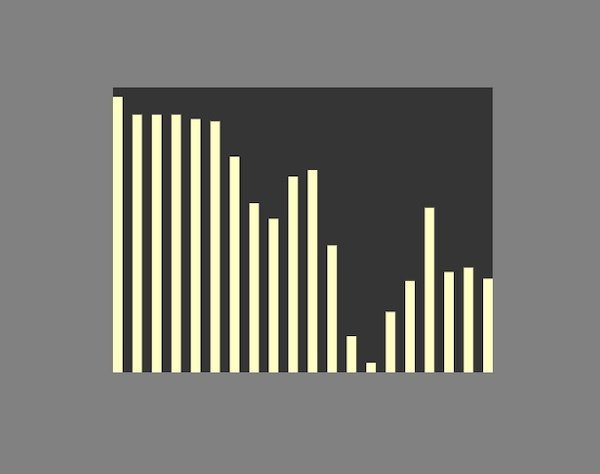
Today we look at 2 basic graphs, the Line Graph and the Bar Graph


But of course there are many more graphs for different purposes and datasets. 2 great starting points are the dataviz-project and the from Data to Viz websites.
2021
B-DC 221
Computation in Design 3
Information Design Project
Week 2
Urban Fieldworks 2
Upload .csv to a p5js sketch
At this point you should have converted your spreadsheet to a .csv file. After you have downloaded the .csv file, rename it to data.csv and upload it to the p5js sketches shared with in the next slide.
Do remember that you can duplicate a sketch and save it to your own p5js account.
Data to Code to Graph
2021
B-DC 221
Computation in Design 3
Information Design Project
Week 2
Data to Code to Graph
Urban Fieldworks 2
Graphs required per group until 4:30pm
Bar Graph
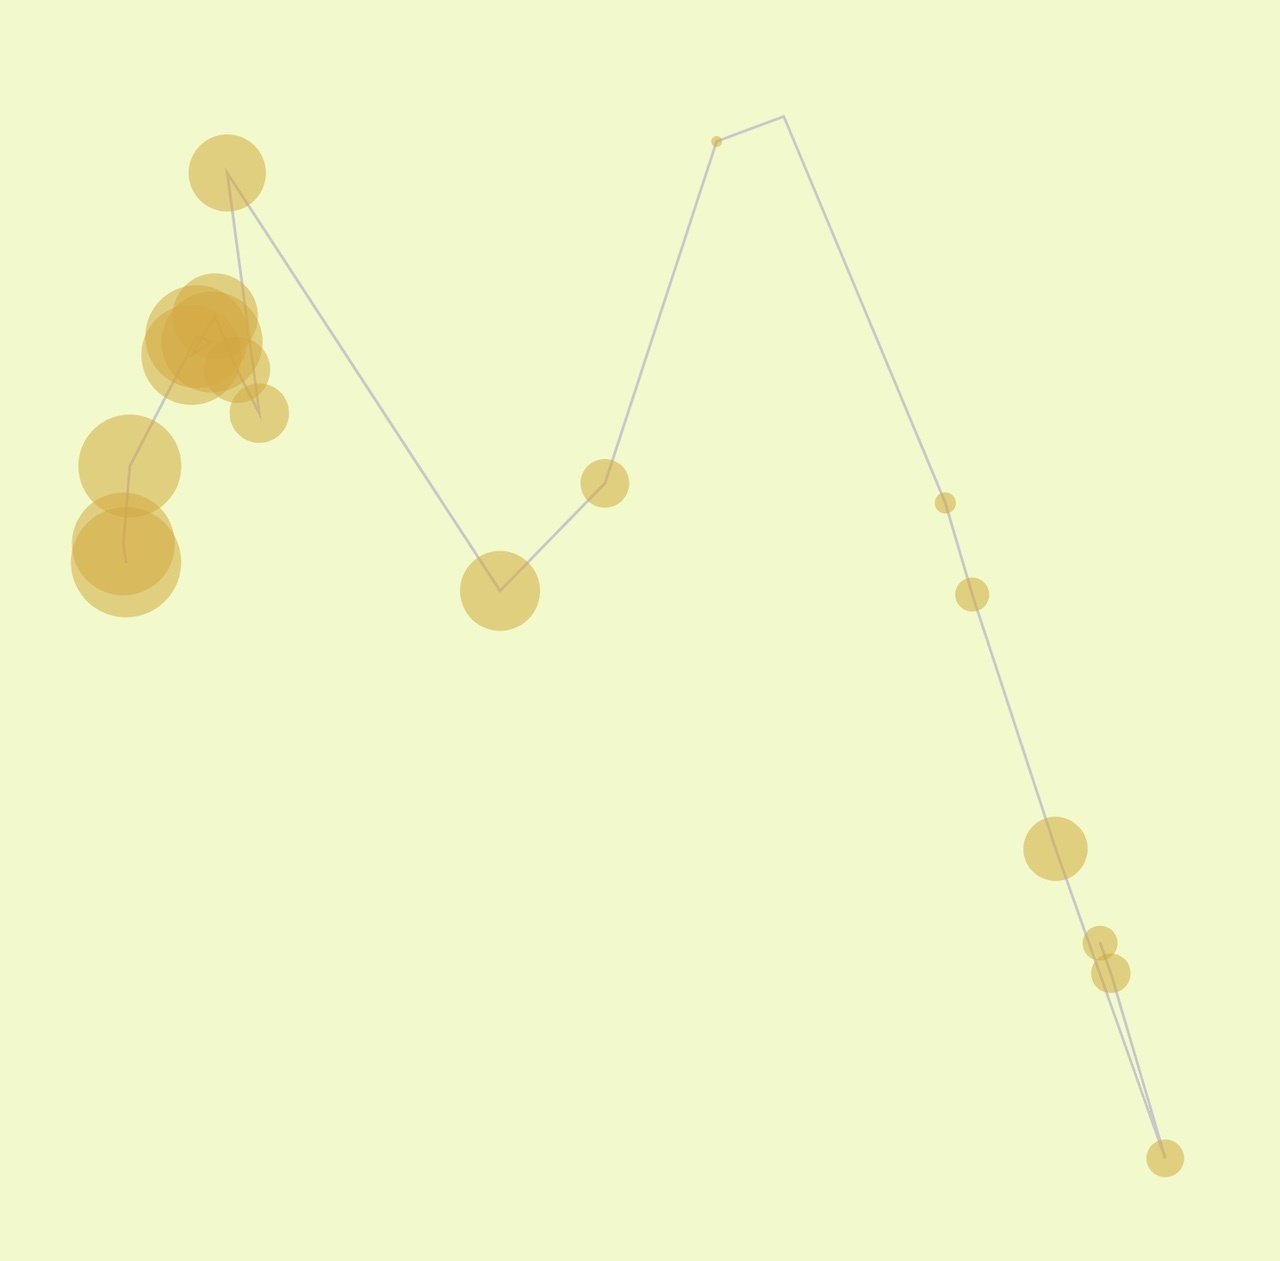
Map
Sketch
Image
Sketch
Image
Line Graph
Sketch
Image
SVG
In your group, work on the following outputs
+
+
Click on an image to open the p5js sketch
2021
B-DC 221
Computation in Design 3
Information Design Project
Week 2
Artefact
Urban Fieldworks 2
Generative and Code
Use code to animate the data you have collected, this can be a purely abstract exploration where numbers for your dataset can be used to control the speed or the size of an animated visual shape. Don't miss out on the Generative Design sketches for inspiration.
Sound
Alternatively, you can use the audio samples you collected on your field trip to create a soundtrack, for example, using the Audacity software or mobile apps such as Bandlab, which allow you to create soundtracks from your own recorded samples.
1
2
3
4
2021
B-DC 221
Computation in Design 3
Information Design Project
Week 2
Artefact
Urban Fieldworks 2
In your group plan and prepare to create an artefact from one of the 4 suggested techniques 1 Drawing Data, 2 Data Physicalization, 3 Generative Code and 4 Sound.
It is best to start soon so that you can complete the artefact in class the following week. Keep time management and feasibility in mind within the given time frame.
Do review and study the References we have prepared for your.
Next week we will spend the first half of the session finalizing the artefact.
Thereafter you will have some time to prepare for a 3 minutes presentation to complete your Urban Fieldworks exercise, do check the checklist on the last page of the booklet.
Artefact ideation until 5:30pm
2021
Wrapping up
Week 2
Week 2
Week 3
Complete coded graphs archive your graph sketches, images, svg files
Decide on a technique for your artefact drawing or dataphys or generative or sound
Identify and bring materials if required for artefact production
Homework
B-DC 221
Computation in Design 3
Information Design Project
Urban Fieldworks 3
Exercise 1
Week 3
2021
B-DC 221
Computation in Design 3
Information Design Project

Finalise artefact
Checklist
Presentation preparation
3 mins presentation
2021
Week 3
In this session you will finalise your Urban Fieldworks artefact during the first 90 minutes which will be part 1 for today.
B-DC 221
Computation in Design 3
Information Design Project
Urban Fieldworks 3
We then continue with the second part that concludes the Urban Fieldworks exercise with a short presentation by each group within their respective class.
The presentation should be kept to 3 minutes only, more details in the following slides.
1
2
Finalise artefact
Checklist
Presentation preparation
3 mins presentation
2021
Week 3
B-DC 221
Computation in Design 3
Information Design Project
Complete your artefact
group work until 4:00pm
Finalise artefact
1
Urban Fieldworks 3
Take a series of photos of your final artefact. Here focus on simple, minimal aesthetics to present your artefact in the best possible way. See samples in the next 3 slides.
2
2021
B-DC 221
Computation in Design 3
Information Design Project
Urban Fieldworks 3

Judith Lee
Panting Trees
Singapore
2012
Temperature
Custom-built tool
SD card
Degrees
2021
B-DC 221
Computation in Design 3
Information Design Project
Urban Fieldworks 3


Patrick Kochlik
Scentscapes
Singapore
2012
Scent
Nose Henning's Odour System
Paper
Scale 1-10
2021
B-DC 221
Computation in Design 3
Information Design Project
Urban Fieldworks 3
Ong Kian Peng
Acoustic Territories
Paris
2015
Noise
Microphone
SD card
Sound level

2021
Week 3
B-DC 221
Computation in Design 3
Information Design Project
Check Checklist
group work until 4:30pm
Prepare your 3 minutes presentation
1
Urban Fieldworks 3
Prepare to address the following 4 points in your presentation later
2
Give a brief overview of places visited and data collected (verbally, map if available)
1
What could be observed from the data when visualised? What information can be extracted from the data?
From a series of 6 images give a meaningful visual impression of your field trip (select 3 images), data visualised (2) and the artefact (1)
What is the message that the artefact communicates?
2
3
4
You do not need to prepare a powerpoint presentation but you can take a more casual approach to present your outcomes
2021
Week 3
B-DC 221
Computation in Design 3
Information Design Project
Each group to present their outcomes in a 3 minutes presentation. The presentation does not have to be in powerpoint format but you can share your work by showing data and images on your screen.
groups to present in their respective classes from 4:30pm to 5:30pm
Presentation
1
Urban Fieldworks 3
This concludes the Urban Fieldworks exercise, take a look at the next slide for homework details.
2
2021
Wrapping up
Week 3
Week 3
Week 4
As a group, organise materials see Digital Portfolio folder exercise-1-urban-fieldworks
Update your Digital Portfolio
Review your p5js skills start with Getting Started with p5js and last year's slides
Homework
B-DC 221
Computation in Design 3
Information Design Project
Week 4
Data and Code 1
2021
Exercise 2
B-DC 221
Computation in Design 3
Information Design Project
2021
Week 4
In today's session we will look at three types of graphs: line, bar and donut.
B-DC 221
Computation in Design 3
Information Design Project
Data and Code 1
3 Graphs
In the first part, each group will conduct a short study of these three graphs and their characteristics. We conclude this part with a short sharing session in each respective class.
1
2
Graph from Data
The second part requires each group to visualise one provided data set using code and pen and paper where necessary.
3
Line
Bar
Donut
2021
Week 4
B-DC 221
Computation in Design 3
Information Design Project
In your group, review the 3 graphs listed on the left and identify where each finds its best application when visualising data.
Line
Bar
Donut
Data and Code 1
The referenced websites below give you a great overview of graphs used to visualise data. Each website given has its own focus, each with its own valuable insights.
3 Graphs
A detailed breakdown of what you should cover is outlined in the following slide.
2021
Week 4
B-DC 221
Computation in Design 3
Information Design Project
Line
Bar
Donut
Data and Code 1
group work until 3:45pm
3 Graphs
Discuss and describe each graph in 30-70 words. Then, what kind of data 1) in your opinion would be a good fit for each? discuss in your group and give examples.
1
Extract pros and cons for each graph from the referenced websites to your best knowledge and understanding.
2
From the referenced websites, which graph other than line, bar, pie is the most interesting, appealing to you? Elaborate 2) on this with images and written words.
3
1) data here refers to numeric data. Based on the referenced webpages provided, what data set examples a good fit for a line, bar and donut graph?
You can use a Google docs document here, organise and design your document as you see fit.
2) Criteria for your choice here can include aesthetics, readability, message communicated
If you have questions, do approach your lecturers.
2021
Week 4
B-DC 221
Computation in Design 3
Information Design Project
Data and Code 1
Graph from Data
2021
Week 4
B-DC 221
Computation in Design 3
Information Design Project
Data and Code 1
Graph from Data
2021
Week 4
B-DC 221
Computation in Design 3
Information Design Project
Data and Code 1
Graph from Data
Use p5js to create a graph from a data set that is provided with the links to the left. Select a data set that sparks your interest.
1
Review the data set you find most interesting and download the data as .csv file. Then, extract the data that you want to visualise. You can use a Googgle Spreadsheet. Here, organise the data into their respective columns.
2
Download the spreasheet as .csv and transfer .csv data to your p5js sketch and visualise data. See how-to video in the next slide
3
Take inspiration from the referenced websites in the previous slides
Take inspiration from one of the references shared with you in the previous slides. Use p5js and pen and paper to enhance your datavis.
4
What are the limitations you are facing?
How can you show the limitations you are facing with pen and paper?
How to organise and format? See video in the next slide.
2021
Week 4
B-DC 221
Computation in Design 3
Information Design Project
Data and Code 1
Graph from Data
Data to spreadsheet to p5js
1. 00:00 create a Google Spreadsheet
2. 00:10 populate spreadsheet with data
3. 00:51 export to csv
4. 01:04 rename downloaded .csv file to data.csv
5. 01:10 upload data.csv file to p5js sketch
6. 01:51 run sketch
Spreadsheet to .csv
2021
Week 4
B-DC 221
Computation in Design 3
Information Design Project
Data and Code 1
Graph from Data
Criteria
Design and aesthetics
Readability
Message communicated
Sufficient data present
Is it too little or even too much data. If you intend to compare data, you probably need to show more than one data set together
Aesthetically pleasing, limited clutter, good use of color contrast; minimal and simple, avoid chart junk (Tufte, 1983)
clarity; visual choices appropriate to the audience for the message being conveyed
Message clearly conveyed by the visualization, effective communication
group work until 5:15pm
If you have questions, do approach your lecturers.
2021
Wrapping up
Week 4
Week 4
Week 5
Homework
B-DC 221
Computation in Design 3
Information Design Project
Week 5
Data and Code 2
2021
Exercise 2
B-DC 221
Computation in Design 3
Information Design Project
Recap
Review graph sketch
Interpretation of a graph
Show-and-tell
Week 5
We looked at 3 types of graphs last week:
Line, Bar and Donut graph. Some takeaway points:
Shares of a whole, good for small amount of data which totals to 100%
May be difficult to read and analyse data because of angles
boring vs. visually pleasing
readability vs. cluttered, decorative, chartjunk
message communicated?
Donut
Good for time related data and trends
Very common and familiar to users, suitable for comparing data
The clean uniformity of data as blocks imposes simplicity on complex topics
Can be visually boring
Line
Bar
Data and Code 2
Recap
2021
B-DC 221
Computation in Design 3
Information Design Project
Week 5
We looked at 3 types of graphs last week:
Line, Bar and Donut graph. How do we find the right balance and make the right choices?
Data Ink Ratio
Visually pleasing
Data and Code 2
Recap
2021
B-DC 221
Computation in Design 3
Information Design Project
Week 5
group work until 3:45pm
Data and Code 2
Review graph sketch
Each group to review their graph sketch
What does the graph tell you and what should it tell the user?
What is missing from the graph as currently shown in your p5js sketch?
Sketch on paper what improvements can be made to improve the readability of your graph? Make adjustments in code or later in the following step, in software.
Then, export the graph as .svg or .png and add improvements in software
1
2
3
4
Activity 1
2021
B-DC 221
Computation in Design 3
Information Design Project
Week 5
Data and Code 2
Review graph sketch
Olympics
Dogecoin
Dogecoin
group work until 3:45pm
2021
B-DC 221
Computation in Design 3
Information Design Project
Week 5
Data and Code 2
Review graph sketch
The following outcomes are required:
group work until 3:45pm
.svg or .jpg file with additions made in Illustrator or Photoshop
Revised p5js sketch, update spreadsheet column E
1
2
Activity 1
2021
B-DC 221
Computation in Design 3
Information Design Project
Week 5
Based on the topic, the data set you chose, and the graph you created, how would you express visually and through code the underlying message, insights gained, and/or conclusions drawn?
This is a purely visual exercise. Think of the approach here as a coded illustration, a sketch that can be explored interactively, or a data visualization that can be considered visually appealing.
group work until 5:15pm
Data and Code 2
Interpretation of a graph
Activity 2
2021
B-DC 221
Computation in Design 3
Information Design Project
Week 5
Data and Code 2
The following outcomes are required:
p5js sketch, update spreadsheet column F
1
Interpretation of a graph
group work until 5:10pm
Activity 2
2021
B-DC 221
Computation in Design 3
Information Design Project
2021
Wrapping up
Week 5
Week 5
Week 6
Homework
B-DC 221
Computation in Design 3
Information Design Project
Week 6
Data and Code 3
2021
Sensemaking
B-DC 221
Computation in Design 3
Information Design Project
Presentation and activities prepared by Vikas Kailankaje
Week 5
Last week we revisited your data graph sketches and you were then tasked to create a second p5js sketch that interprets findings from the data when visualised.
Data and Code 3
Recap
If you have not updated the group findings spreadsheet yet please do so before class ends today.
If you have used and modified code that you found online, do give credit to the original author. You can do so by adding a comment on top of the sketch including name and original URL.
2021
B-DC 221
Computation in Design 3
Information Design Project
Week 6
For the session in week 7 you should prepare the following materials which you will then document in a website format provided as a template.
Data and Code 3
Prepare for week 7
1. Field trip documentation
2. Activity fields and Data goal
3. Data
4. Artefact
5. p5js sketches (map, graph)
6. Short description derived from your presentation
7. Title
Urban Fieldworks
1. Google docs document 3 graphs
2. Data
3. p5js sketches (graph, interpretation)
4. Short description of findings in the data
5. Reflection on reasoning behind your data interpretation sketch
6. Title
Code and Data
~ 50-70 words
~ 50-70 words
~ 70-100 words
2021
B-DC 221
Computation in Design 3
Information Design Project
Images, videos, notes
Words
Spreadsheet
Images, video if applicable
Link(s), images
Words and images
Spreadsheet
Link(s), images, svg
2021
Wrapping up
Week 6
Week 6
Week 7
Homework
B-DC 221
Computation in Design 3
Information Design Project
Week 7
2021
Exercise 3
B-DC 221
Documenting term 1
Computation in Design 3
Information Design Project
Data and Code 4
2021
Week 7
Concluding term 1 exercises
Data and Code 4
With today's session we will conclude the group exercises. From week 9 onwards you will work on your individual project.
The methodology will be very similar to that used in the previous weeks. Your individual project will revolve around the topics and techniques we have covered so far. The last step we will take today is to document exercises in a website format.
B-DC 221
Computation in Design 3
Information Design Project
2021
Week 7
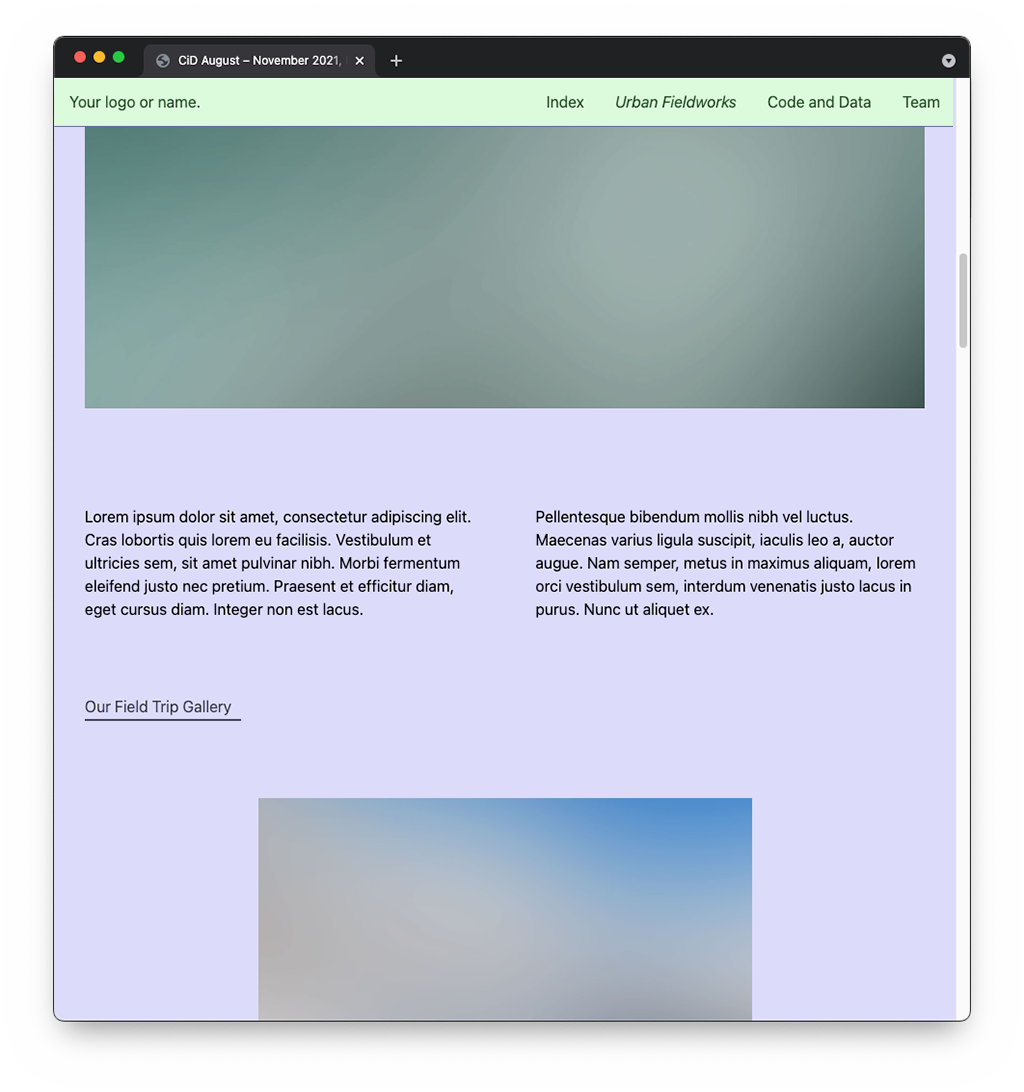
Website Template
Data and Code 4
The template provides you with a multi-page website. The following changes should be made to the HTML files here:
Images
Text
Stylesheets
The images used in the template come in 4 formats:
16:9 (1920x1080), 1x1 (1080x1080), 4x3 (1280x960), 3x2 (1536x1024)
Prepare your images in the specified formats and pay attention to image compression when exporting. The images are located in the assets folder. You must then manually change the file names in the HTML document. Image types here include jpg, png and svg
Replace the text used in the template with your own. Some of the placeholder text fragments contain suggestions you should follow, others are lorem ipsum so you can get a feel for how the text will look in the layout before you replace it with your own.
To make changes to the stylesheets used in the template, go to the styles.css file. Here you can make changes to the font family, font size, and color. You must be familiar with these changes and understand where these styles are used in the HTML documents when applied to HTML elements as classes. Although challenging, this can be visually rewarding.
B-DC 221
Computation in Design 3
Information Design Project
2021
Week 7
Website Template
Data and Code 4
Brackets Editor
You will need to work with a text editor to make changes to the html and css documents. We have practiced this in the previous semester, hence you should be familiar with the Brackets Text Editor (see next slide). There is a short video in the next slide that guides you through the steps from downloading to changing text and coding in html and css.
Browser
The Brackets editor allows you to Auto-Preview your website while you are making changes. When Preview is active, changes are reflected in the browser which serves the website template. When you activate the Preview (flash-icon top-right corner) your default browser will automatically open.
B-DC 221
Computation in Design 3
Information Design Project
2021
Week 7
Data and Code 4
The Brackets Text Editor
This video shows how to download the brackets.io app to open and edit html and css files. Changes can then be viewed in the browser using bracket's live preview option (top right corner flash-icon).
Watch the video in fullscreen mode for better readability.
B-DC 221
Computation in Design 3
Information Design Project
2021
Week 7
Data and Code 4
How to make changes in HTML and CSS

Activate Live Preview
Make changes to html and css files
Brackets Text Editor
Browser
B-DC 221
Computation in Design 3
Information Design Project
2021
Week 7
Data and Code 4
How to prepare materials and make changes to the template within your group
Share the workload.
Images
One of you should prepare the images so they fit the required image formats. The images used in the template come in 4 formats:
16:9 (1920x1080), 1x1 (1080x1080), 4x3 (1280x960), 3x2 (1536x1024)
These are the formats that you should be using as well. Make sure you compress images when exporting and give each image a useful name (and avoid spaces, use - or _ instead)
Text
The next group member should then focus on preparing text. It is best to review the website template and then make notes or a sketch on paper so it is clear which text element goes where. Prepare a digital document (.docx or .txt) accordingly with all text elements inside, then pass it to your group member who will implement images and text into the template.
Code
The group member who is in charge of adding text and images to the template should be familiar with the Text Editor and comfortable with making changes to the html and css documents. Basic changes required: replace and change text and headlines, replace images, replace p5js sketch. If you are more confident to make changes to the stylesheets, take a look at the styles.css file and change colors and font properties.
Delete images from the assets folder that you don't need.
Use Google Docs to share text and links amongst your group.
Use Google Drive to share all files and images
Fetch images and text from Google Drive and Google Docs and then add to the website folder and the html documents.
B-DC 221
Computation in Design 3
Information Design Project
2021
Week 7
Data and Code 4
Issues
There will be issues, html.
You will have to make change to the existing code blocks in html and as a second step you will have to copy and paste code blocks from the html documents to add more content.
When facing issues, error messages, or things don't work, try to analyse and understand first what might be the cause.
Did you copy paste wrongly? This may have caused the html structure to be mixed up and to display wrongly. Try to go back by using the undo function.
There will be issues, css.
You are not able to make changes to the design? Did you make changes to the styles.css file? this is where the html elements are styled (designed), here you can make changes to font styles and color.
To add style changes in html, you have to make changes to an html elements class attribute in order for a style to apply, see code below
<h2 class="heading__sub-2">Line</h2>

<h2 class="heading__sub-2 fg__red">Line</h2>

<!-- add fg__red to the class attribute
to change headline color -->
B-DC 221
Computation in Design 3
Information Design Project
2021
Week 7
Data and Code 4
Issues
When in doubt or stuck, consult your lecturers to help.
You can do so by posting a message in the chat and we can look at the problem over Zoom. Or, lecturers can assist you face to face (with necessary social-distancing).
Issues aside.
You and your group should be able to make changes to the content (text, images, links, p5js sketches) by replacing the existing placeholders. The next step is to make changes to the css styles to adjust colors and fonts to your preference. Based on last semester's website exercise, you should have a basic technical understanding of this exercise.
Sharing content
Use Google Drive to share all files and images, use Google Docs to share text and links amongst your group.
B-DC 221
Computation in Design 3
Information Design Project
2021
Week 7
Data and Code 4
How to bring your website online
This video demonstrates how to use Netlify to host your website.
After signing up for a free account you can upload your website folder to your account and host it publicly as a sub-domain on netlify.
B-DC 221
Computation in Design 3
Information Design Project
2021
Wrapping up
Week 7
Week 7
Week 9
Share the link to your website in this Spreadsheet under column G
Complete your group website
Update your Digital Portfolio
Homework
B-DC 221
Computation in Design 3
Information Design Project
Week 9
2021
Project
B-DC 221
Briefing and Ideation
Computation in Design 3
Information Design Project
(De)coding Data 1
(De)coding Data is a self-directed project in which students start from a selected or generated data set to develop visual representations that provide access to and insights into the hidden patterns, details, information and meaning that the dataset can reveal.
Week 9
2021
B-DC 221
Computation in Design 3
Information Design Project
For this project, you will create a multi-page website that visualises, contextualises, and interprets a dataset of your choosing.
Following the exercises conducted in term 1, you will work either with data you have collected yourself, such as in the Urban Fieldworks project, or with a dataset available from an online resource, as practiced in the Code and Data exercise.
After you have selected the data you want to work with, the next steps will involve visualising the data in the form of one or more charts, as practiced in the earlier sessions.
You will analyse the data and its context and elaborate your findings visually and in writing. Based on your findings, you then create an artefact that interprets your results.
(De)coding Data 1 Briefing and Ideation
Project
2021
B-DC 221
Computation in Design 3
Information Design Project
Choose data set
Visualise data
Analyse data
Interpret data
1
2
3
4
document and share
5
Week 9
by Week 10
by Week 11
by Week 12
by Week 13
Collect your own data or use a data set from an online resource, then format and convert the data that you want to work with into a spreadsheet.
(De)coding Data 1 Briefing and Ideation
Use a p5js sketch or other tools to visualise your data. Pay attention to your design decision. Use Illustrator to refine your design outcomes. You can consider to make your datavis interactive.
From the data visualisation you have created, what are the findings that you can reveal and wish to highlight through your work and in relation to the data's context. What should be the takeaways for the user?
Create an artefect based on your findings. The artefact can be a drawing, a data physicalisation, or created in code.
Share your multi-page website that documents and presents your findings and developments above
data
spreadsheet
datavis
svg
findings in writing, images, references, (coded) sketches
artefact
code or object
website
What
How
When
Deliver
2021
B-DC 221
Computation in Design 3
Information Design Project
(De)coding Data 1 Briefing and Ideation
Visual design
Code and aesthetics
Context and narrative
Project
2021
B-DC 221
Computation in Design 3
Information Design Project
(De)coding Data 1 Briefing and Ideation
Points of Contact
Visual design
Code and aesthetics
Context and narrative
Andreas Kian Peng
Clara Vikas
Yasser Olivia
Project
2021
B-DC 221
Computation in Design 3
Information Design Project
(De)coding Data 1 Briefing and Ideation
Starting Points Choose Data Set
Project
2021
B-DC 221
Computation in Design 3
Information Design Project
(De)coding Data 1 Briefing and Ideation


Starting Points Visualise Data

Project
2021
B-DC 221
Computation in Design 3
Information Design Project
(De)coding Data 1 Briefing and Ideation
Alternative tools to Visualise Data
Project
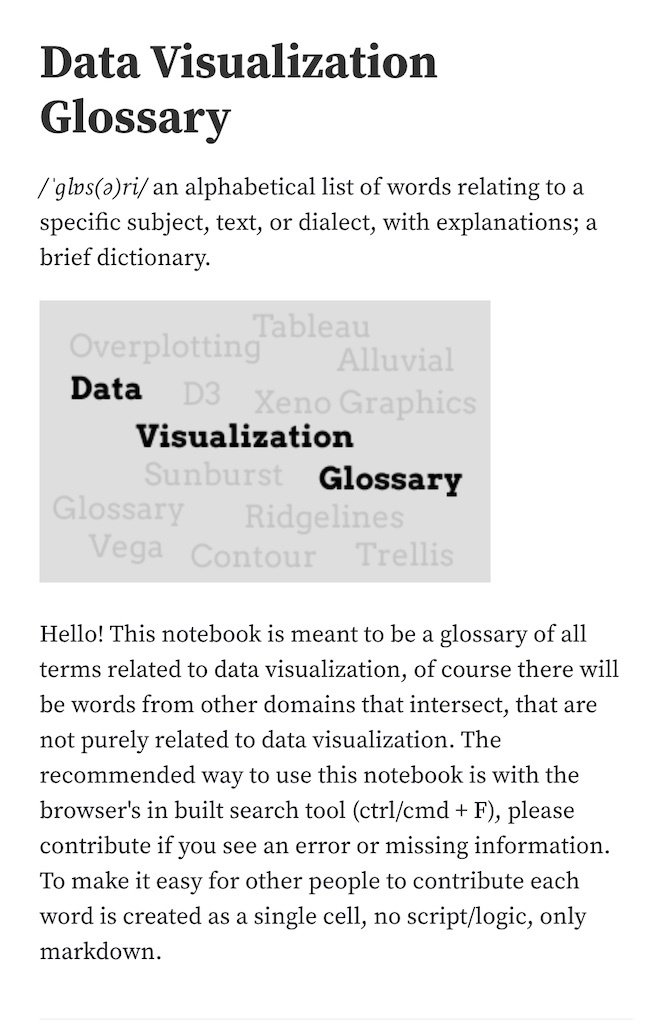
Data Visualization Glossary
2021
B-DC 221
Computation in Design 3
Information Design Project
(De)coding Data 1 Briefing and Ideation
Choose data set
Visualise data
Analyse data
Interpret data
1
2
3
4
document and share
5
Week 9
by Week 10
by Week 11
by Week 12
by Week 13
Collect your own data or use a data set from an online resource, then format and convert the data that you want to work with into a spreadsheet.
Use a p5js sketch or other tools to visualise your data. Pay attention to your design decision. Use Illustrator to refine your design outcomes. You can consider to make your datavis interactive.
From the data visualisation you have created, what are the findings that you can reveal and wish to highlight through your work and in relation to the data's context. What should be the takeaways for the user
Create an artefect based on your findings. The artefact can be crafted by hand, a drawing, a data physicalisation, or created in code.
Share your multi-page website that presents your findings and developments above
data
spreadsheet
datavis
svg
findings in writing, images, references, (coded) sketches
artefact
code or object
website
Wrapping up Week 9 Homework
Project
Week 10
2021
Project
B-DC 221
Visualise Data
Computation in Design 3
Information Design Project
(De)coding Data 2
Now that you have collected your own data or used a data set from an online resource, you should format the data you want to work with and convert it to a spreadsheet.
Then use a p5js sketch or other tools to visualize your data. Pay attention to your design choices. Use Illustrator or other tools you feel comfortable with to refine your design outcomes. You may consider making your datavis interactive.
2021
B-DC 221
Computation in Design 3
Information Design Project
Choose data set
Visualise data
Analyse data
Interpret data
1
2
3
4
document and share
5
Week 9
by Week 10
by Week 11
by Week 12
by Week 13
Collect your own data or use a data set from an online resource, then format and convert the data that you want to work with into a spreadsheet.
(De)coding Data 2 Visualise Data
Use a p5js sketch or other tools to visualise your data. Pay attention to your design decision. Use Illustrator to refine your design outcomes. You can consider to make your datavis interactive.
From the data visualisation you have created, what are the findings that you can reveal and wish to highlight through your work and in relation to the data's context. What should be the takeaways for the user?
Create an artefect based on your findings. The artefact can be a drawing, a data physicalisation, or created in code.
Share your multi-page website that documents and presents your findings and developments above
data
spreadsheet
datavis
svg
findings in writing, images, references, (coded) sketches
artefact
code or object
website
What
How
When
Deliver
2021
B-DC 221
Computation in Design 3
Information Design Project
(De)coding Data 2 Visualise Data
Numbers
Spreadsheet, .csv
coded graph
.svg p5js sketch
select data
format
visualise
present
p5js
other datavis tools
illustrator
2021
B-DC 221
Computation in Design 3
Information Design Project
Points of Contact and Feedback
Visual design
Code and aesthetics
Context and narrative
Andreas Kian Peng
Clara Vikas
Yasser Olivia
Project
We have split the feedback into three areas. Do be pro-active to consult with your lecturers depending on the feedback you wish to receive.
(De)coding Data 2 Visualise Data
2021
B-DC 221
Computation in Design 3
Information Design Project
Project
References
Use the references we provide as a guide to good practices and a pool of resources to learn from.
We have introduced you to and practiced basic principles of data visualisation. By analysing and studying the references given, you will develop a better understanding of how data can be visualised.
In the examples provided, this is achieved through the thoughtful use of simple aesthetic means that allow the user to best read, understand, and even interact with data. Pay special attention to color, typography, clarity and the appropriate type of data graph(s) to use in your particular case.
For example study one or more articles from the kontinentalist website. These are elegant and well designed solutions to present data through an engaging narrative (visually as well as in writing).
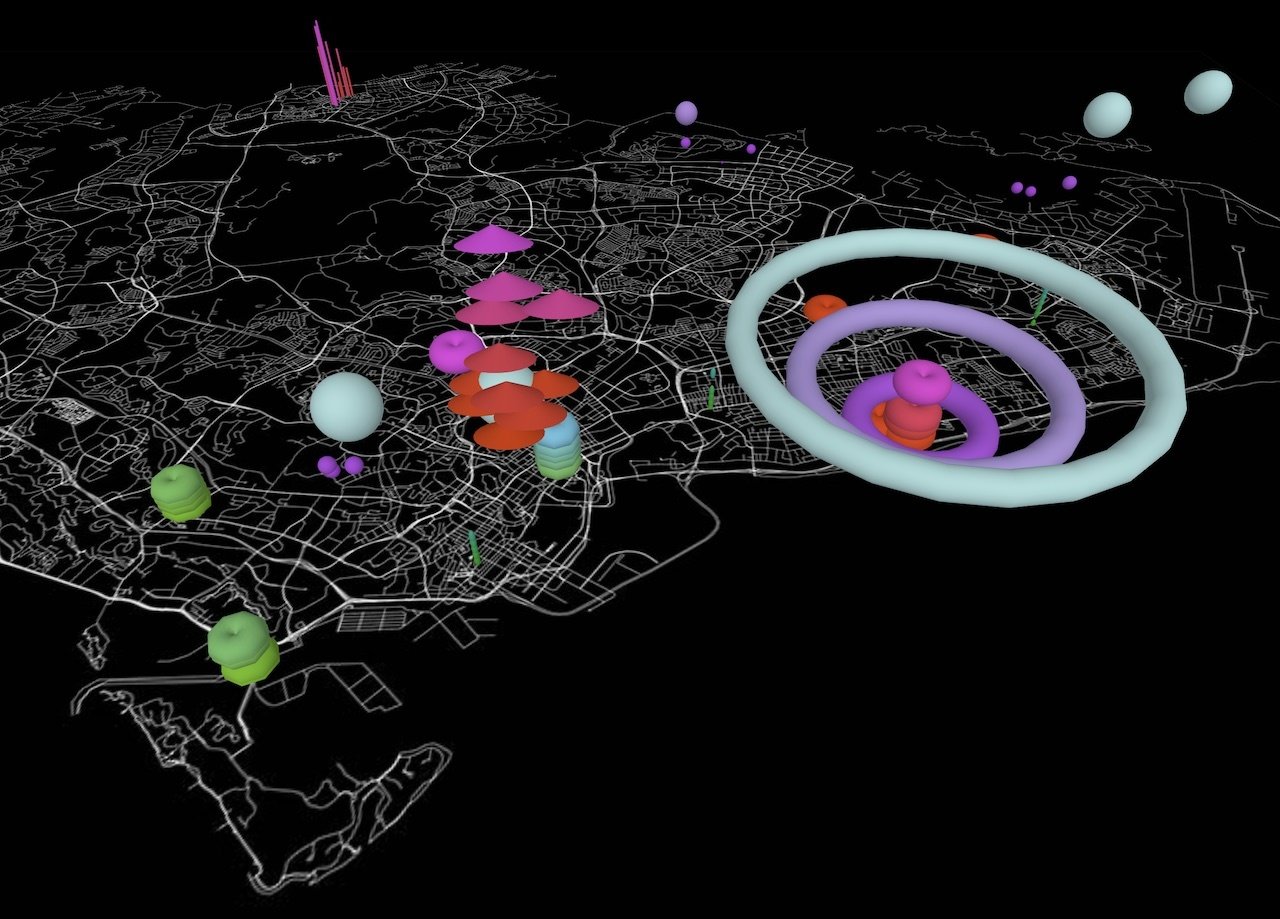
Take some of the many case studies from the Senseable City Lab (1, 2, 3) and pay attention to the design of the experience, how the story of data is told, use of colors and typography, interactivity. Don't miss out on the publication document for more details.
Take a look at the works of Giorgia Lupi and her involvement at Pentagram and notice the different approaches taken for the projects listed. Browse through and study Federica Fragapane's beautiful and illustrative data visualisations compared to Moritz Stefaner's or Nathan Lau's more minimal approach.
(De)coding Data 2 Visualise Data
2021
B-DC 221
Computation in Design 3
Information Design Project
Project
Guidelines
Let's take a look at Pentagram's IBM Data Visualisation Guidelines and use them as a case study to learn from how to create meaningful, consistent and effective data visualisations. "The design team behind this project made it possible for more than a thousand designers to create data visualisations that consistently reflect the look and feel of the parent brand".
Follow the links below to explore and study IBM's design guidelines, their applications, and the thinking behind them and eventually establish simple guidelines for yourself that you can apply to your project.
Take your time to read and go through the following sections to study and learn from: data visualisation overview, best practices, design, usage, color, typography, layout, animation.
(De)coding Data 2 Visualise Data
2021
B-DC 221
Computation in Design 3
Information Design Project
Project
Coding
At least one component of this project requires a coded element and you must show this in the final outcome, the web page.
You can choose to use a coded sketch for your data visualisation or your artefact, or both.
In exercise 1, Urban Fieldworks, some of you experimented with code to create an artefact. The code contributed to either a screen-based solution or an object-based outcome.
In the second exercise, you all used a coded sketch to create a graph from the data you used, and in addition, you used code to interpret the data.
(De)coding Data 2 Visualise Data
2021
B-DC 221
Computation in Design 3
Information Design Project
Project
Checklist
Aesthetics
Color
Data
Graph
Readability
Typography
focus on minimal first, then consider illustrative
minimal, use a color palette, consider the background to be neutral
enough, not too little not too much
should suit data and context
clear and effective
pay attention to font type, size, proportion
(De)coding Data 2 Visualise Data
Visualise Data
2021
B-DC 221
Computation in Design 3
Information Design Project
Project
Design makes a difference

(De)coding Data 2 Visualise Data
2021
B-DC 221
Computation in Design 3
Information Design Project
Choose data set
Visualise data
Analyse data
Interpret data
1
2
3
4
document and share
5
Week 9
by Week 10
by Week 11
by Week 12
by Week 13
Collect your own data or use a data set from an online resource, then format and convert the data that you want to work with into a spreadsheet.
Use a p5js sketch or other tools to visualise your data. Pay attention to your design decision. Use Illustrator to refine your design outcomes. You can consider to make your datavis interactive.
From the data visualisation you have created, what are the findings that you can reveal and wish to highlight through your work and in relation to the data's context. What should be the takeaways for the user
Create an artefect based on your findings. The artefact can be crafted by hand, a drawing, a data physicalisation, or created in code.
Share your multi-page website that presents your findings and developments above
data
spreadsheet
datavis
svg
findings in writing, images, references, (coded) sketches
artefact
code or object
website
Wrapping up Week 10 Homework
Project
(De)coding Data 2 Visualise Data
Week 11
2021
Project
B-DC 221
Analyse Data
Computation in Design 3
Information Design Project
(De)coding Data 3
In today's session we will review your data visualisation outcomes. The data part of your project should conclude today so that we can move forward into the next phase, to analyse the data you are working with. This can now be done by looking at your visualisations instead of numbers only.
Your analysis should be done in writing and can be supported by images as well if necessary. See the following slides for more details.
2021
B-DC 221
Computation in Design 3
Information Design Project
Choose data set
Visualise data
Analyse data
Interpret data
1
2
3
4
document and share
5
Week 9
by Week 10
by Week 11
by Week 12
by Week 13
Collect your own data or use a data set from an online resource, then format and convert the data that you want to work with into a spreadsheet.
(De)coding Data 3 Analyse Data
Use a p5js sketch or other tools to visualise your data. Pay attention to your design decision. Use Illustrator to refine your design outcomes. You can consider to make your datavis interactive.
From the data visualisation you have created, what are the findings that you can reveal and wish to highlight through your work and in relation to the data's context. What should be the takeaways for the user?
Create an artefect based on your findings. The artefact can be a drawing, a data physicalisation, or created in code.
Share your multi-page website that documents and presents your findings and developments above
data
spreadsheet
datavis
svg
findings in writing, images, references, (coded) sketches
artefact
code or object
website
What
How
When
Deliver
2021
B-DC 221
Computation in Design 3
Information Design Project
DataVis
Graph(s)
Context
Description
Findings
Insights
Conclusion
Data Interpretation
complete
formulate
identify
prepare and develop
(De)coding Data 3 Analyse Data
.svg
p5js sketch(es)
Writing, images, references
Google Docs document
Writing, images, references
Google Docs document
Idea
Pen-on-paper sketches
Materials
Week 11
Week 12
Artefact object or code
turn numbers into narrative
2021
B-DC 221
Computation in Design 3
Information Design Project
Project
Checklist
Introduction
Data visualisation
Findings
Insights
Conclusion
Interpretation
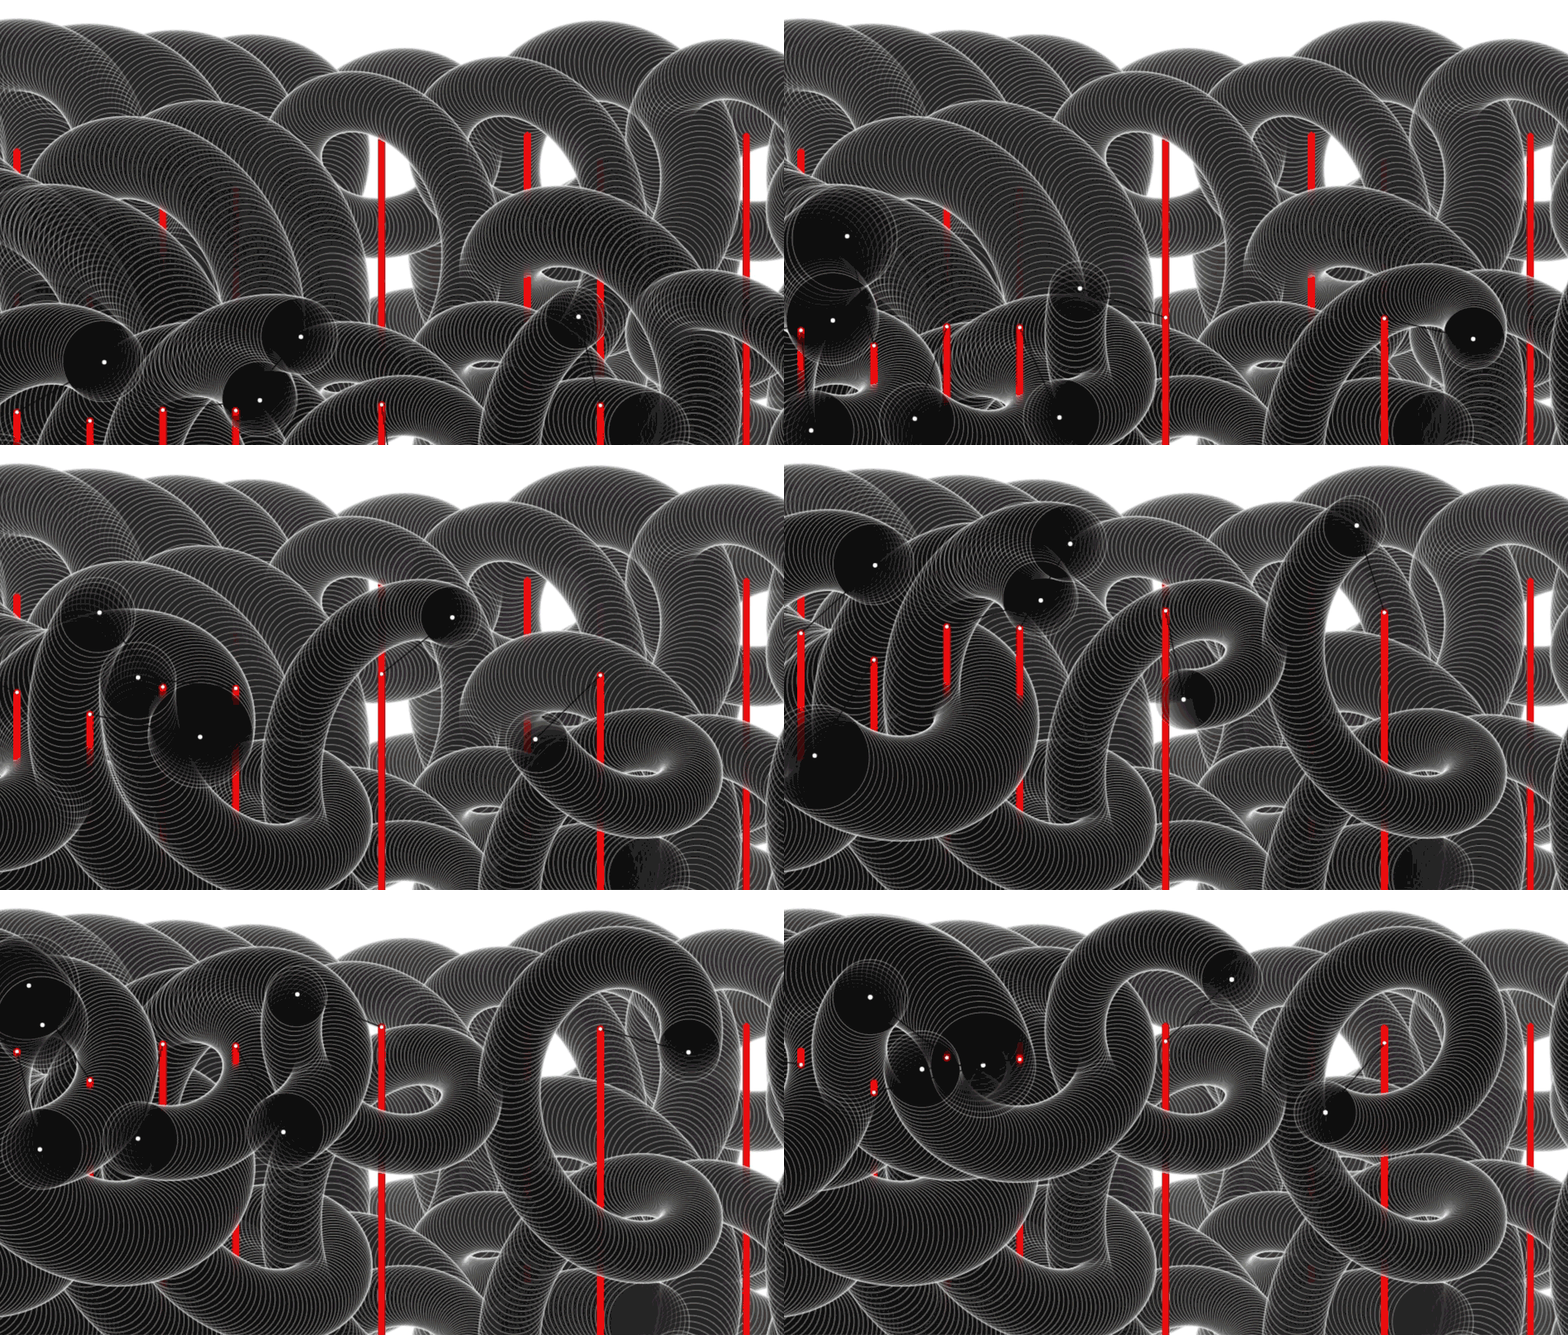
introduce and describe background and context of your data set(s)
describe the type of data visualisation you have used and applied
articulate the findings you have made
articulate what can be observed and understood from the data
based on your findings and insights, what conclusion can be drawn
from the above, ideate and implement a visual interpretation which will lead to your artefact development. You can start sketching with pen and paper first, then select one from three given options, see next slide.
(De)coding Data 3 Analyse Data
Analyse Data
2021
B-DC 221
Computation in Design 3
Information Design Project
Project
Looking ahead
(De)coding Data 3 Analyse Data
Interpret Data
Generative and Code
Use code to animate or interact with the data you have collected, this can be a purely abstract exploration where numbers for your dataset can be used to control the speed or the size of an animated visual shape. Don't miss out on the Generative Design sketches for inspiration or the publication The Art of Data.
2
3
1

2021
B-DC 221
Computation in Design 3
Information Design Project
Choose data set
Visualise data
Analyse data
Interpret data
1
2
3
4
document and share
5
Week 9
by Week 10
by Week 11
by Week 12
by Week 13
Collect your own data or use a data set from an online resource, then format and convert the data that you want to work with into a spreadsheet.
Use a p5js sketch or other tools to visualise your data. Pay attention to your design decision. Use Illustrator to refine your design outcomes. You can consider to make your datavis interactive.
From the data visualisation you have created, what are the findings that you can reveal and wish to highlight through your work and in relation to the data's context. What should be the takeaways for the user
Create an artefect based on your findings. The artefact can be crafted by hand, a drawing, a data physicalisation, or created in code.
Share your multi-page website that presents your findings and developments above
data
spreadsheet
datavis
svg
findings in writing, images, references, (coded) sketches
artefact
code or object
website
Wrapping up Week 11 Homework
Project
(De)coding Data 3 Analyse Data
Week 13
2021
Project
B-DC 221
Interpret Data Document and Share
Computation in Design 3
Information Design Project
(De)coding Data 4
In today's session we will review your artefact development and you will be briefed on the final step, the website. After the briefing we will continue with individual consultations.
Looking ahead, an ad-hoc class has been scheduled for week 14, during which you can consult with your lecturers and you may already have signed up for a time slot.
2021
B-DC 221
Computation in Design 3
Information Design Project
Choose data set
Visualise data
Analyse data
Interpret data
1
2
3
4
document and share
5
Week 9
by Week 10
by Week 11
by Week 13
by Week 14
Collect your own data or use a data set from an online resource, then format and convert the data that you want to work with into a spreadsheet.
(De)coding Data 4 Interpret Data, document and share
Use a p5js sketch or other tools to visualise your data. Pay attention to your design decision. Use Illustrator to refine your design outcomes. You can consider to make your datavis interactive.
From the data visualisation you have created, what are the findings that you can reveal and wish to highlight through your work and in relation to the data's context. What should be the takeaways for the user?
Create an artefect based on your findings. The artefact can be a drawing, a data physicalisation, or created in code.
Share your multi-page website that documents and presents your findings and developments above
data
spreadsheet
datavis
svg
findings in writing, images, references, (coded) sketches
artefact
code or object
website
What
How
When
Deliver
2021
B-DC 221
Computation in Design 3
Information Design Project
Project
Artefact
Interpret Data
Generative and Code
Use code to animate or interact with the data you have collected, this can be a purely abstract exploration where numbers for your dataset can be used to control the speed or the size of an animated visual shape. Don't miss out on the Generative Design sketches for inspiration or the publication The Art of Data.
2
3
1

(De)coding Data 4 Interpret Data, document and share
2021
B-DC 221
Computation in Design 3
Information Design Project
Website Template
The template provides you with a multi-page website. The following changes should be made to the HTML files here:
Images
Text
Stylesheets
The images used in the template come in different formats with only a grey background. Add your image content by editing images in photoshop and add new images if necessary.
Prepare your images in the specified formats and pay attention to image compression when exporting. The images are located in the assets folder. You must then manually change the file names in the HTML document. Image types here include .jpg, .png and .svg
Replace the text used in the template with your own. Some of the placeholder text fragments contain suggestions you should follow, others are lorem ipsum so you can get a feel for how the text will look in the layout before you replace it with your own.
To make changes to the stylesheets used in the template, go to the styles.css file. Here you can make changes to the font family, font size, and color. You must be familiar with these changes and understand where these styles are used in the HTML documents when applied to HTML elements as classes. Although this might be challenging at first, it can be visually rewarding.
(De)coding Data 4 Interpret Data, document and share
2021
B-DC 221
Computation in Design 3
Information Design Project
(De)coding Data 4 Interpret Data, document and share
Artefact
Website
netlify.app
Spreadsheet
work in progress
complete
upload
share
Week 13
Studio Submission
ideally an initial draft is completed by week 14 for the ad-hoc class
review week 7 how to upload to netlify
add URL to your website to the spreadsheet
2021
B-DC 221
Computation in Design 3
Information Design Project
(De)coding Data 4 Interpret Data, document and share
Week 8
Project Week Independent Study
2021
B-DC 221
for Week 9 prepare the following materials
Prepare for next week
Computation in Design 3
Information Design Project
Week 9
Information Design Project 1
2021
Exercise 3
B-DC 221
Briefing
Code, Context, Aesthetics
In this session students will be briefed on their Infodesign project. Highlight that the project triangulates between Code, Context, and Aesthetics.
All three cornerstones are important and each student will feel more comfortable and will focus on one or the other.
Important is that a student focuses on at least one without keeping the others out of sight. Students should take an approach were simplicity is preferred over complexity.
Examples will be shown and discussed. Starting-points will be given so students can choose a particular data set, work from a given sketch or can start investigating from a particular topic or text they are given. (this needs to be prepared)
Students
to prepare for next class
- Idea
- Sketches
- Context (what is the context of the dataset you want to work with, what are the issues, see rsa-project slides)
- References / case studies
- secondary research
- mindmap
In this 5 weeks long project, students will go through different phases of developing a project using code and data.
1. topic, ideation and context
2. data selection, references and aesthetics
3. sketching on paper and in code
4. translating numbers into graphs
5. creating a visual expression or narrative based on topic
6. organise project in a website
7. time management
To address in class
- code, context, aesthetics equally important
- simple over complicated
Computation in Design 3
Information Design Project
Code Abstractions
2021
Week 9
B-FA 222-322
In-class development
Single-page template
Web-101
Feedback and consultation
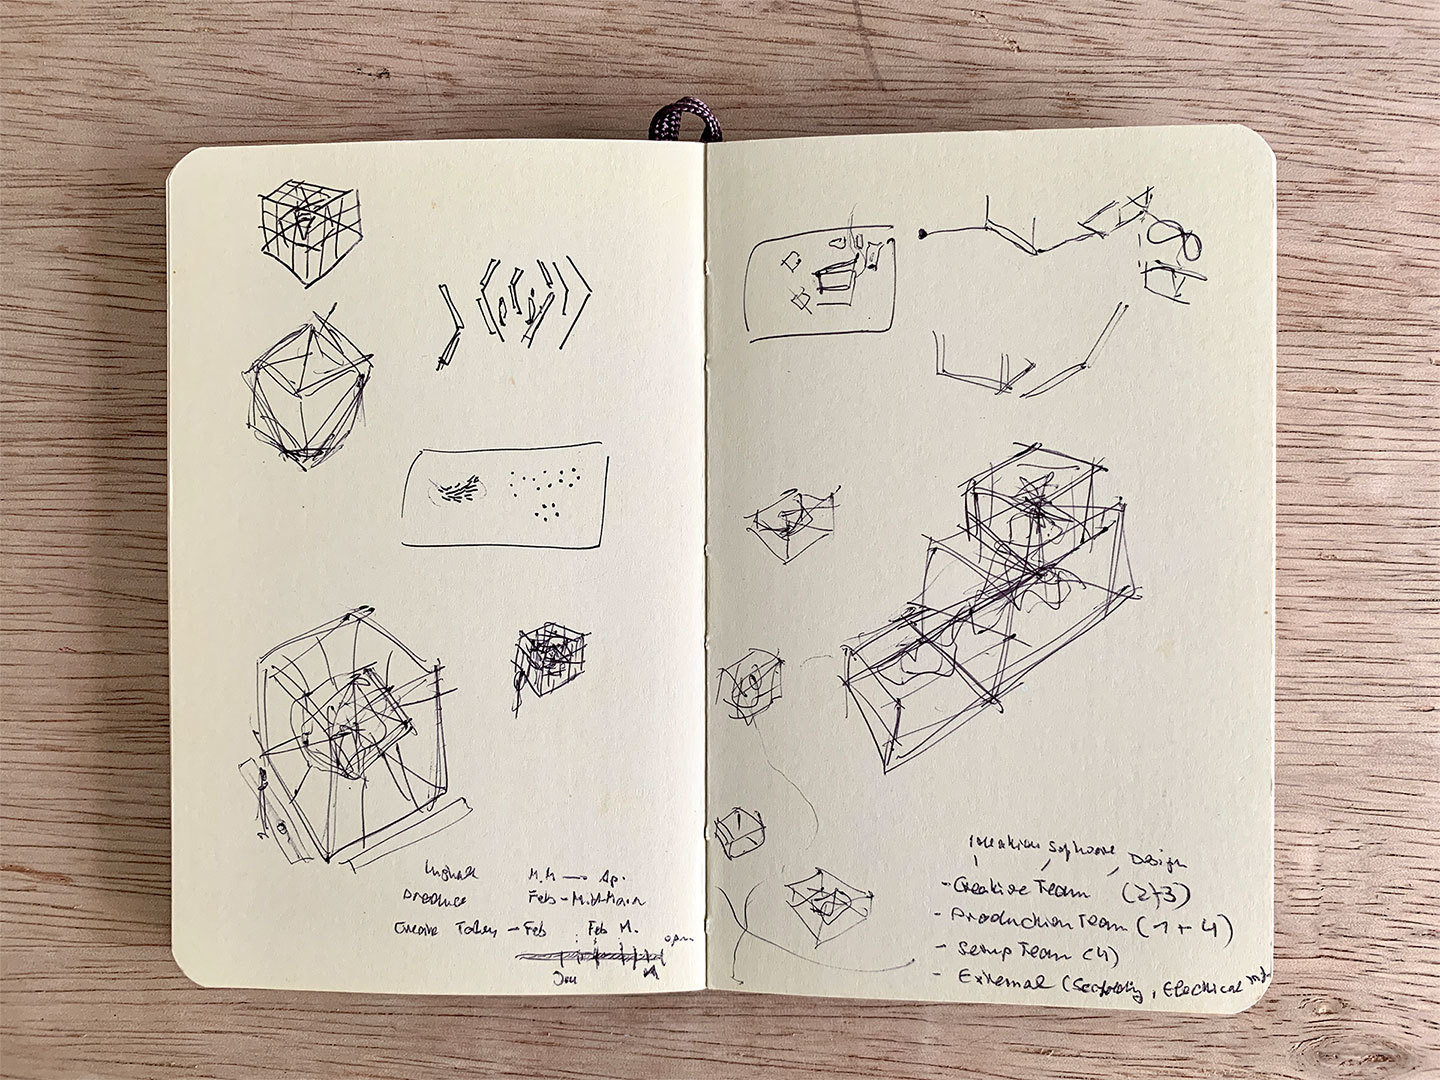
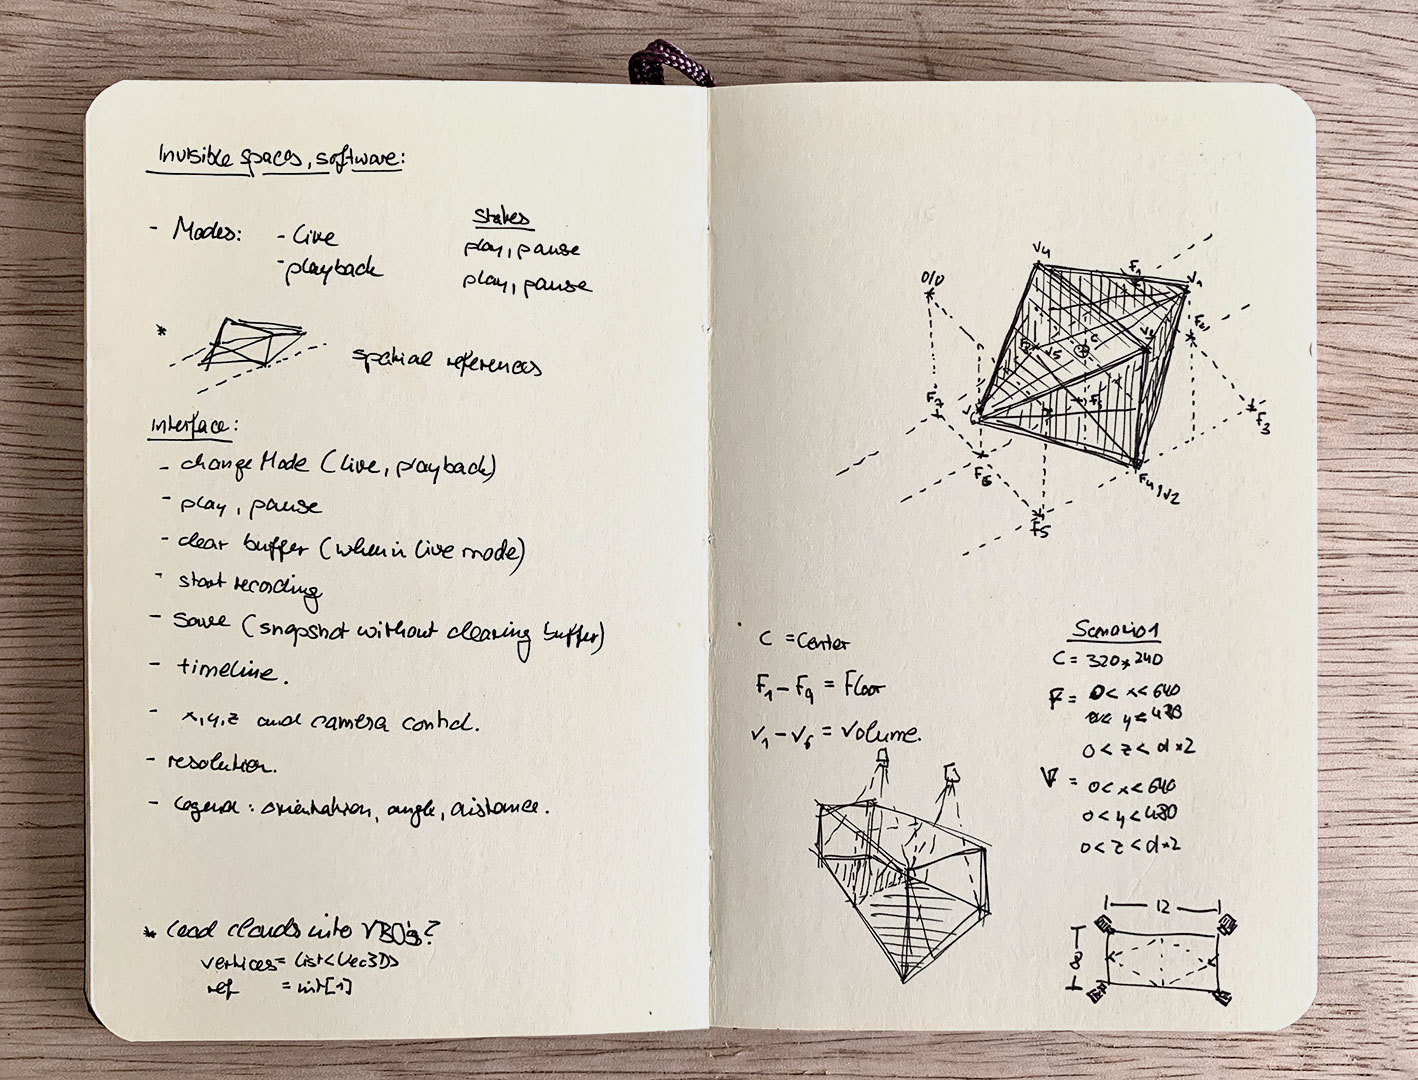
Data and Code 2
Week 5
Review graph sketch
group work until 3:45pm
2021
B-DC 221
Computation in Design 3
Information Design Project
2021
Year 1 Review
B-DC 221
What did we do and cover in year 1.
Computation in Design 3
Information Design Project
p5js review
Links to
Tutorials
Videos
Reference
Introduction to coding. You should know by now:
p5js editor
setup and draw
function
variable
loop
conditionals
shapes
transformations
what we need to add to. your coding knowledge
Arrays
Objects
reading excel files
Website
Written
Reflection
Description
2021
Resources
Readings
Links
References
B-DC 221
Computation in Design 3
Information Design Project
Watching
datavizsociety
drivingthehuman
holo.mg
instituteforthefuture
pentagram
theageofdata
zach.lieberman
Week 10
Information Design Project 2
2021
Exercise 3
B-DC 221
Ideation
Consultation
Students will come to class prepared with their initial idea and discuss those in their respective classes and lecturers.
At the end of the class students should have narrowed down their project so that they can start developing
- data set
- context and sense making
- references to better understand how others have approached data visualisation using code. references here should also help to develop a visual language for the project
- code references
- visual references
- datavis references
Students
- Finalise idea and dataset
- Scaffolding and structure of project
- References
- a series of sketches
Computation in Design 3
Information Design Project
2021
Week 9
Progress check
Digital Portfolio
Feedback and consultation
B-DC 221
Computation in Design 3
Information Design Project
Week 11
Information Design Project 3
2021
Exercise 3
B-DC 221
individual work-check and feedback
Students will go for a work-check in their respective classes and consult with their lecturers.
At the same time students continue to implement their project and seek help and advice for questions they may have and issues they may face.
code-clinics will attend to technical questions students may have, these clinics can be conducted in groups to discuss problems and solutions together.
Computation in Design 3
Information Design Project
Week 12
Information Design Project 4
2021
Exercise 3
B-DC 221
based on feedback and progress, students work on their project with next week's presentation in mind.
Computation in Design 3
Information Design Project
Week 13
Information Design Project 5
2021
Exercise 3
B-DC 221
Prototype presentation
Students present their project in their respective classes in a 3-5 mins presentation
Computation in Design 3
Information Design Project
Week 14
Independent Study
2021
B-DC 221
Computation in Design 3
Information Design Project
Computation in Design 3
By Andreas Schlegel
Computation in Design 3
- 3,165


