DC.js Line-Charts
Sylvain Fargier (CERN)
07/05/2022

- Integrated in base-vue (BE-CEM-MRO) a Vue.js library (MIT licensed)
- playground available
-
Displays live time-series
- Plain arrays or streaming API
- Automatic axis scaling
- Timestamp detection (nanos vs millis or Date objects)
- Rendering disabled when document hidden
DC.js Line Charts

dc.js graphing library examples
Example: playground record
- Features dropping (on large graphs)
- animations, crosshair, smoothing, tooltips ...
- Throttled rendering (on large graphs)
- Measuring last rendering duration and call-time
- Does not measure actual rendering time (since separated in browsers), but DOM preparation is proportional to graphical rendering time
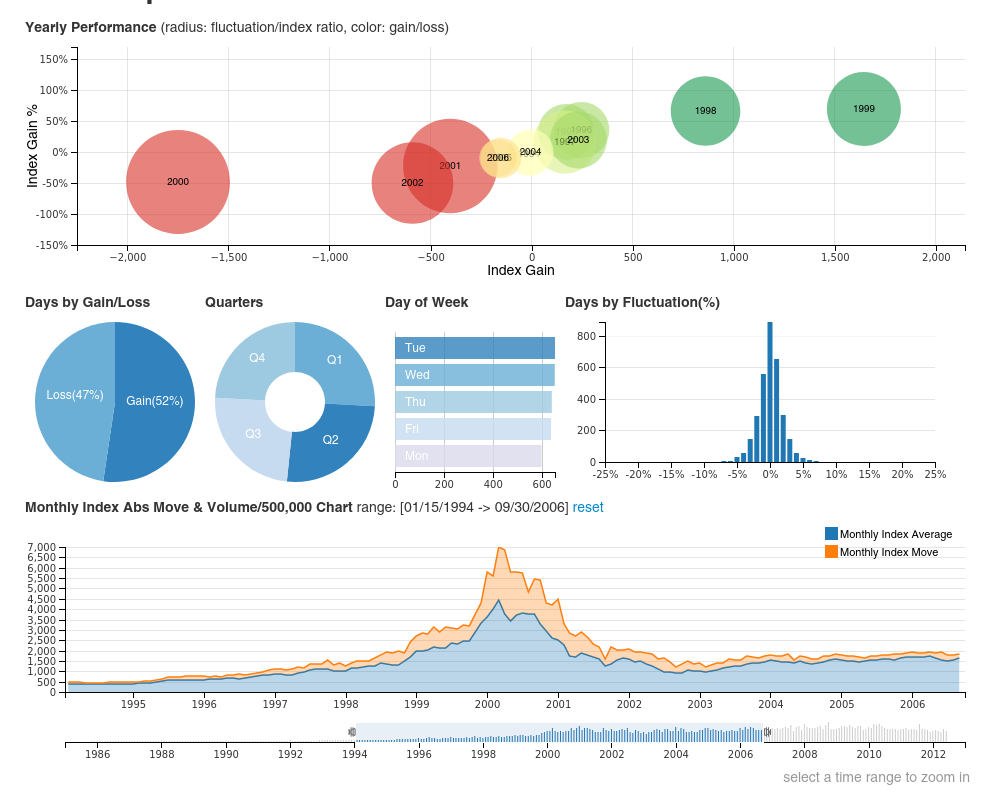
- Display large amount of data
DC.js Line-Charts : large graphs support
BaseLineChart(:maxData='10000' v-slot='chart')
  BaseInterval(:interval='10' @tick='chart.add($butils.random(0, 20))')
Example: 100Hz in a 10K graph: ~25% load on a single cpu (to be pasted in playground)
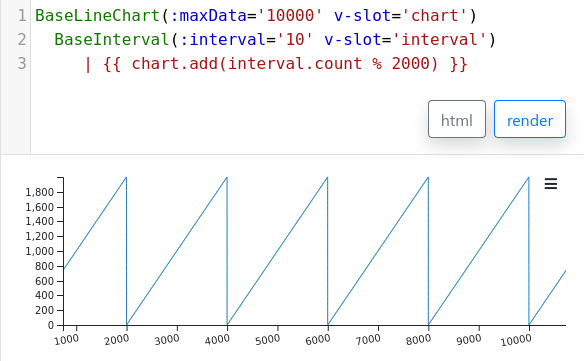
Example: 100Hz in a 10K graph
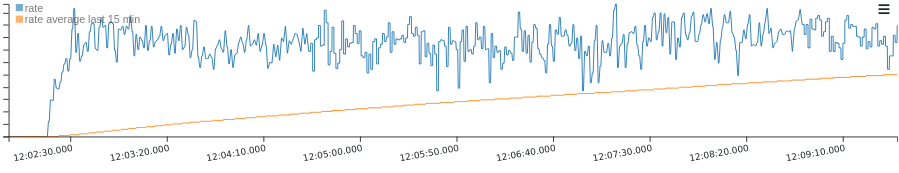
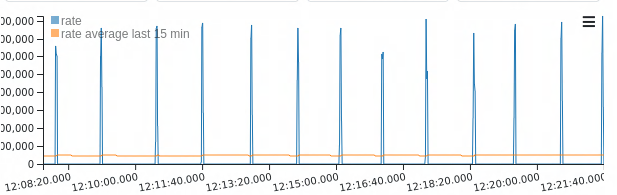
Example: n_ToF tape transfer rates
Charting Widgets
By Sylvain fargier