Tips and Tricks with Chrome DevTools / Web Inspector
For Intercom Debugging
Apologies to users of other browsers but for most of these there should be an equivalent feature in your browser of choice
What is it?
- A Swiss army knife for web development debugging
- View Live Source
- View HTML and Javascript Code
- View Network requests
- See memory usage
- Performance testing
- And much more
How to use it?

View (Live) Source
- By "live" it means "live"
- Better representation vs viewing source
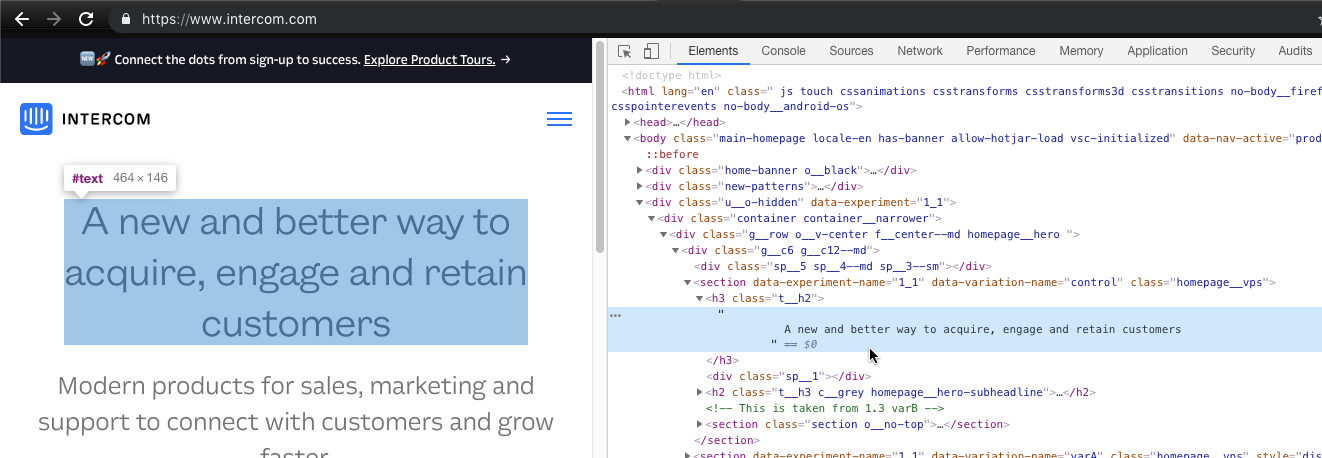
View (Live) Code
- See the code that crafts the page
- Javascript debugging with breakpoints

View Network requests
- See what's loading and from where
- See bottlenecks

Performance Testing


Performance Testing

Performance Testing
Page/Application Details

Page/Application Details

Page/Application Details


The favourite - Console

Going deeper!
Don't bother with source
- Look for `intercom`


(most of the times)
Ping is King / Trust the Ping
- Look for `ping`
- Most of the data you really need
-
Some notables that are missing: Messenger Attributes
- alignment
- hide_default_launcher
- custom_launcher_selector

Narrow the search

- Filter by type
Narrow the search

- Filter by common URL
Narrow the search

- Regular Expressions!
Search all the things

- Finding weird installations
- Common search terms:
-
APP_ID / Intercom("boot") / Intercom('boot') / Intercom("update")...
-
Prettify Code


Speed Testing and Caching

Preserving logs

- On full page loads logs disappear and AJAX requests get cancelled
- Help identify possible timing issues
CSS Hacks

See Events on Elements

See Events on Elements

- Hover and Delete!
Resources
Share your tips!
Questions?
Tips and Tricks with Chrome DevTools / Web Inspector
By Timothy Lim


