INTERNSHIP @ GIC

DEVANSHI VERMA
AGENDA
Mapping Disasters for South- East Asia from Twitter using Python
- Why Twitter and how do we get the data?
- Problem and Solution
- Framework
- LIVE DEMO
- Output
- Testing and Results
- Questions?
PROJECT 1
AGENDA
Classification of Satellite Images using Machine Learning in Python
- Image Classification Techniques in Remote Sensing
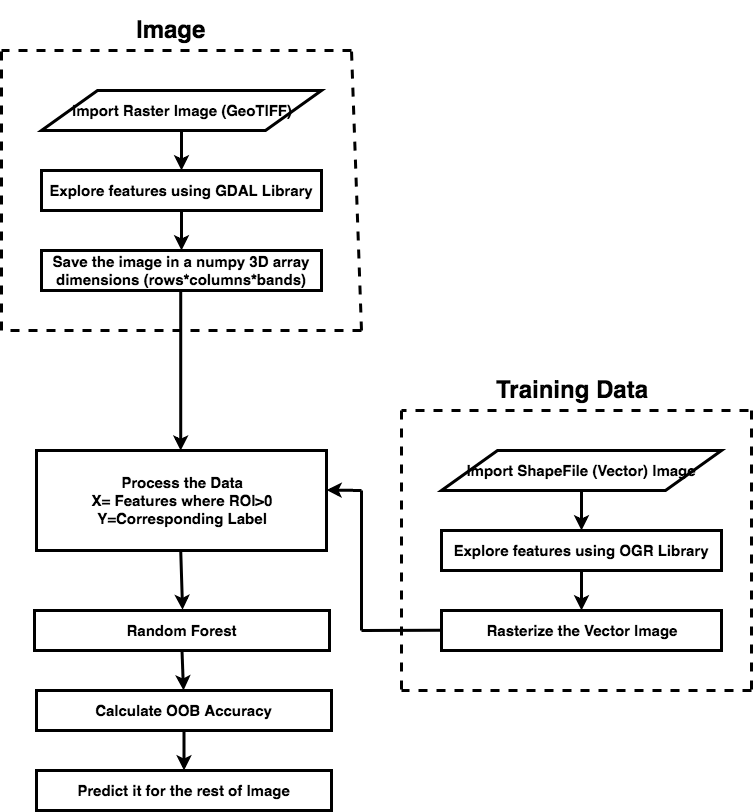
- Framework
- Output
- Questions?
PROJECT 2
MAPPING DISASTERS FOR SOUTHEAST ASIA USING TWITTER

TWITTER DATA
WHY AND HOW?
- Twitter is the top source of breaking news averaged 336 million users in the first quarter of 2018 with an average of around 6,000 tweets per second.
- It provides fast, real-time information about a large-scale disaster and can produce a map within around a minute of messages being posted.
TWITTER DATA
WHY AND HOW?


TWITTER API
APPLICATION PROGRAMMING INTERFACE
- API is a way to request and deliver information. This is done using "End points" which is an address (generally unique) that corresponds with a specific type of information.
- 2 types of API's
- Search API
- Stream API

PROBLEM?
AND THE SOLUTION
- With a tweet we have 4 types of Data dictionaries : Tweet object, User object,Twitter entities and extended entities.
- In Tweet object dictionary we have the co-ordinates in geoJSON format

- PROBLEM: A user has to enable the precise location to add this information. This feature is OFF by default!
NAMED ENTITY RECOGNITION
Text
EXAMPLE

NAMED ENTITY RECOGNITION
EXAMPLE

NAMED ENTITY RECOGNITION
SOLUTION
- NER is used to classify named entities in text into pre-defined categories such as the names of persons, organizations, locations, expressions of times, quantities etc.
- For Training NER :
- Collect a set of representative documents
- Label each token for its entity class.
- Design Feature extractor appropriate. Features can be words, the position of words, POS Tags, character subsequences etc.
- Train a sequence classifier to predict the labels
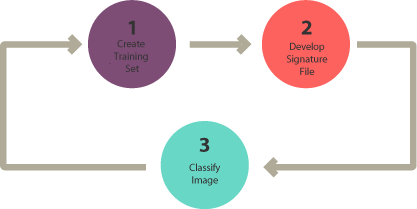
FRAMEWORK

TESTING
RESULTS - FLOOD
| No | Disaster | Location | Status | Source |
|---|---|---|---|---|
| 1 | Flood | Japan - Kamo River, Hiroshima, Kyoto, Fukuoka, Okayama, Moyotama, Mabi town, Kurashiki, Nagasaki,Kyusyu island | Detected | Floodlist |
| 2 | Flood | Pakistan - Lahore | Detected | Floodlist |
| 3 | Flood | Nepal | Not Detected | Floodlist |
| 4 | Flood | India - Jammu, and Kashmir, Karimganj, Srinagar | Detected | Floodlist |
TESTING
RESULTS - EARTHQUAKE
| No | Disaster | Location | Status | Source |
|---|---|---|---|---|
| 1 | Earthquake | Japan - Chiba, Tokyo, Fukushima | Detected | USGS |
| 2 | Earthquake | Indonesia - Sumatra | Detected | USGS |
| 3 | Earthquake | Japan - Osaka | False Detection | ------------ |
| 4 | Earthquake | India - Rajasthan | Detected | USGS |
| 5 | Earthquake | Australia - Adelaide SA | Detected | USGS |
| 6 | Earthquake | Taiwan- Taitung County | Detected | USGS |
TESTING
RESULTS - LANDSLIDE
| No | Disaster | Location | Status | Source |
|---|---|---|---|---|
| 1 | Landslide | India - Tamenglong district, Manipur, Jammu, Baltal Route, Jammu and Kashmir | Detected | |
| 2 | Landslide | Japan - Hiroshima, Kurashiki, Kyushu | Detected | |
| 3 | Landslide | China - Beichuan Qiang Autonomous County | Detected |
DEMO
QUESTIONS?
CLASSIFICATION OF SATELLITE IMAGES USING MACHINE LEARNING

TYPES OF IMAGE CLASSIFICATION IN REMOTE SENSING
-
UNSUPERVISED CLASSIFICATION

- In unsupervised clustering, group pixels into "clusters" on the basis of clustering algorithms like K-Means etc.
- Identify the number of groups you want
- Manually identify each cluster with land cover classes
SUPERVISED CLASSIFICATION
- Another Pixel Based Classification Technique, select representative samples for each land cover class
- Uses Spectral Signature (variation of reflectance or emittance of a material with respect to wavelengths)
- It determines each class on what it resembles most in the training set.
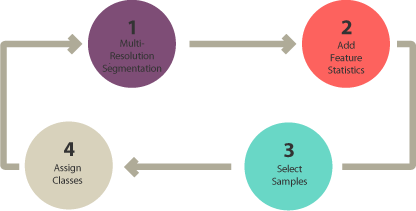
OBIA CLASSIFICATION
- Unsupervised and Supervised are pixel based i.e. it creates square pixels and each pixel has a class
- In OBIA, we group them into representative groups and sizes i.e. Multi- Resolution Segmentation i.e. producing homogenous image objects by grouping pixel.
- Features : Shape,Context and Geometry. We can take Multiple bands or even a shape file to classify object
PROPERTIES OF SATELLITE IMAGE
WHAT MAKES IT DIFFERENT
GREYSCALE IMAGES
- Where the value of each pixel is a single sample representing only an amount of light
- An 8-bit gray image implies 2^8 combinations and therefore, 0 - Black and 255 - White
RGB IMAGES
- To define any color, you must specify the Red (R), Green (G), and Blue (B) values.
- 0 is minimum for any RGB color and 255 is max for any RGB color
WHY?
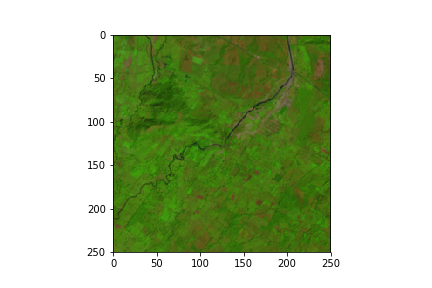
- Combine any band to get a different depiction of the Earth's Surface. Eg: RGB image forms a Natural color image
- Eg: Green, NIR, SWIR2 combined give a better contrast between trees and shrubs and sawgrass marsh. These are false color images which highlight or enhance different surface features.
- Eg: Green, Red and NIR, it turns out that healthy vegetation reflects a lot of NIR light
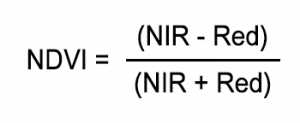
NDVI INDEX
DEMO
QUESTIONS?
APPLICATION OF MACHINE LEARNING IN REMOTE SENSING
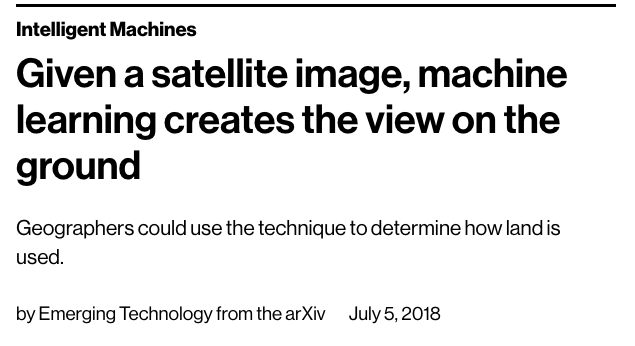

- These guys have trained a machine-learning algorithm to create ground-level images simply by looking at satellite pictures from above.
- Technique used in the given article is GAN which has two parts in it: the generator that generates images and the discriminator that classifies real and fake images.
- Team trained the discriminator with 16,000 pairs of overhead and ground-level images.
Text
APPLICATION OF MACHINE LEARNING IN REMOTE SENSING
- Generator was fed a set of 4,000 satellite images
- The team tested the system with 4,000 overhead images and compared them with the ground truth images.
- Result :“The generated ground-level images looked natural although, as expected, they lacked the details of real images”.
- Use: Classify as Rural/Urban Region!
- Limitation : Existing DataBase is sparse
Text
THANK YOU

thisisdevanshi
thisisdevanshi
thisisdevanshi
GIC FINAL PRESENTATION
By Devanshi Verma

