Decreased EEG synchronization in Alzheimer’s disease and mild cognitive impairment
Overview
- GOAL: To analyze the correlation between Alzheimer's disease and decrease in EEG frequency synchronization using Global Field Synchronization (GFS)
- Reasoning: Alzheimer's causes characteristic disconnection between neurons, thus studying EEG data can allow us to see changes the synchronization between neurons
- Experiment: 6 groups of people ranging from healthy controls to mild cognitive impairment to severe Alzheimer's Disease
Global Field Sync (GFS)
- measures functional synchronization in frequency-domain EEG data
- percentage of EEG activity oscillated with a "common phase"
- high GFS value = phase locked = short-term neural network binding, indicating that brain is normal
- GFS is global, all electrodes simultaneously measured and independent of reference electrode-- doesn't have to worry about the independent action going on at that specific location of the brain
GFS Computation
- At a certain frequency, GFS measures the relative existence of a common phase over all electrodes
- Fast Fourier Transformation (FFT) is used.
- Each frequency, each electrode turns into a two dimensional vector. Origin of vector is the reference. Length of vector indicates power of the signal and direction of vector is the phase.
- How similar the vectors are can be shown by their directions.
Results
- The experiment was conducted twice. Once at the New York site and the Stockholm site.
- Degree of impairment showed significant effect in:
- Delta band: New York
- Theta band: Neither
- Alpha band: Both (highly significant effect)
- Beta band: New York, similar effect in Stockholm
- Gamma band: no significant
- Note about Gamma: GFS values were lower in all patient group than controls.
A few facts to keep in mind
- GFS measures signals to be staionary only within a single, short EEG epoch.
- Relation between GFS and degree of cognitive decline is most evident in the alpha band
- Almost continuous decrease of GFS with increasing cognitive impairments in the New York group.
- Possible explanations include neurodegenerative process affect neural synchronization.
- Alpha band might be the first place where there's functional changes for the Alzheimer's disease
Relevance of Data
- Instead of just ADHD and anxiety, Alzheimer's data shows result of correlation to EEG as well
- There are bar graphs provided on the GFS values for every trial. However, we might need to learn more about the specific algorithm in order for this data to be useful.
EEG Correlates of Task Engagement and Mental Workload in Vigilance, Learning, and Memory Tasks
Overview
- GOAL: To measure the task engagement and mental workload of a person using both subjective measurements and EEG and see if there's a correlation
- Why EEG?: It is stated that other biomarkers that can indicate cognitive state changes include heart rate, oculomotor activity (EOG), pupilometry, fNIR, and galvanic skin response. However, EEG can measure subtle shifts in alertness second-by-second
- Variables: Task engagement tracks demands for sensory processing and attention resources while mental workload measures the amount of cognitive process that will be the domain of executive function
Methods
- 5 tasks and each had 3-6 varying difficulties
- Grid - a N x N grid of square, missiles were presented at a certain coordinate, then disappears. Subject has to remember where it was
- Forward Digit Span - series of single digits of increasing lengths presented, then subject has to remember and enter the numbers
- Mental Arithmetic - varying amount added
- Backward Digit Span - just like FDS but subject has to enter it in backwards order
- Trails - draw a trail based on labeled dots on the screen (connect the dots) based on numbers or letters or the combination of both
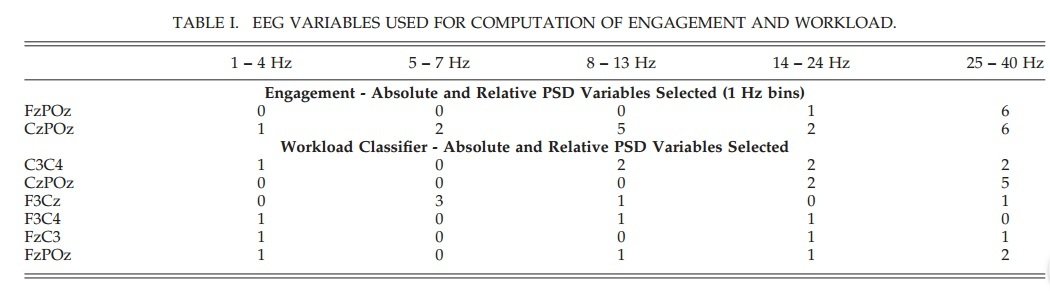
EEG Metric for Task Engagement
- Four-class quadratic discriminant function analysis (DFA) constructed using absolute and relative power spectra variables from Fz-POz and Cz-POz
- This helps measure how often someone's eyes blink, and the time they spend with their eyes open/closed
- Used a 3-choice vigilance task to measure high vs low engagement vs relaxed wakefulness
EEG Metric for Mental Workload
- Linear DFA gives classification of low vs high mental workload
- Stepwise regression on EEG data from C3-C4, Cz-PO, F3-Cz, Fz-C3, and Fz-PO
- Different combinations of the data were used to derive a two-class workload classifier.
Relevance/Data
- Correlation between subjective rating of workload and actual increase in EEG workload
- Correlation between increase in EEG workload and decrease in objective performance
- Doesn't provide raw data but if we can find the raw data for this paper, it'll be useful
The influence of mental fatigue and motivation on neural network dynamics; an EEG coherence study
Overview
-
GOAL: Examine the correlation of EEG data as a result of mental fatigue
- Does mental fatigue affect neural network dynamics (by measurement of neural synchronization)?
- How to Measure: EEG coherence measures the association of different timeseries of specific frequency bans.
- Trials: repetition vs switch, make subject identify characteristics of colored letters on a screen. Repetition: identifies color all the time
Results
- Subjective: Subjects who report increase aversion will take longer time
- Conditions: general activation (ga), deactivation/sleep (ds), high activation (ha), and general deactivation (gd)
- Behavioral: Reaction time initially decreases, then increases due to mental fatigue. Then after motive manipulation (increasing reward), the reaction time shortens again. Error rates keep going up until reward was offered.
Coherence Data
- smaller number of functional units observed in lower frequency bands, more FUs in higher frequency
- the total number of electrodes involved decreased
- larger local networks at lower frequency
- Fz, FG5, FG6, PO7, PO8 chosen for further coherence statistical analysis:
- highest coherence values = lowest frequency band (has lots of details about specific electrodes)
- coherence values showed increase with time, and a small non-significant decrease observed after motive manipulation
Power Density Data
- power density decreases with increasing frequency
- differences in power electrodes are dependent upon frequency
- i.e. lower frequency bands have high powered density at posterior sites
- power density higher in repetition condition
- power density increases with time
Relevance/Data
- Gives coherence data and meaningful findings on certain parts of the brain. Have electrodes and their coherence listed. Have a bunch of different frequencies listed and their power densities as well.
- This includes strong coherence between contra-lateral frontal and parietal area. This is important to note because fronto-parietal networks play an important role in cognitive control.
- Uses Fisher z-transformation to find a correlation coefficient
- Maybe this can be used to measure learning efficiency etc
EEG_Articles_JULY16
By tsunwong625


