


Viktor Petukhov
PhD student at the University of Copenhagen
V. Petukhov, P. Kharchenko
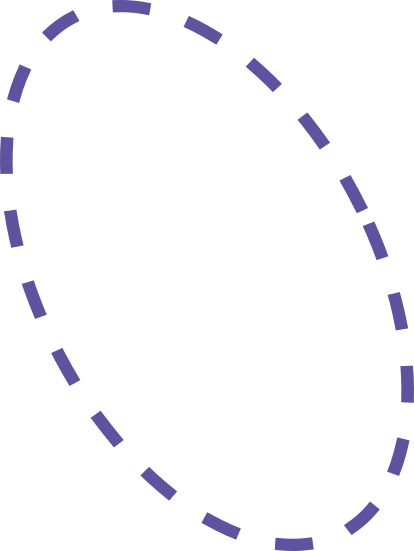
Estimate
boundaries
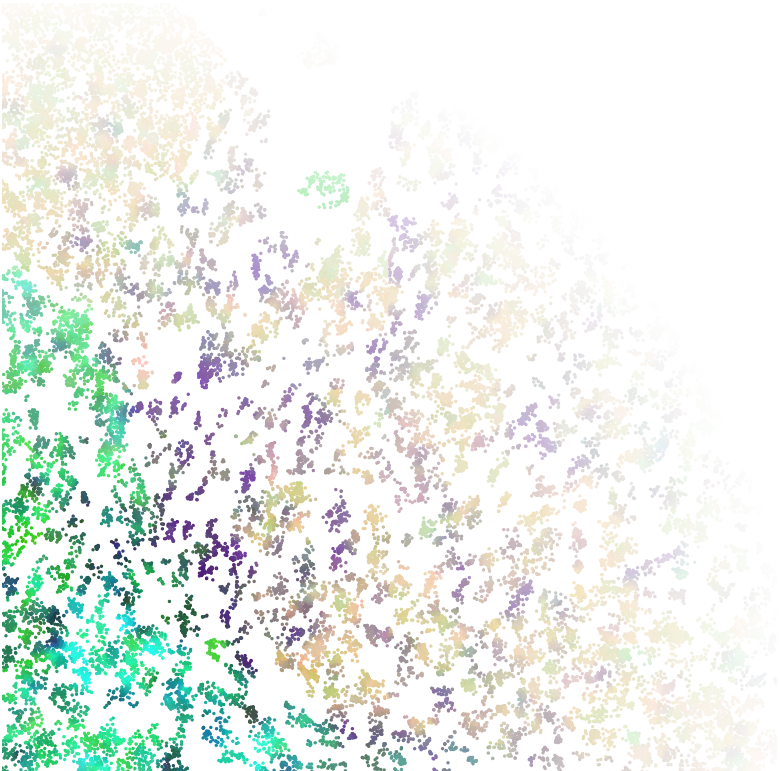
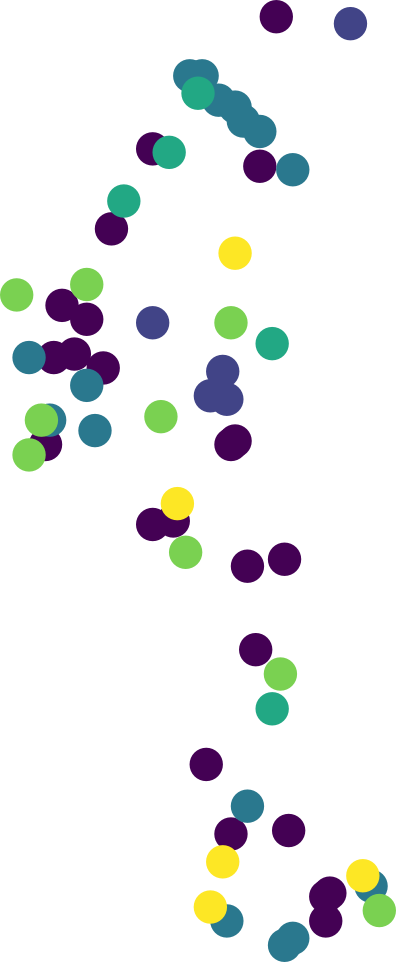
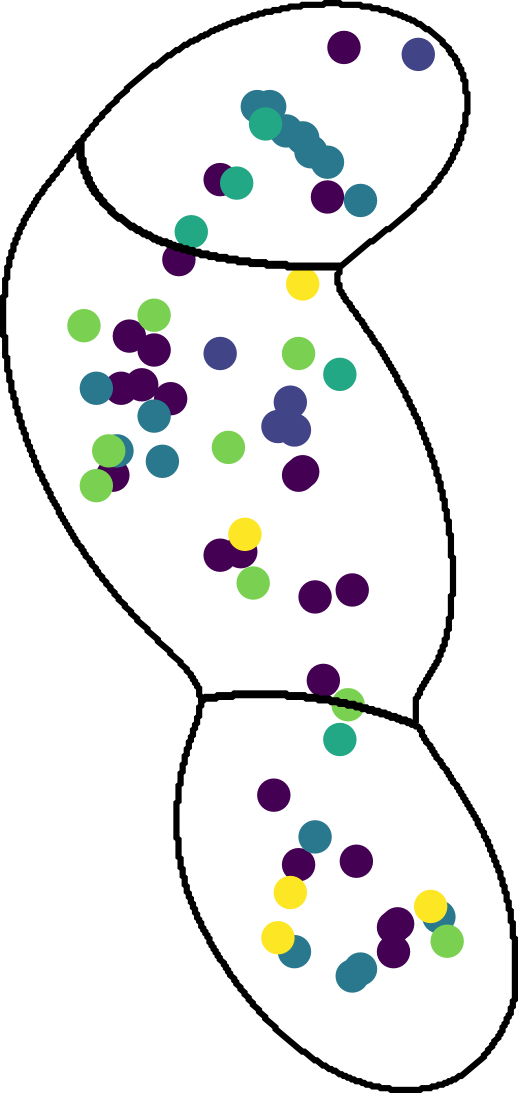
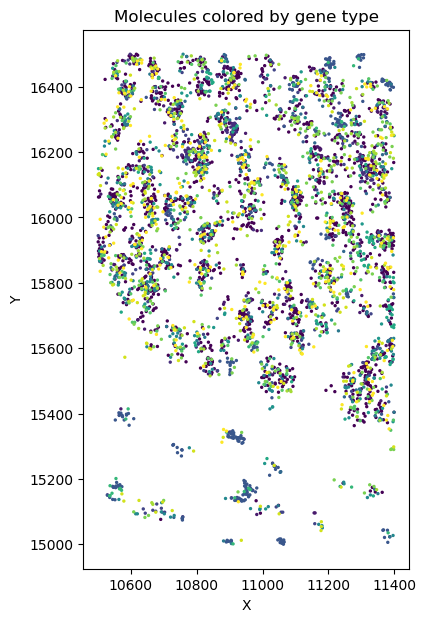
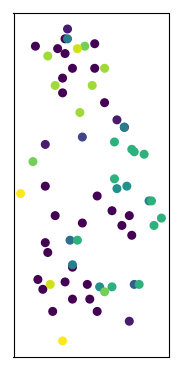
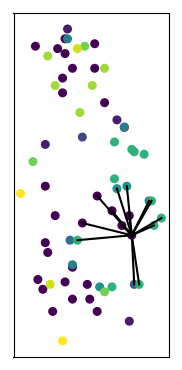
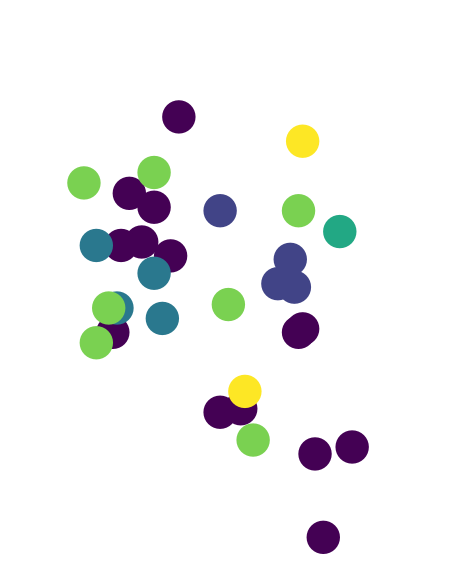
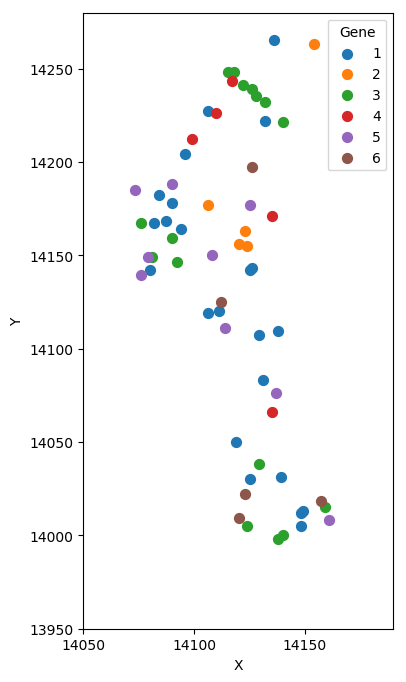
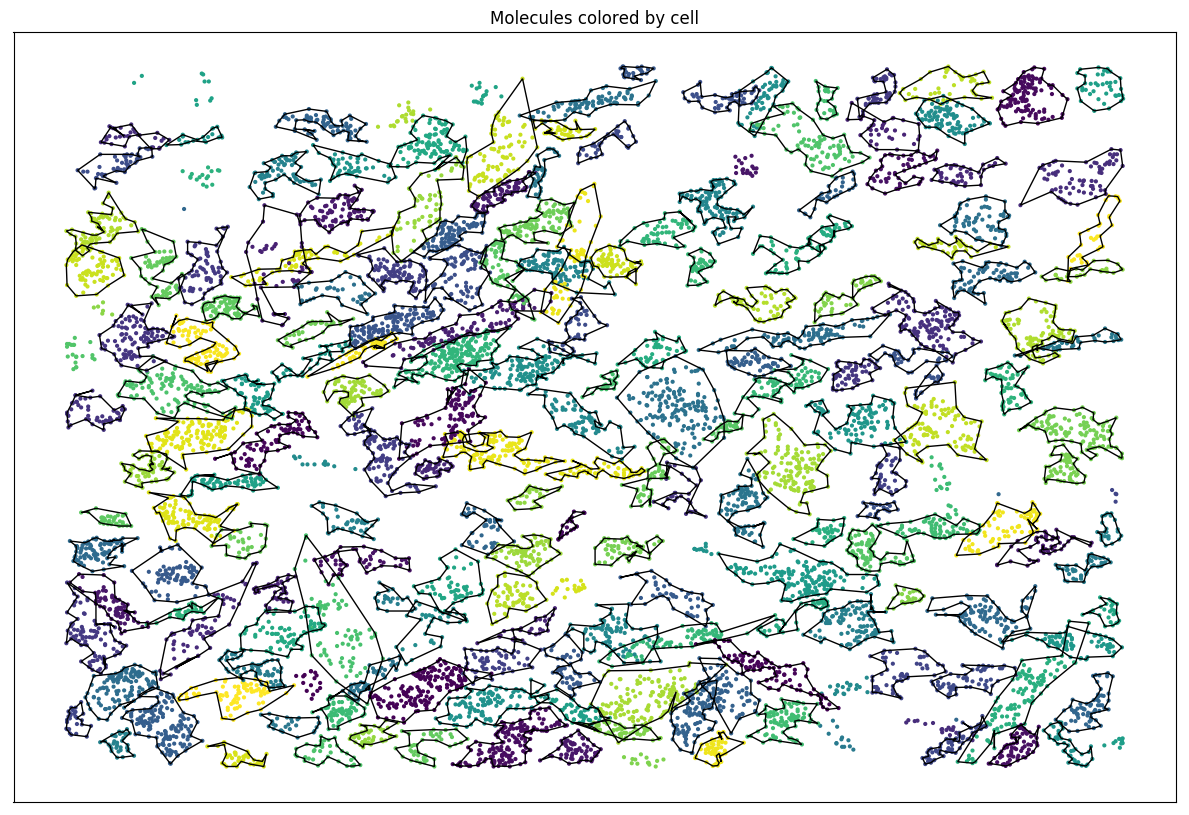
Set of molecules
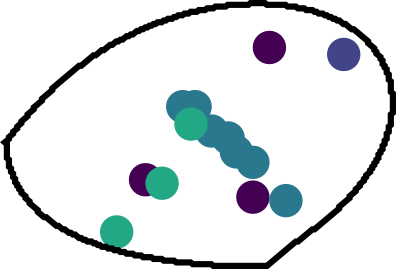
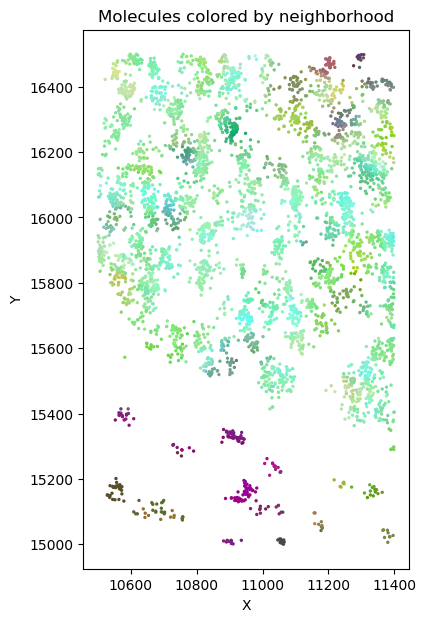
Split molecules by cells
| X | Y | Gene |
|---|---|---|
| ... | ... | ... |
We know:
What is the source?
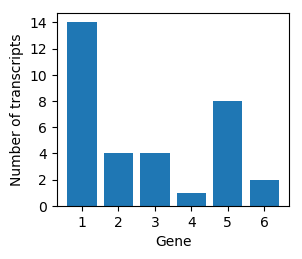
Gene 1: 20%
Gene 2: 80%
Gene 1: 80%
Gene 2: 20%
| Gene 1 | ... | Gene k |
|---|---|---|
| N1 | Nk |
Gene vector
Embedding to 3d space
k nearest
neighbors
Global scale
Cell type
Shape / size
Position of center
scRNA-seq data
Composition
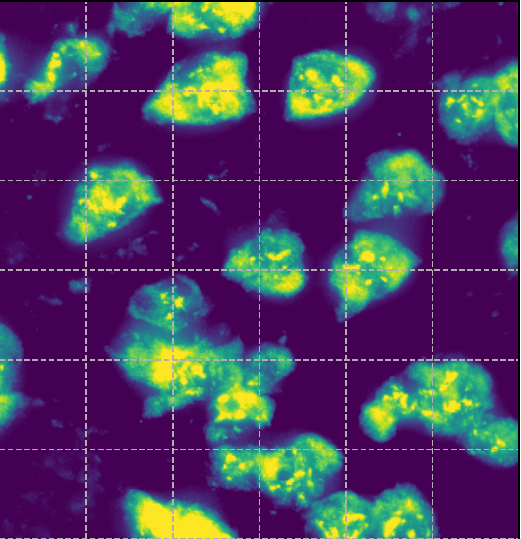
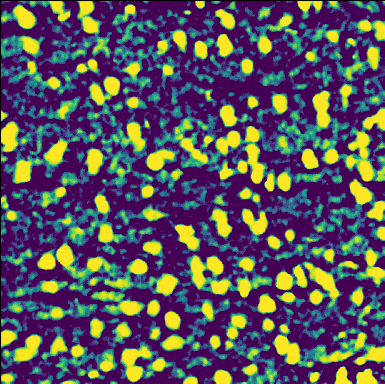
Nuclei stains
Membrane stains
Molecules
Boundaries
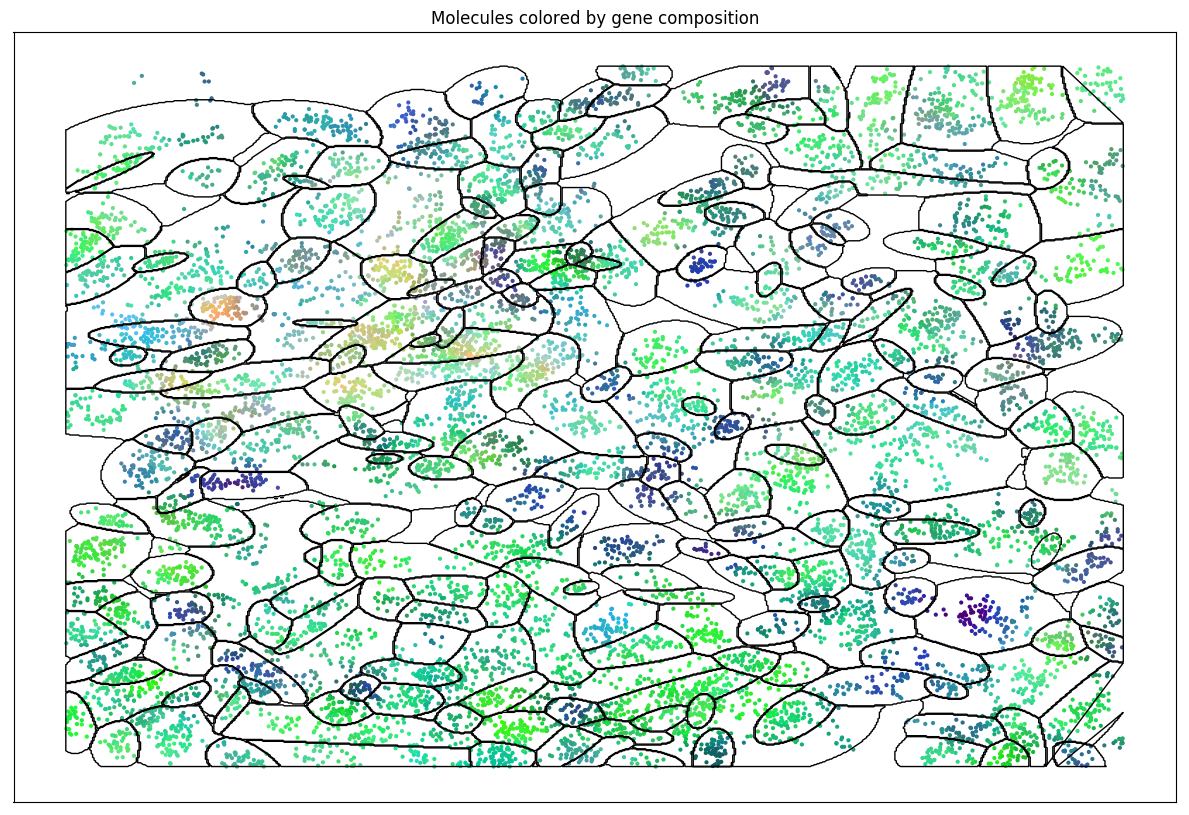
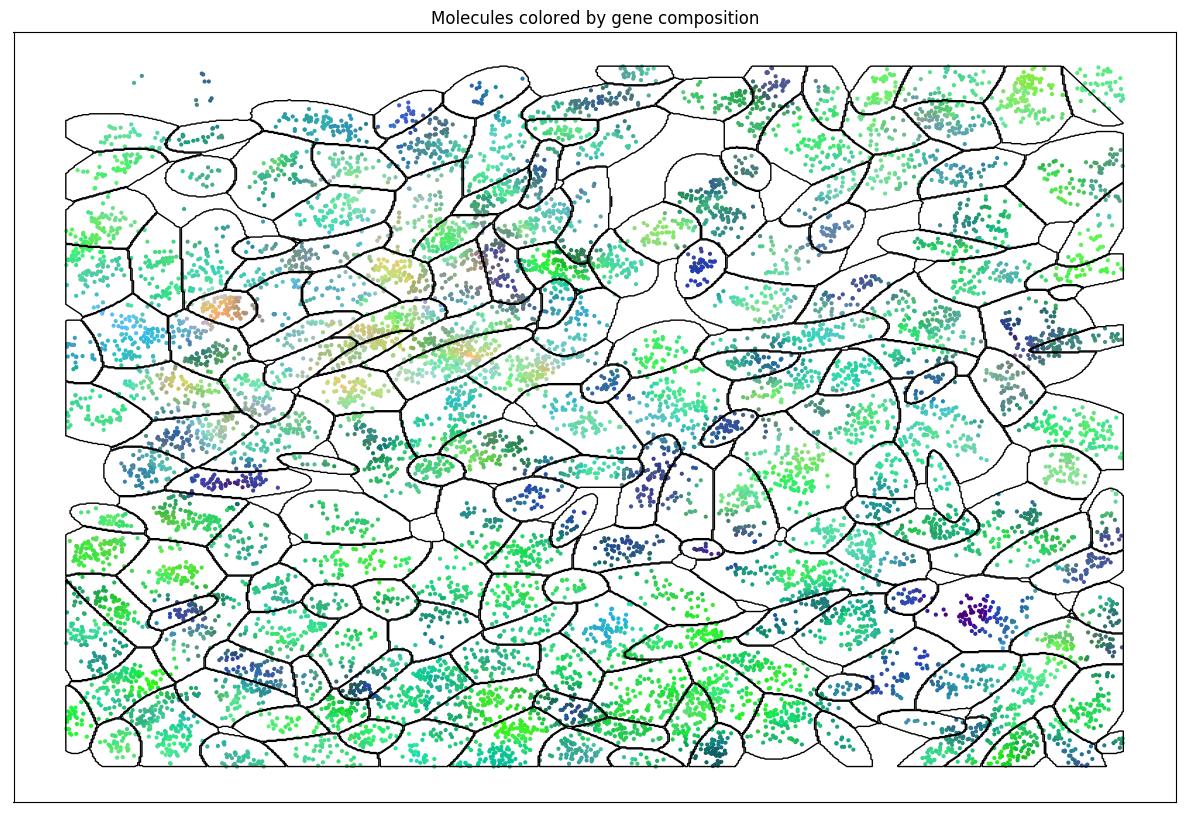
Transcript composition
Center position, ellipsoid shape
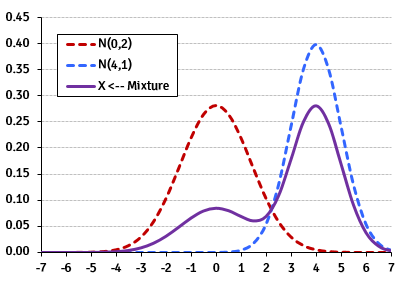
2D Normal distribution
Multinomial distribution
| 0.43 | 0.12 | 0.12 | 0.03 | 0.24 | 0.06 |
| 10 | 20 |
| 3.5 | -1.5 |
| -1.5 | 3.5 |
Position
Shape
Composition
Cell is a distribution:
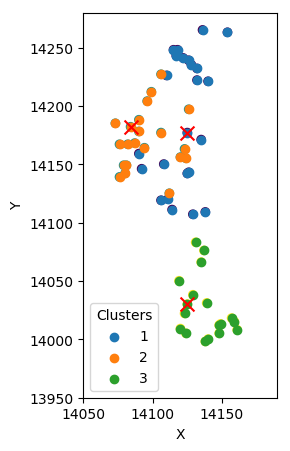
Separate probability distributions from a mixture model
Algorithm v0.01
Initial approximation
Expect
Maximize
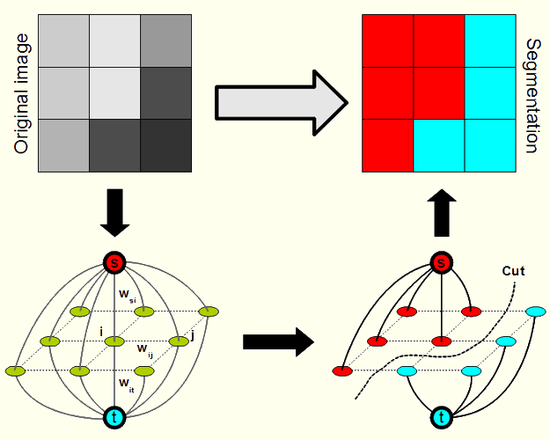
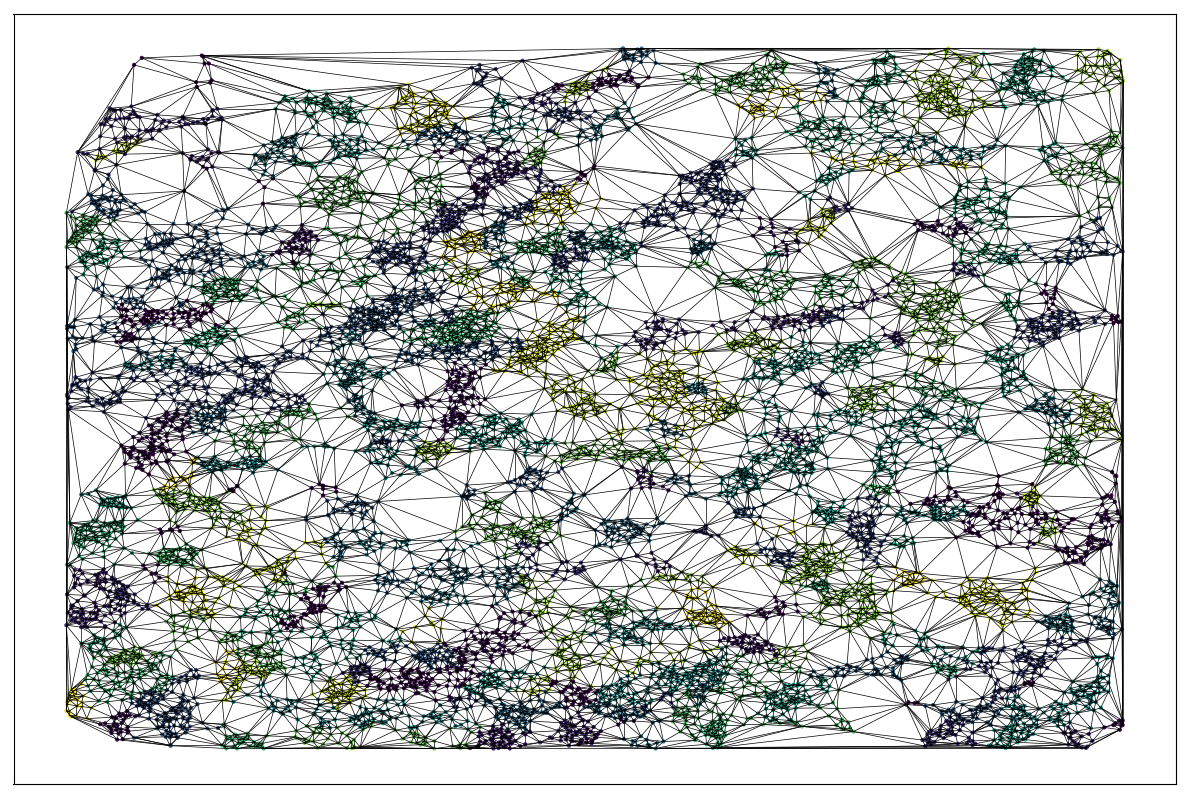
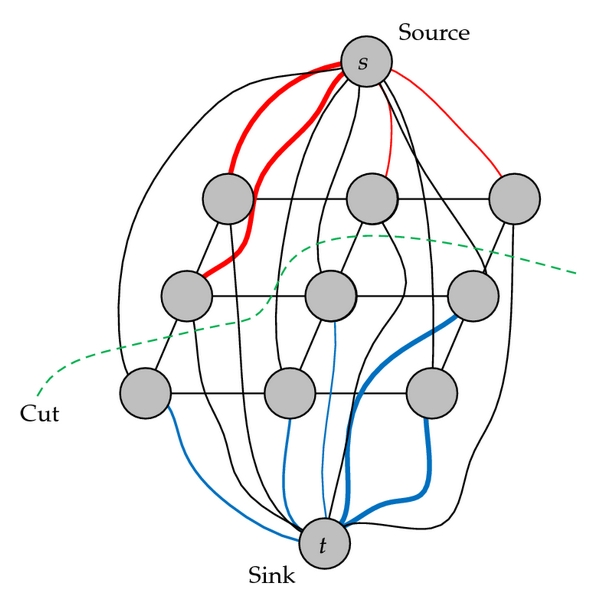
Problem: spatial constraints
Solution: Graph Cut Optimization
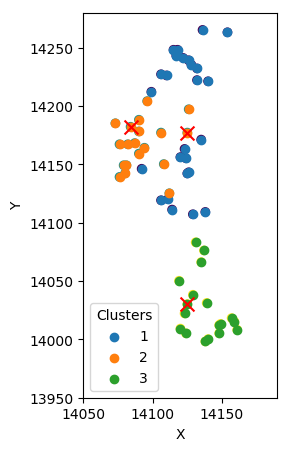
Algorithm v0.02
Initial approximation
Expect
Maximize
GCO
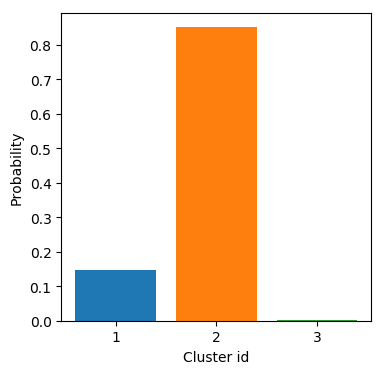
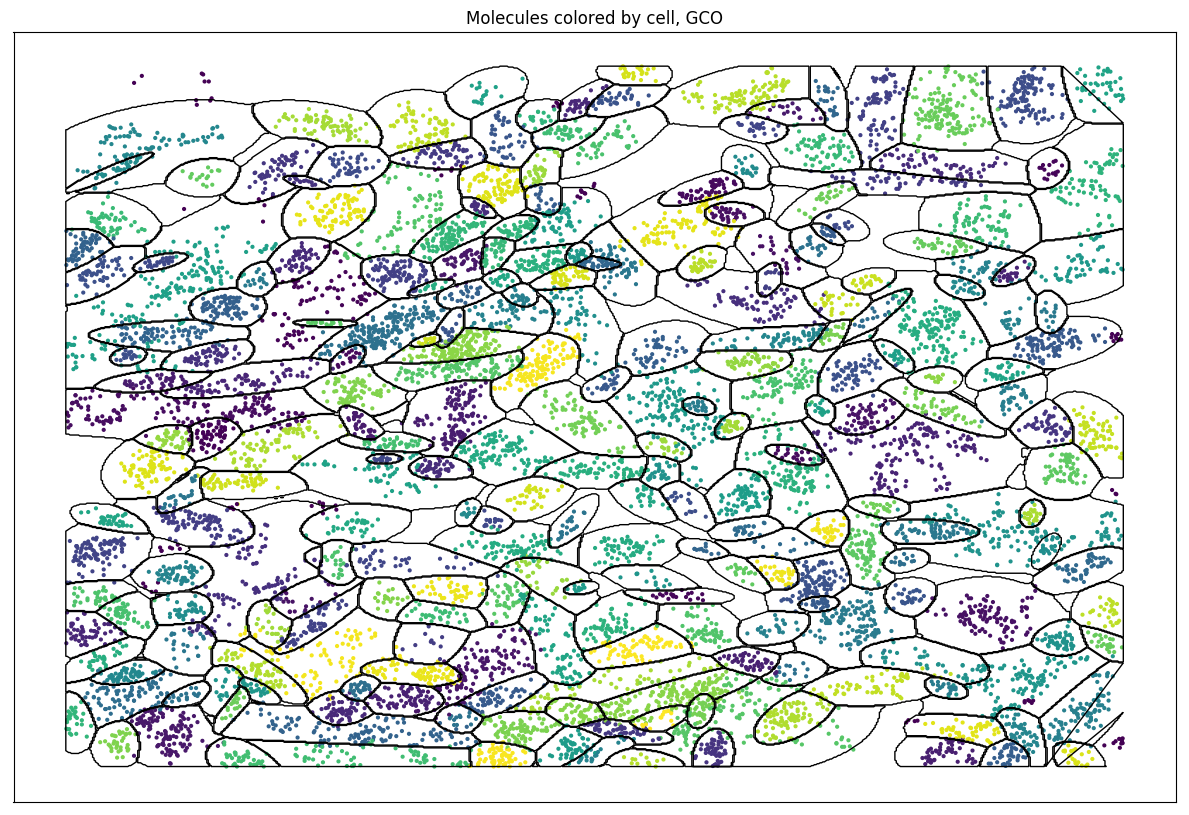
Algorithm v0.02: Results
Algorithm v0.1: Stochastic EM
Expect
Sample
Maximize
Algorithm v0.1: Stochastic EM
Composition prior
Expect
Sample
Maximize
By Viktor Petukhov


