Vega-Lite

A Grammar of Interactive Graphics
Crash Course!
What
Background
"Vega-lite is a high-level grammar of interactive graphics. It provides a concise, declarative JSON syntax for rapidly generating visualizations to support analysis."
D3 -> Vega -> Vega-Lite

Stats
| No | Item | Description |
|---|---|---|
| 1. | Total Commits | 9,105 |
| 2. | Last Commit | 4 days ago |
| 3. | Opened Issues | 475 out of 2,645 |
| 4. | Opened Pull Requests | 24 out of 4,393 closed |
| 5. | Total Stars | 3.4k |
| 6. | Total Fork | 432 |
| 7. | First Public Release | 9th May 2015 (v.0.6.4) |
| 8. | Latest version | v5.1.0 |
Contributers
From the University of Washington Interactive Data Lab:

Why
Existing Tools


Facilitate rapid exploration with concise specifications by omitting low-level details.
Infer sensible defaults and allow customization by overriding defaults.
But limited support for interactions.
Closed source & proprietary software
Existing Tools
Offer fine-grained control for composing visualizations.
But requires technical expertise and verbose specifications (e.g. 100 LOCs for a bar chart)

How
Specifications
| Item | Description |
|---|---|
| Data | Input data source to visualize |
| Transform | Filter, aggregations, binning, etc |
| Mark | Type of visualization |
| Encoding | Mapping data to mark properties |
| Scale | Mapping data values to visual values |
| Guides | Axes & Legends that visualize scales |

Measurement
| No | Type | Description |
|---|---|---|
| 1 | Quantitative | Numerical values |
| 2 | Temporal | Datetime values |
| 3 | Ordinal | Categorical values that have natural orders or ranking (e.g. size, priority, severity) |
| 4 | Nominal | Categorical values without specific orders (e.g. colors, genders, country) |
Transformations
| No | Transforms | Description |
|---|---|---|
| 1 | Aggregate | Perform aggregations |
| 2 | Bin | Discretizes numeric values into a sets of bins (for Histogram) |
| 3 | Filter | Filter certain conditions |
| 4 | Time unit | Convert datetime into ordinal |
| 5 | Calculate | Derive new categorical values based on a formula |
| 6 | Impute | Impute missing data |
| 7 | Lookup | Perform join with lookup table |
Aggregations
| No | Function | Description |
|---|---|---|
| 1 | Mean | Average of values |
| 2 | Sum | Addition of all values |
| 3 | Median | Middle value |
| 4 | Min | Smallest value |
| 5 | Max | Largest value |
| 6 | Count | No of records |
Composition
| No | Function | Description |
|---|---|---|
| 1 | Facet | Partition data to create view for each subset (col / row) |
| 2 | Layer | Place views on top of each other |
| 3 | Concat | Place views side-by-side (hconcat / vconcat) |
| 4 | Repeat | Concat similar views with difference field |
Learn by Examples
- Single View Specification
- Layered & Multi-View Composition
- Interactions with Selection
Single View

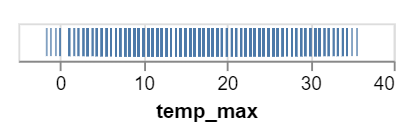
{
  "data": { "url": "data/seattle-weather.csv"},
  "mark": "tick",
  "encoding": {
    "x": {
      "field": "temp_max",
      "type": "quantitative"
    }
  }
}
Strip Plot

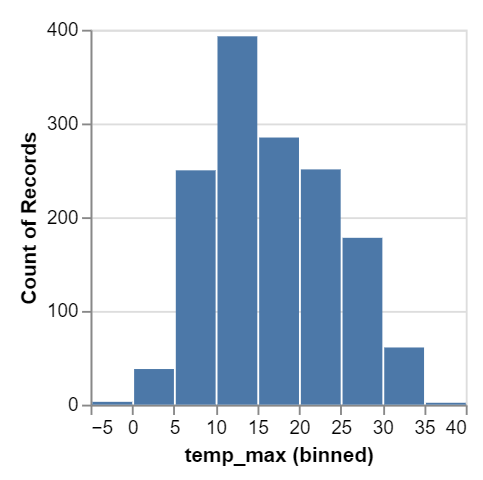
{
  "data": { "url": "data/seattle-weather.csv"},
  "mark": "bar",
  "encoding": {
    "x": {
      "bin": true,
      "field": "temp_max",
      "type": "quantitative"
    },
    "y": {
      "aggregate": "count",
      "type": "quantitative"
    }
  }
}
Histogram
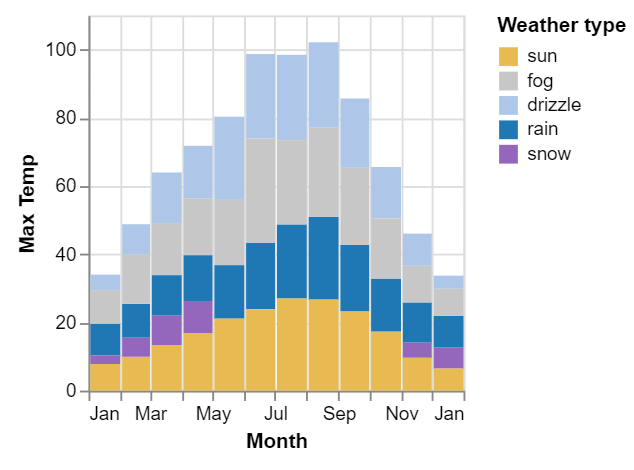
{
  "data": { "url": "data/seattle-weather.csv"},
  "mark": "bar",
  "encoding": {
    "x": {
      "timeUnit": "month",
      "field": "date",
      "title": "Month"
    },
    "y": {
      "aggregate": "mean",
      "field": "temp_max",
      "type": "quantitative",
      "title": "Max Temp"
    },
    "color": {
      "field": "weather",
       "type": "nominal",
      "scale": {
        "domain": ["sun", "fog", "drizzle", "rain", "snow"],
        "range": ["#e7ba52", "#c7c7c7", "#aec7e8", "#1f77b4", "#9467bd"]
      },
      "title": "Weather type"
    }
  }
}
Color & Scale
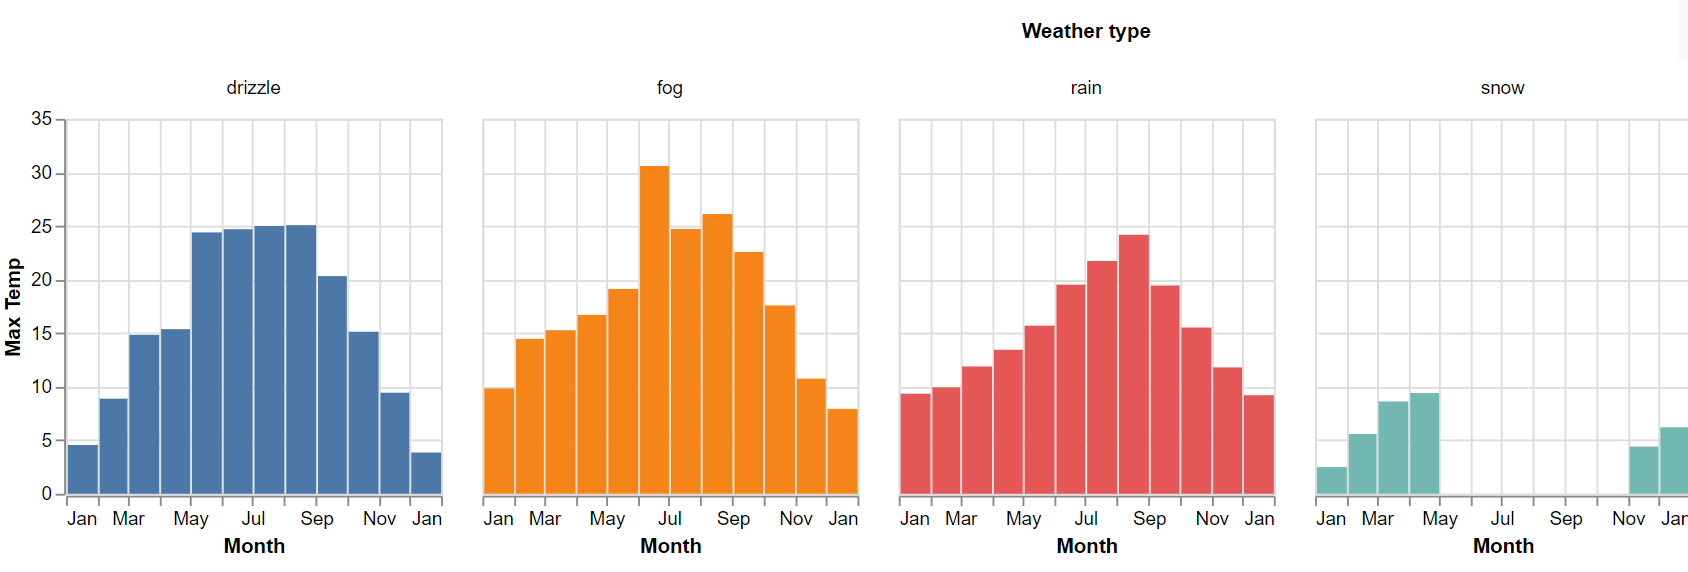
Multi Views

{
  "data": { "url": "data/seattle-weather.csv"},
  "mark": "bar",
  "encoding": {
    ...
    "column": {
      "field": "weather",
       "type": "nominal",
      "title": "Weather type"
    }
  }
}
Facet
{
"data": {"url": "data/seattle-weather.csv"},
"layer": [
{
"mark": "bar",
"encoding": {
"x": {"timeUnit": "month", "field": "date", "title": "Month"},
"y": {
"aggregate": "mean",
"field": "temp_max",
"type": "quantitative",
"title": "Max Temp"
}
}
},
{
"mark": "rule",
"encoding": {
"y": {"aggregate": "mean", "field": "temp_max", "type": "quantitative"},
"color": {"value": "red"},
"size": {"value": 3}
}
}
]
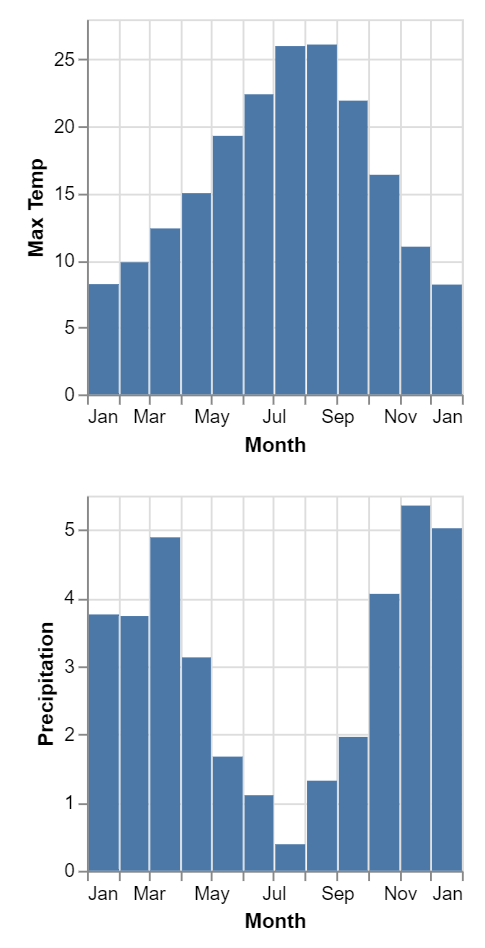
}Layering

{
"data": {"url": "data/seattle-weather.csv"},
"vconcat": [
{
"mark": "bar",
"encoding": {
"x": {"timeUnit": "month", "field": "date", "title": "Month"},
"y": {
"aggregate": "mean",
"field": "temp_max",
"type": "quantitative",
"title": "Max Temp"
}
}
},
{
"mark": "bar",
"encoding": {
"x": {"timeUnit": "month", "field": "date", "title": "Month"},
"y": {
"aggregate": "mean",
"field": "precipitation",
"type": "quantitative",
"title": "Precipitation"
}
}
}
]
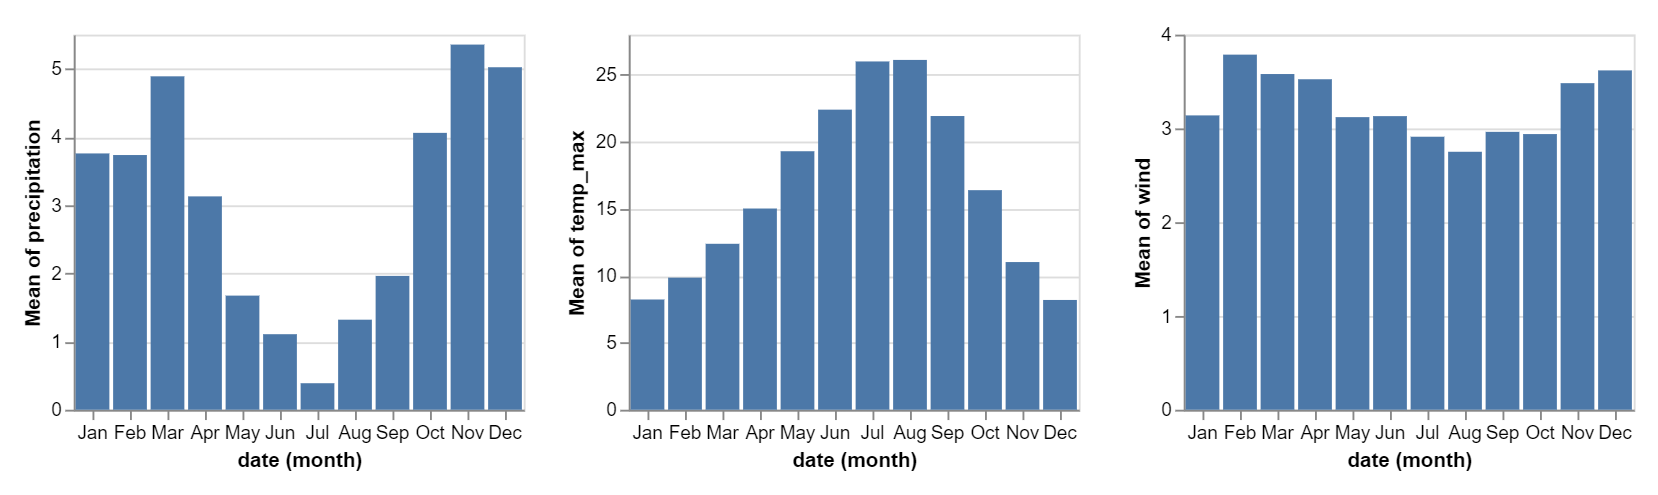
}Concat
{
  "repeat": {"column": ["precipitation", "temp_max", "wind"]},
  "spec": {
    "data": {"url": "data/seattle-weather.csv"},
    "mark": "bar",
    "encoding": {
      "x": {"timeUnit": "month", "field": "date", "type": "ordinal"},
      "y": {
        "aggregate": "mean",
        "field": {"repeat": "column"},
        "type": "quantitative"
      }
    }
  }
}
Repeat
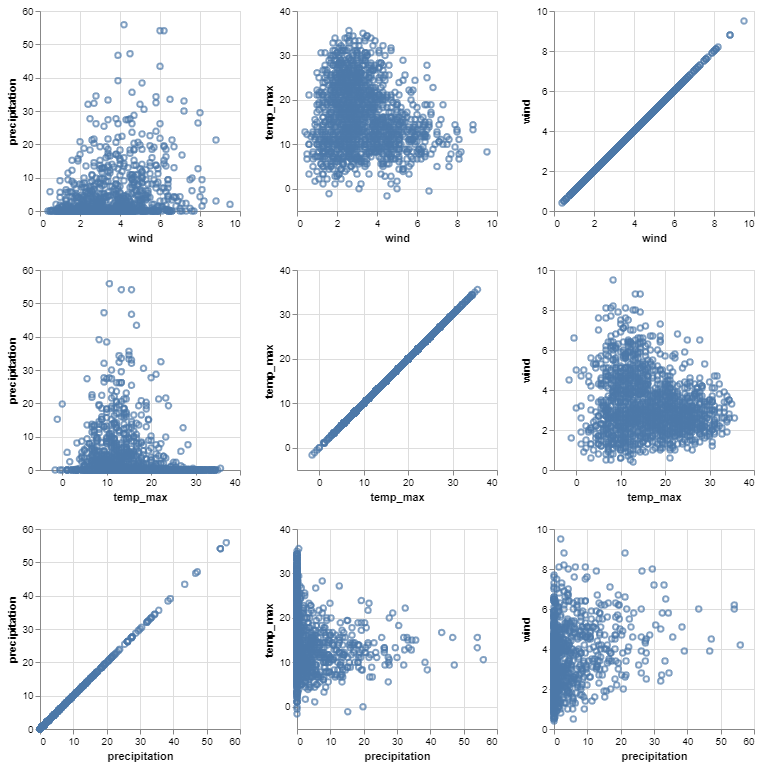
{
  "repeat": {
    "column": ["precipitation", "temp_max", "wind"],
    "row": ["wind", "temp_max", "precipitation"]

  },
  "spec": {
    "data": {"url": "data/seattle-weather.csv"},
    "mark": "point",
    "encoding": {
      "x": {
        "field": {"repeat": "row"},
        "type": "quantitative"
      },
      "y": {
        "field": {"repeat": "column"},
        "type": "quantitative"
      }
    }
  }
}
Repeat Both Axes

All Together
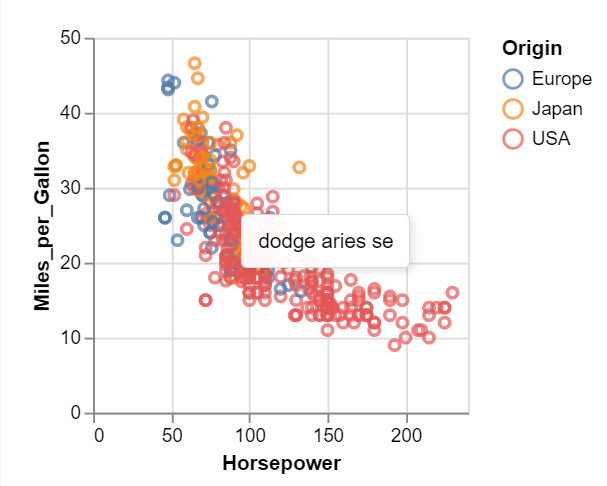
Interactions

{
  "data": {"url": "data/cars.json"},
  "mark": "point",
  "transform": [{
    "calculate": "'https://www.google.com/search?q=' + datum.Name", "as": "url"
  }],
  "encoding": {
    "x": {"field": "Horsepower", "type": "quantitative"},
    "y": {"field": "Miles_per_Gallon", "type": "quantitative"},
    "color": {"field": "Origin", "type": "nominal"},
    "tooltip": {"field": "Name", "type": "nominal"},
    "href": {"field": "url", "type": "nominal"}
  }
}
Tooltip & Link
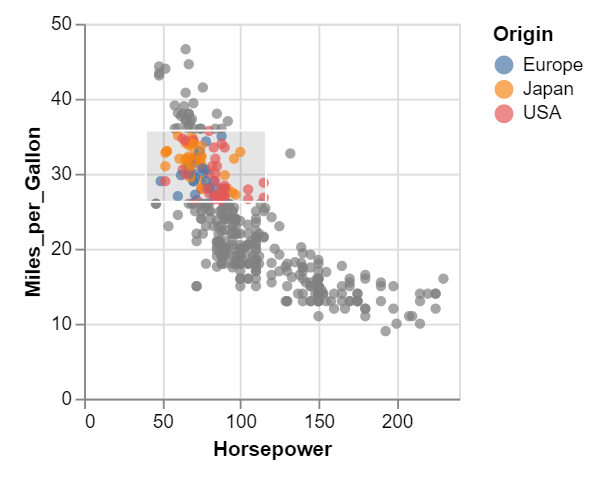
{
  "data": { "url": "data/cars.json"},
  "mark": "circle",
  "params": [{
    "name": "brush",
    "select": "interval"
  }],
  "encoding": {
    "x": {
      "field": "Horsepower",
      "type": "quantitative"
    },
    "y": {
      "field": "Miles_per_Gallon",
      "type": "quantitative"
    },
    "color": {
      "condition": {"param": "brush", "field": "Origin", "type": "nominal"},
      "value": "grey"
    }
  }
}
Selection
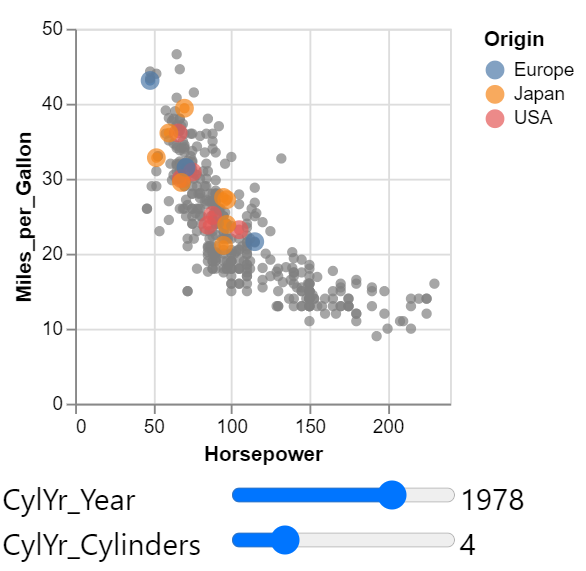
{
  "data": {"url": "data/cars.json"},
  "transform": [{"calculate": "year(datum.Year)", "as": "Year"}],
  "layer": [{
    "params": [{
      "name": "CylYr",
      "value": [{"Cylinders": 4, "Year": 1977}],
      "select": {"type": "point", "fields": ["Cylinders", "Year"]},
      "bind": {
        "Cylinders": {"input": "range", "min": 3, "max": 8, "step": 1},
        "Year": {"input": "range", "min": 1969, "max": 1981, "step": 1}
      }
    }],
    "mark": "circle",
    "encoding": {
      "x": {"field": "Horsepower", "type": "quantitative"},
      "y": {"field": "Miles_per_Gallon", "type": "quantitative"},
      "color": {
        "condition": {"param": "CylYr", "field": "Origin", "type": "nominal"},
        "value": "grey"
      }
    }
  }, {
    "transform": [{"filter": {"param": "CylYr"}}],
    "mark": "circle",
    "encoding": {
      "x": {"field": "Horsepower", "type": "quantitative"},
      "y": {"field": "Miles_per_Gallon", "type": "quantitative"},
      "color": {"field": "Origin", "type": "nominal"},
      "size": {"value": 100}
    }
  }]
}
Input Selection
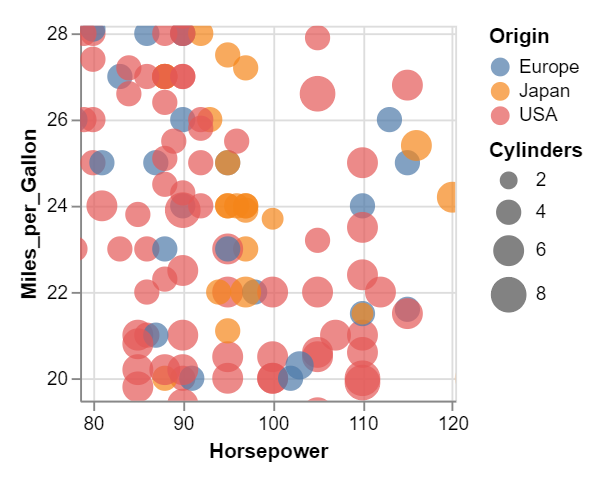
{
  "data": {"url": "data/cars.json"},
  "params": [
    {"name": "grid", "select": "interval", "bind": "scales"}
  ],
  "mark": "circle",
  "encoding": {
    "x": {
      "field": "Horsepower",
      "type": "quantitative",
      "scale": {"domain": {"param": "grid"}}
    },
    "y": {
      "field": "Miles_per_Gallon",
      "type": "quantitative",
      "scale": {"domain": {"param": "grid"}}
    },
    "size": {"field": "Cylinders", "type": "quantitative"},
    "color": {"field": "Origin", "type": "nominal"}
  }
}
Zoom
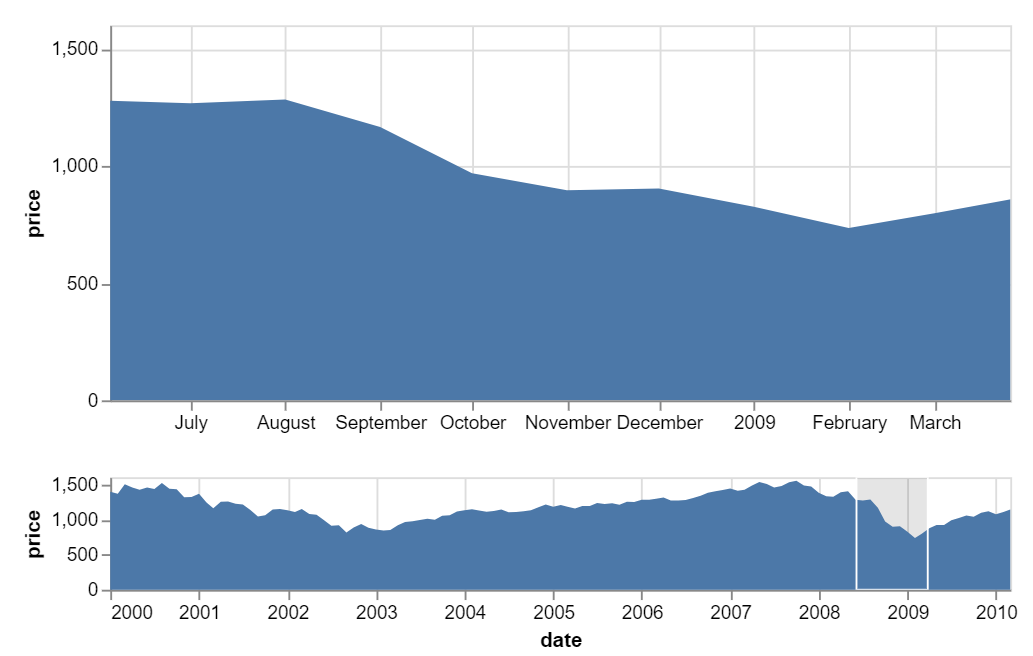
{
  "data": {"url": "data/sp500.csv"},
  "vconcat": [
    {
      "width": 480,
      "mark": "area",
      "encoding": {
        "x": {
          "field": "date",
          "type": "temporal",
          "scale": {"domain": {"param": "brush"}},
          "axis": {"title": ""}
        },
        "y": {"field": "price", "type": "quantitative"}
      }
    },
    {
      "width": 480,
      "height": 60,
      "mark": "area",
      "params": [
        {"name": "brush", "select": {"type": "interval", "encodings": ["x"]}}
      ],
      "encoding": {
        "x": {"field": "date", "type": "temporal"},
        "y": {
          "field": "price",
          "type": "quantitative",
          "axis": {"tickCount": 3, "grid": false}
        }
      }
    }
  ]
}
Overview & Detail
Resources
Vega-lite: A Visualization Grammar
By Wan Mohd Hafiz


