what does data visualization mean to you?
Write down on paper...
Data Visualization
an intersection of many ways of thinking
objectives
See how data viz is at the intersection of many fields
Understand why CS is valuable for visualization
Look at and critique one set of data in several visual forms
Add color and annotations to one of those visualizations
data visualization designer and engineer
Who am I?
what does data visualization mean to Me?
Data visualization is about...
data
Data visualization is about...
data journalism
Data visualization is about...

making discoveries with data
Data visualization is about...
informing choices

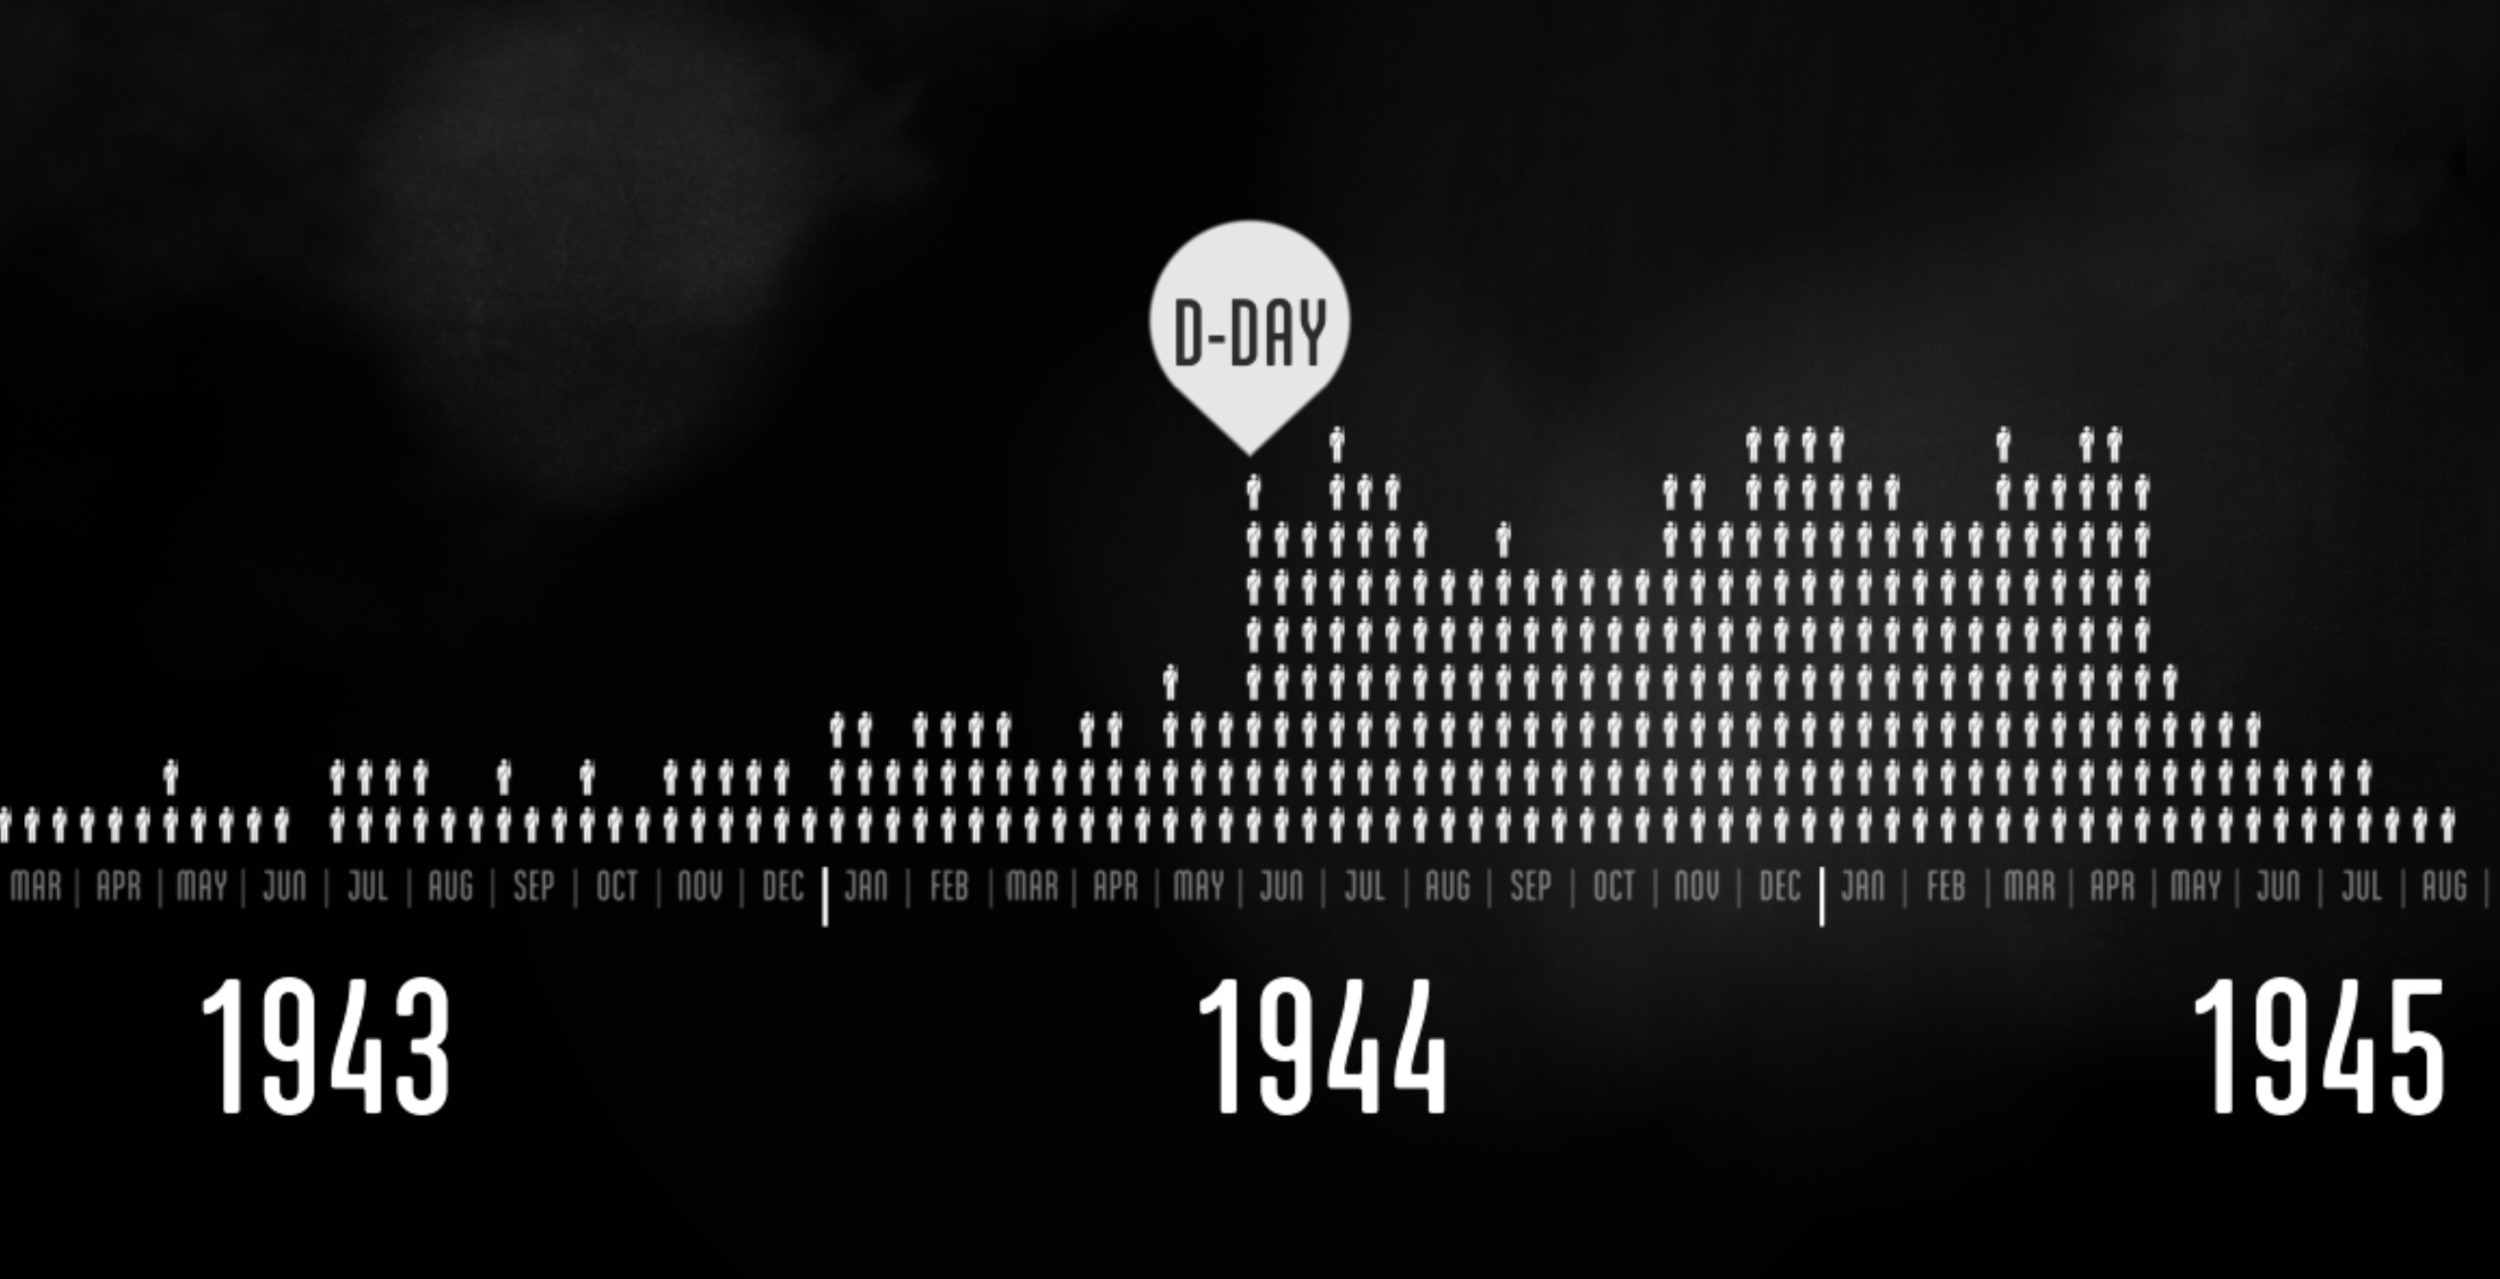
Data visualization is about...
life and death

Data visualization is about...
graphic design

Data visualization is about...
interaction design
Data visualization is about...
Data-driven design

Data visualization is about...
Making sense of lots of data
Data visualization is about...
Making sense of lots and lots of data
Data visualization is about...
relating information and events

Data visualization is about...
storytelling
Data visualization is about...
building with tools
Data visualization is about...
building with math & code
Data visualization is about...
understanding algorithms

Data visualization is about...
drawing with math
Data visualization is about...
visual perception

Data visualization is about...
explanations
Data visualization is about...
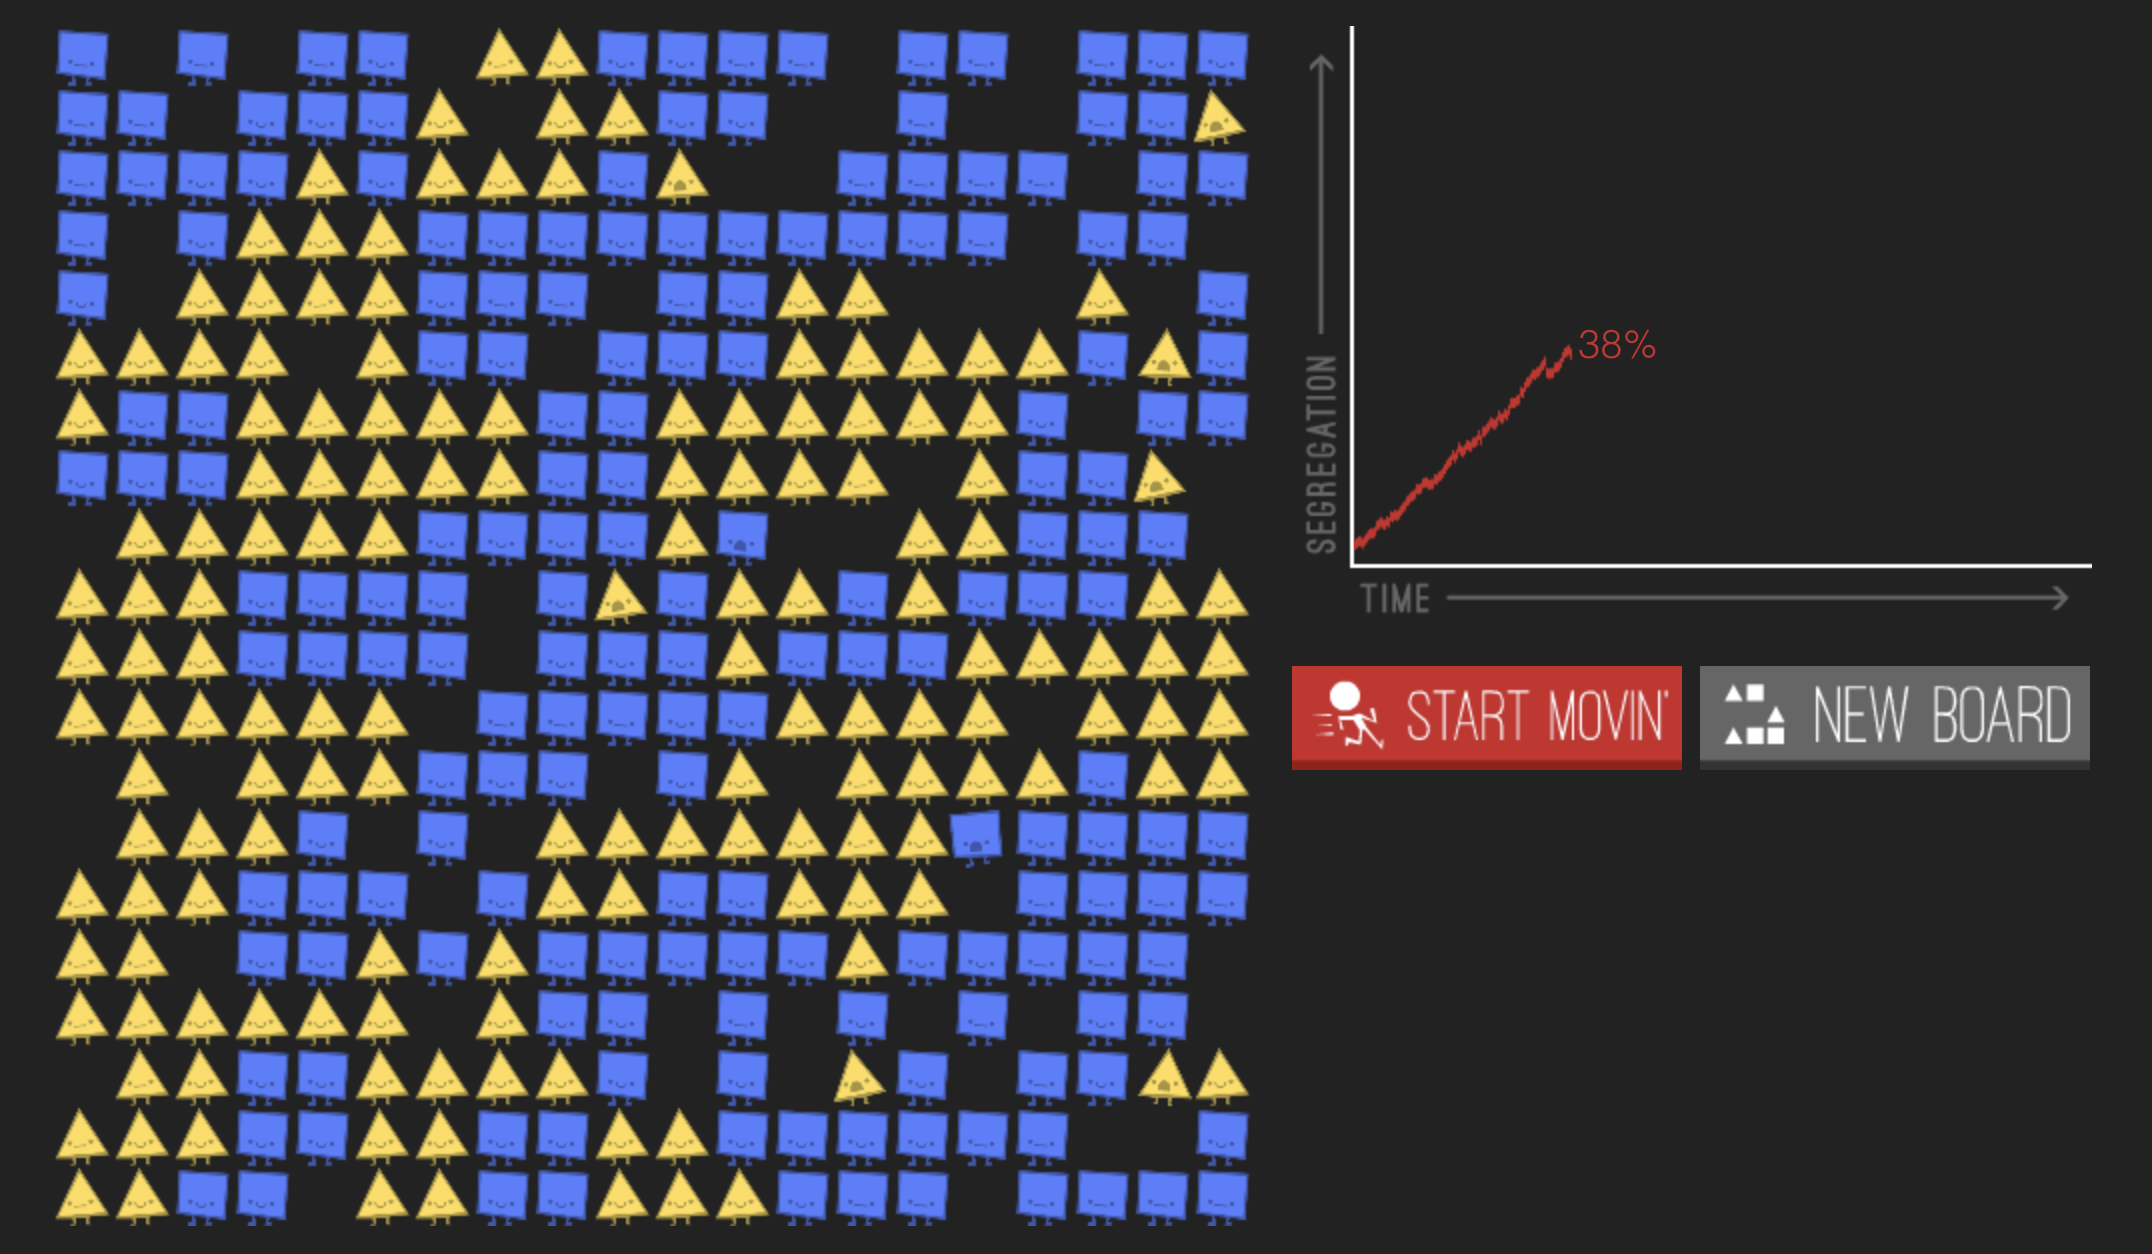
simulations
Data visualization is about...
learning about people

Data visualization is about...
being playful

Data visualization is about...
being impactful

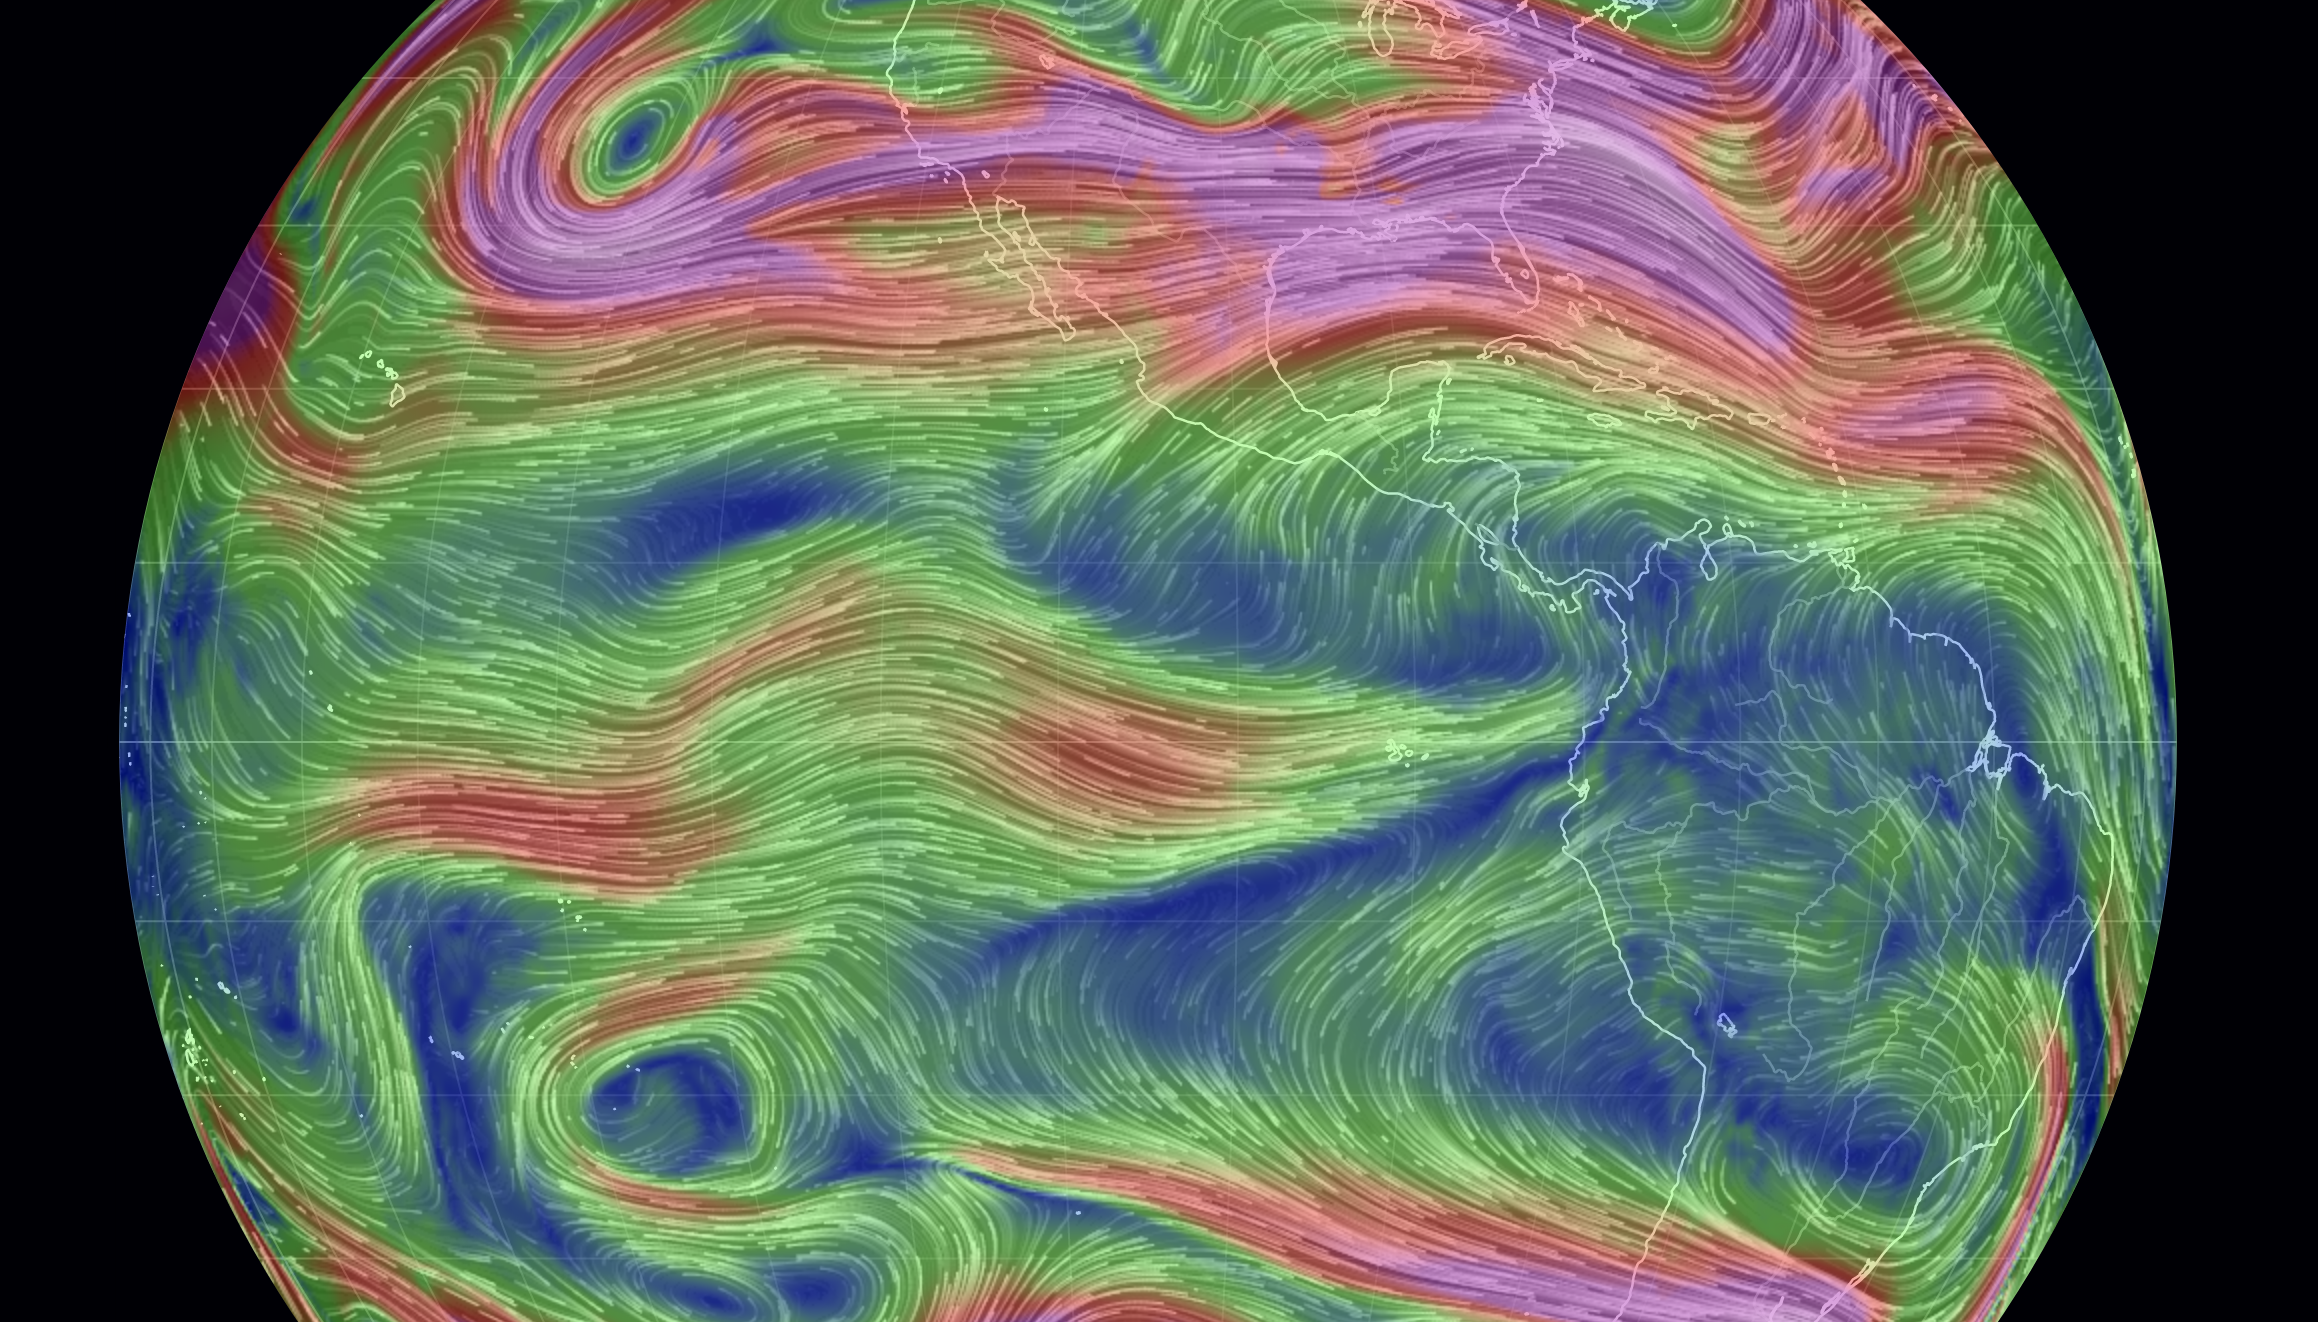
Data visualization is about...
changing how we experience data
Data visualization is about...
interpreting statistical methods

Data visualization is about...
asking questions of data

Data visualization is about...
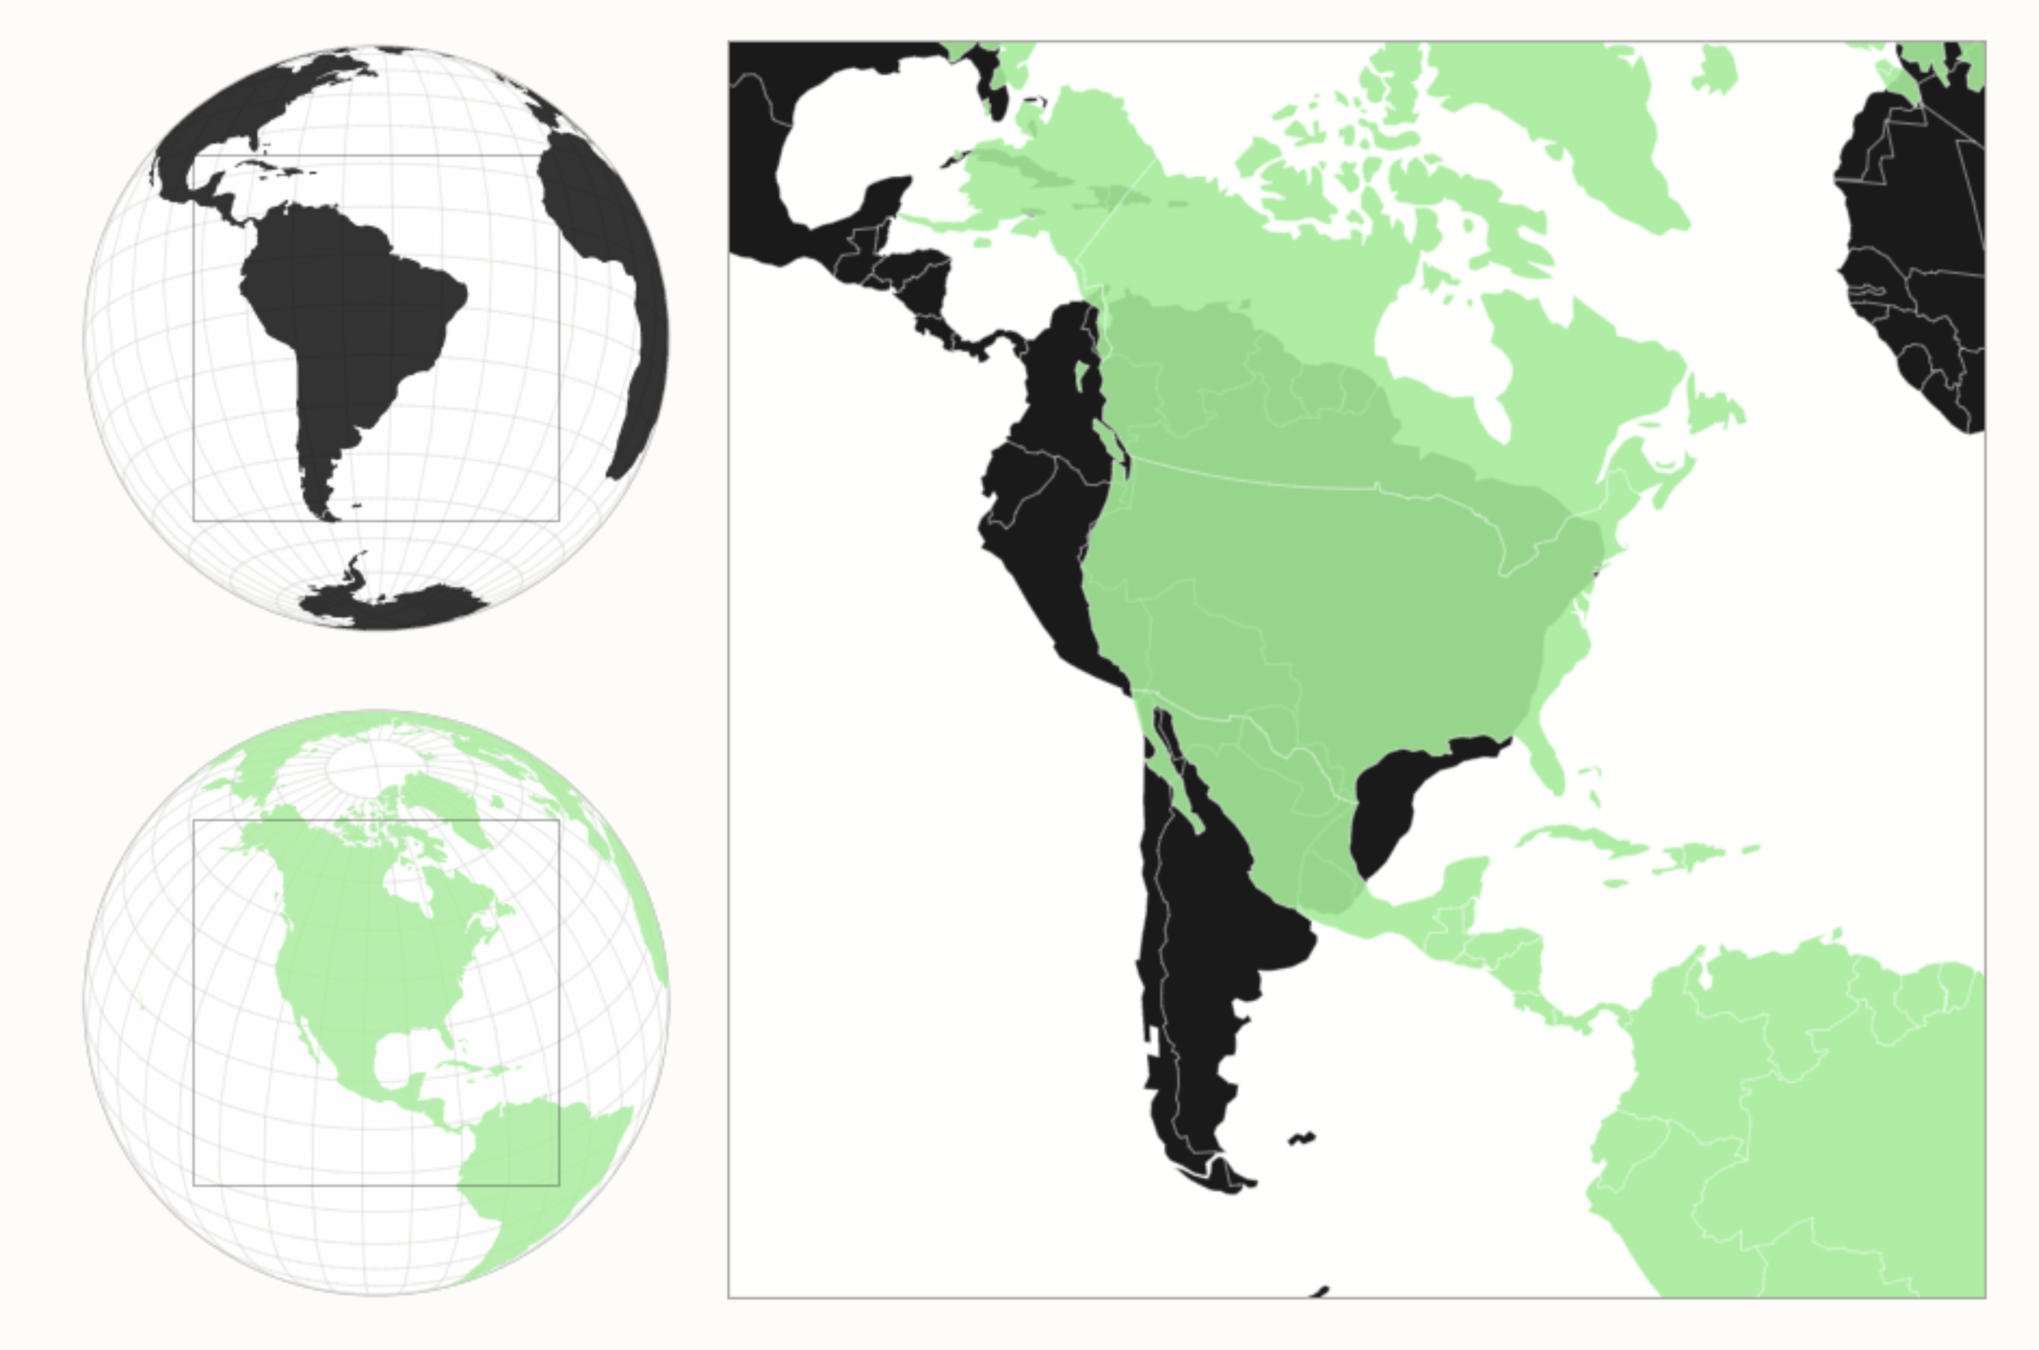
changing our perspective

Data visualization is about...
seeing something familiar in a different context
Data visualization is about...
Beauty
Data visualization is about...
Revealing underlying patterns
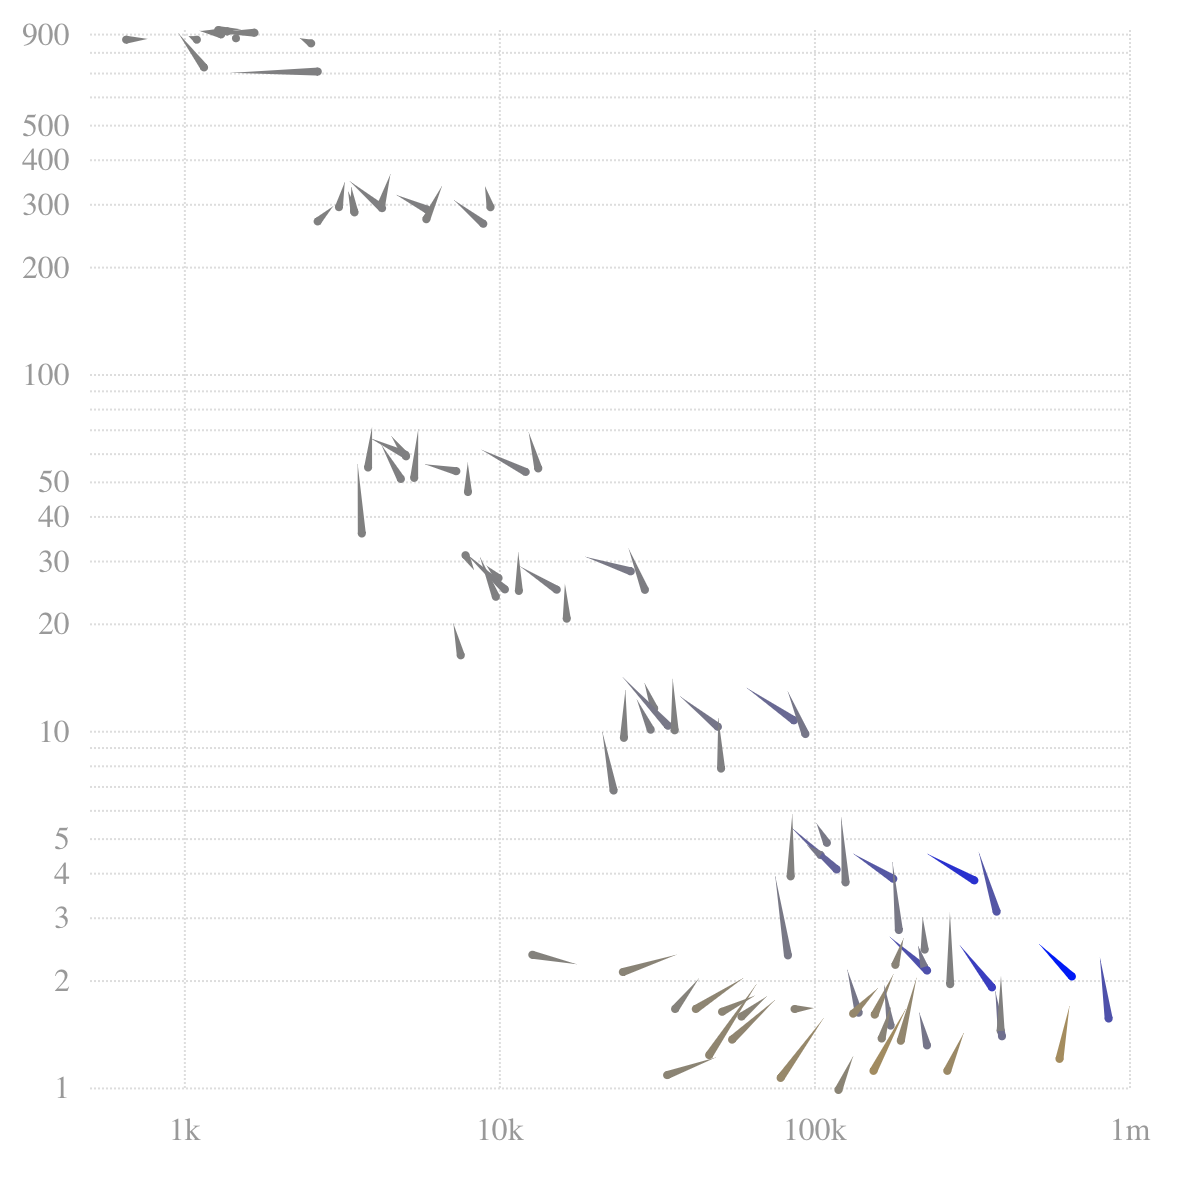
number of births
deaths per 1000 births
Data visualization is about...
influencing decisions

Data visualization is ...
Inherently interdisciplinary
and
collaborative
what does data visualization have to do with Computer science?
You don't need code to visualize data
You don't need a computer to visualize data.
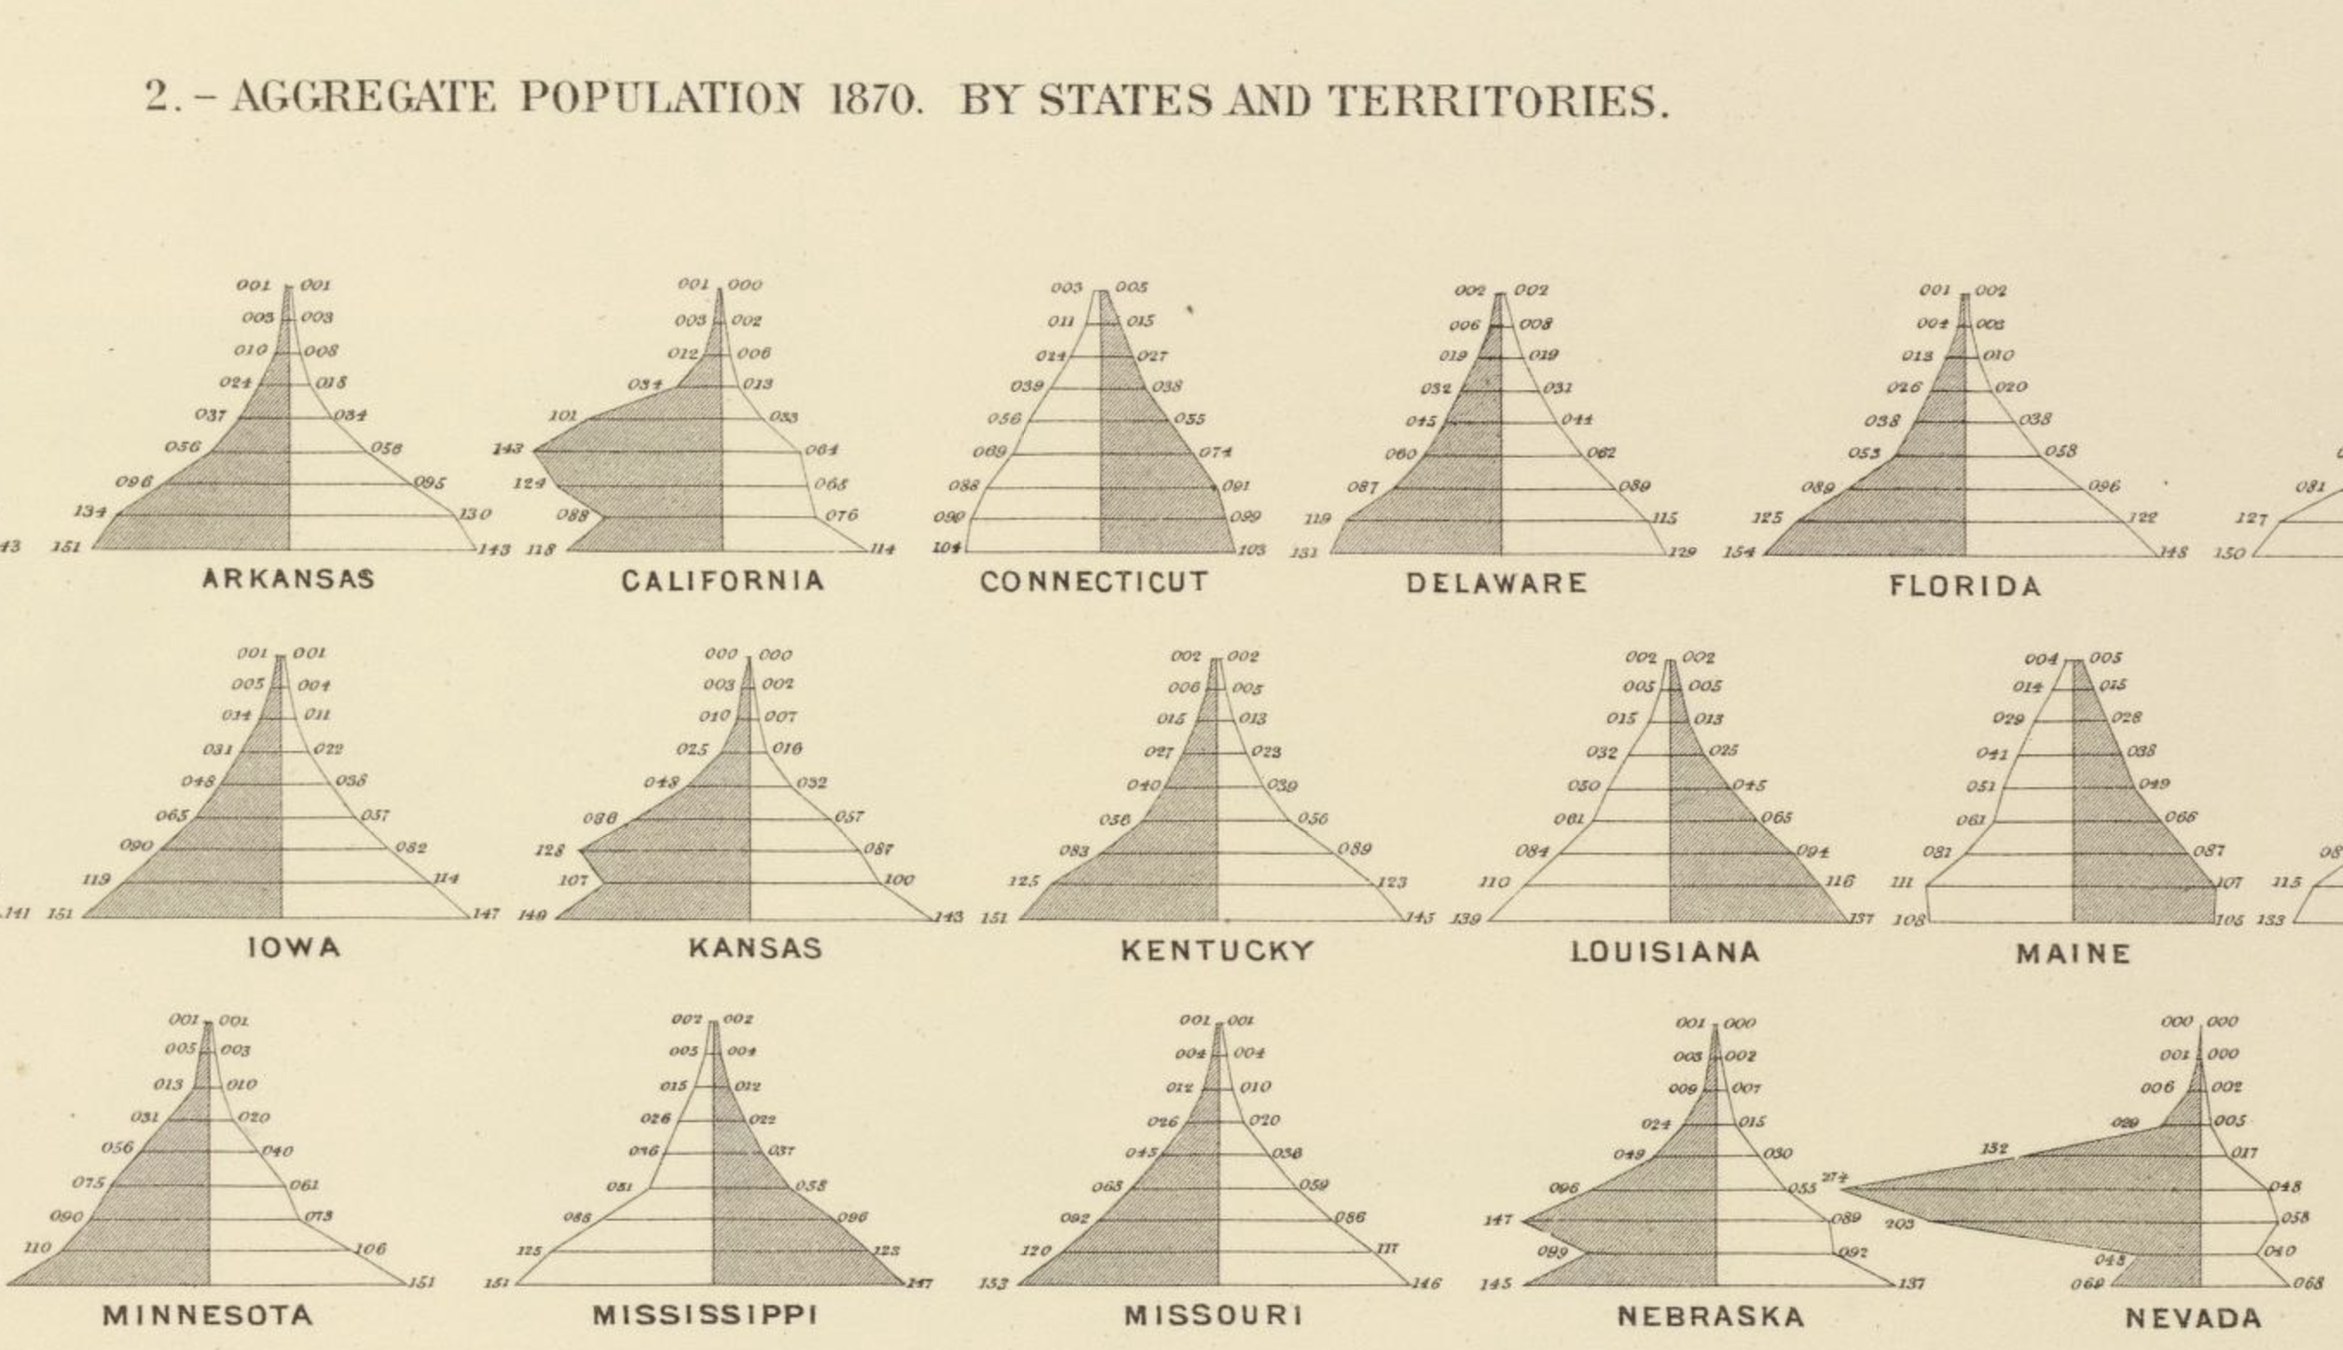
Statistical Atlas of the United States - 1870 Census Data
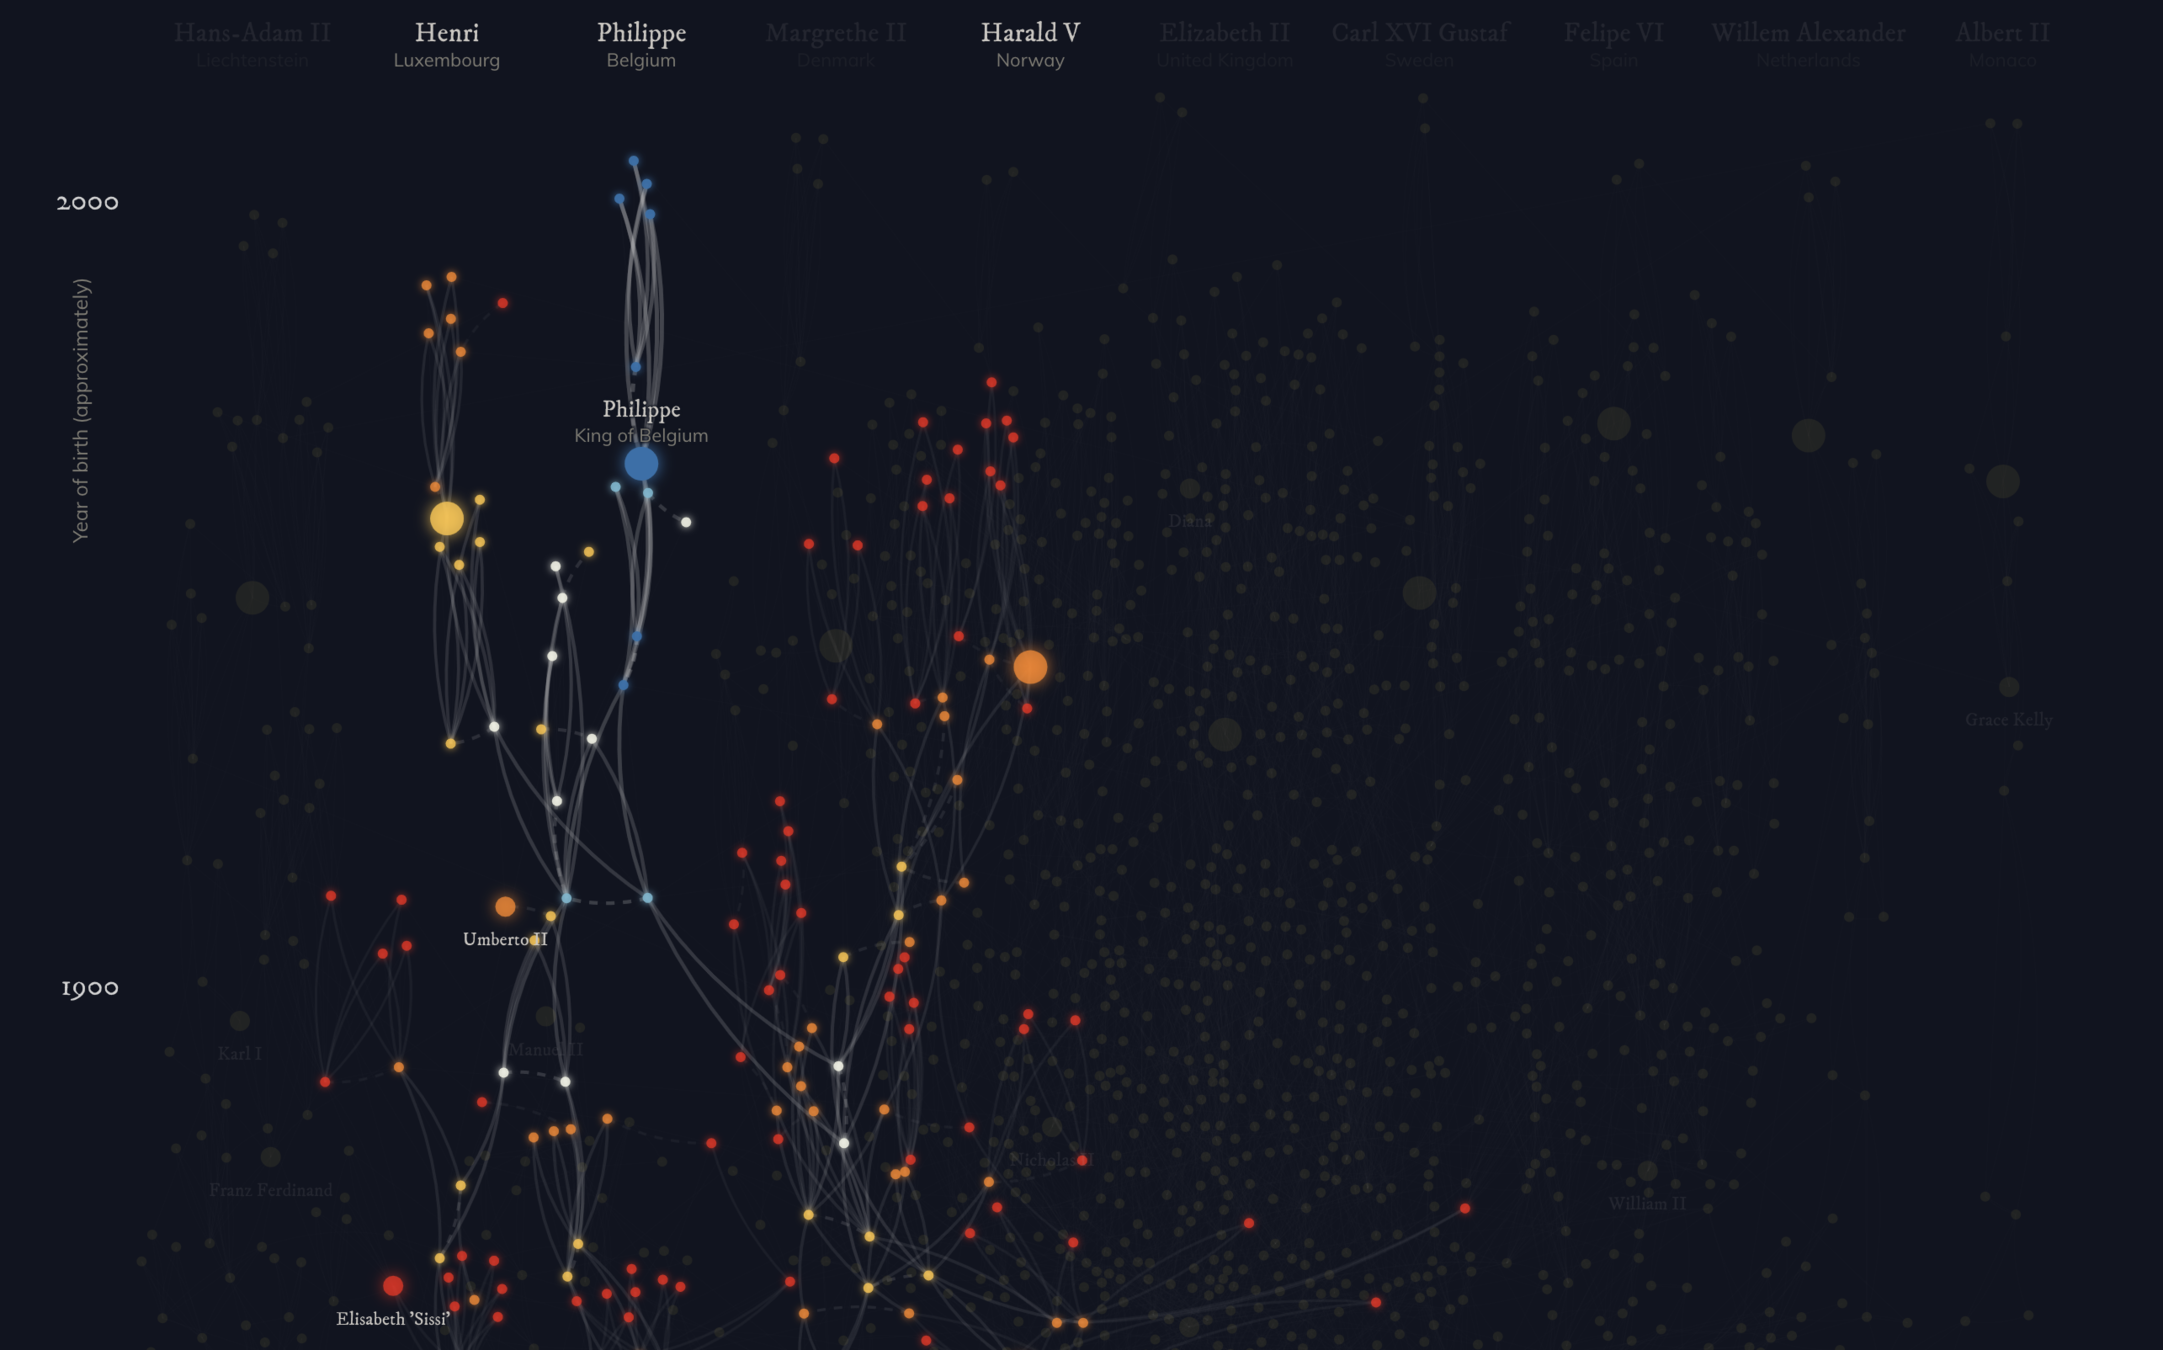
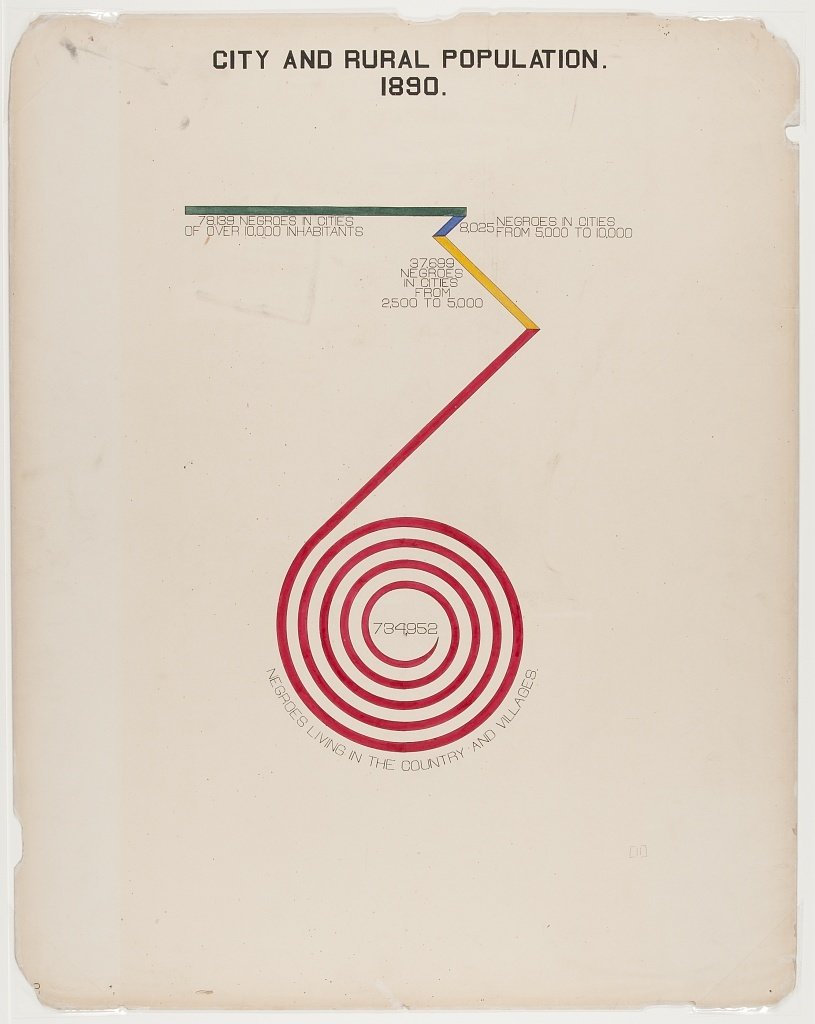
W.E.B Du Bois - "The American Negro" at 1900 Paris Expo
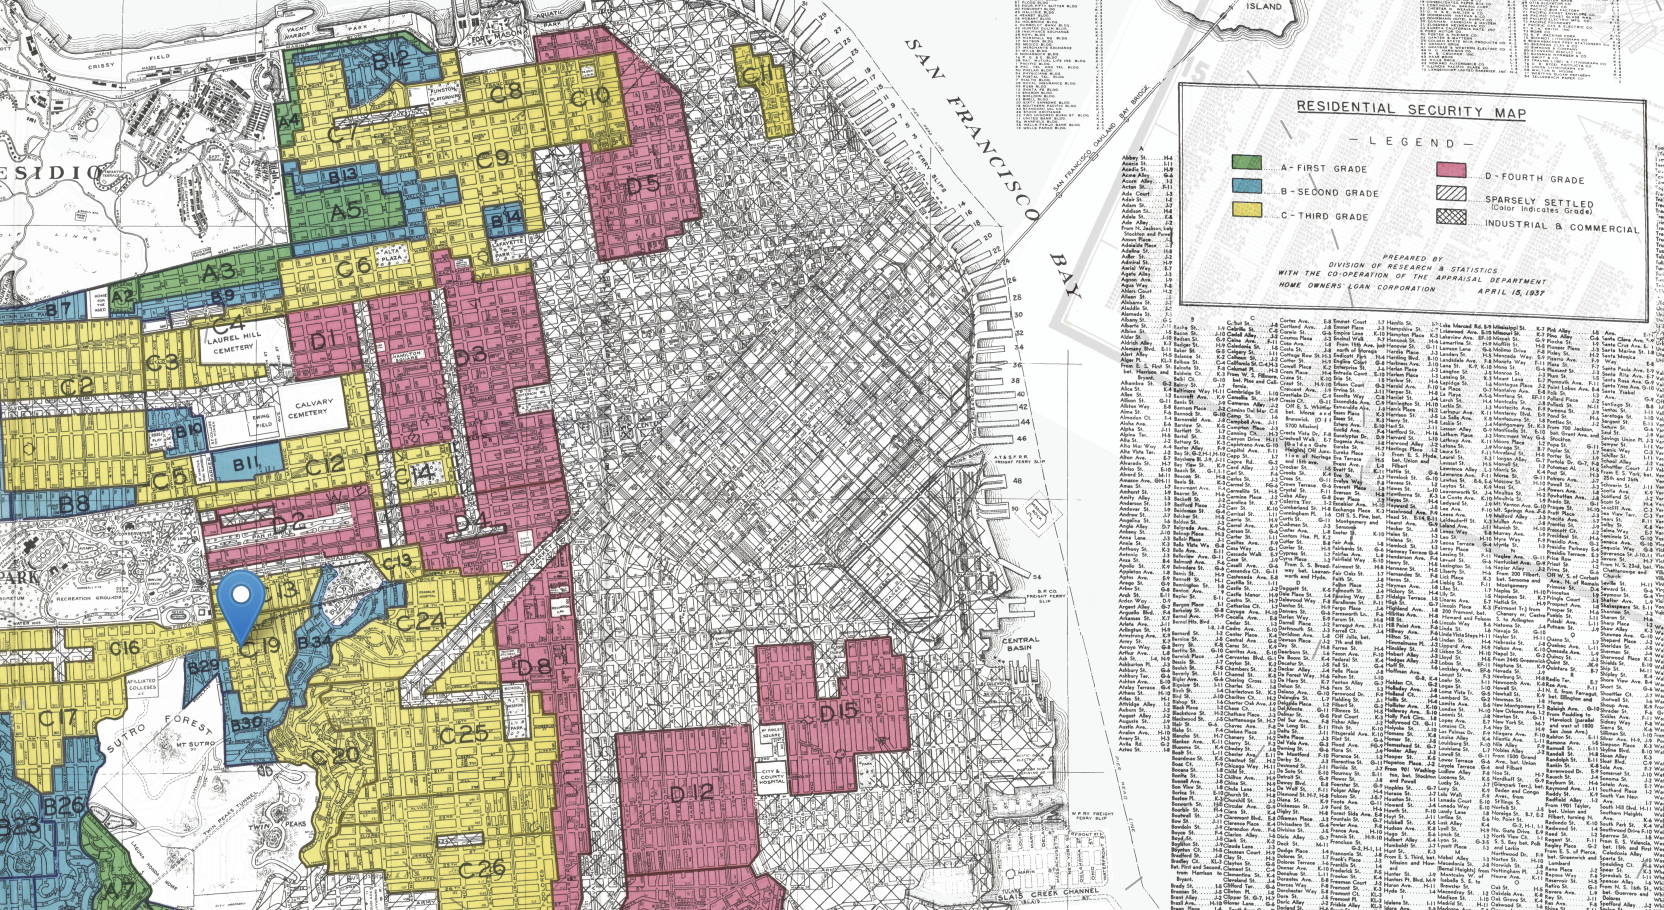
"Redlining" maps - Home Owners Loan Corporation - 1930's
Dear Data Postcard Project - 2015

Drawing/illustration
pen/paper
But, computers are
a useful tool for visualizing data.
They can help us draw.
Drawing/illustration
pen/paper or with tools like Adobe Illustrator, Paper, etc
Viz Illustrated with Adobe Illustrator

Data drawing with Fifty-Three's iPad Paper app

Drawing/illustration
pen/paper or with tools like Adobe Illustrator, Paper, etc
GUI Charting tools
Spreadsheets like Excel, Google Sheets
Viz tools like Tableau
Sample business visualization made in Excel - 2018
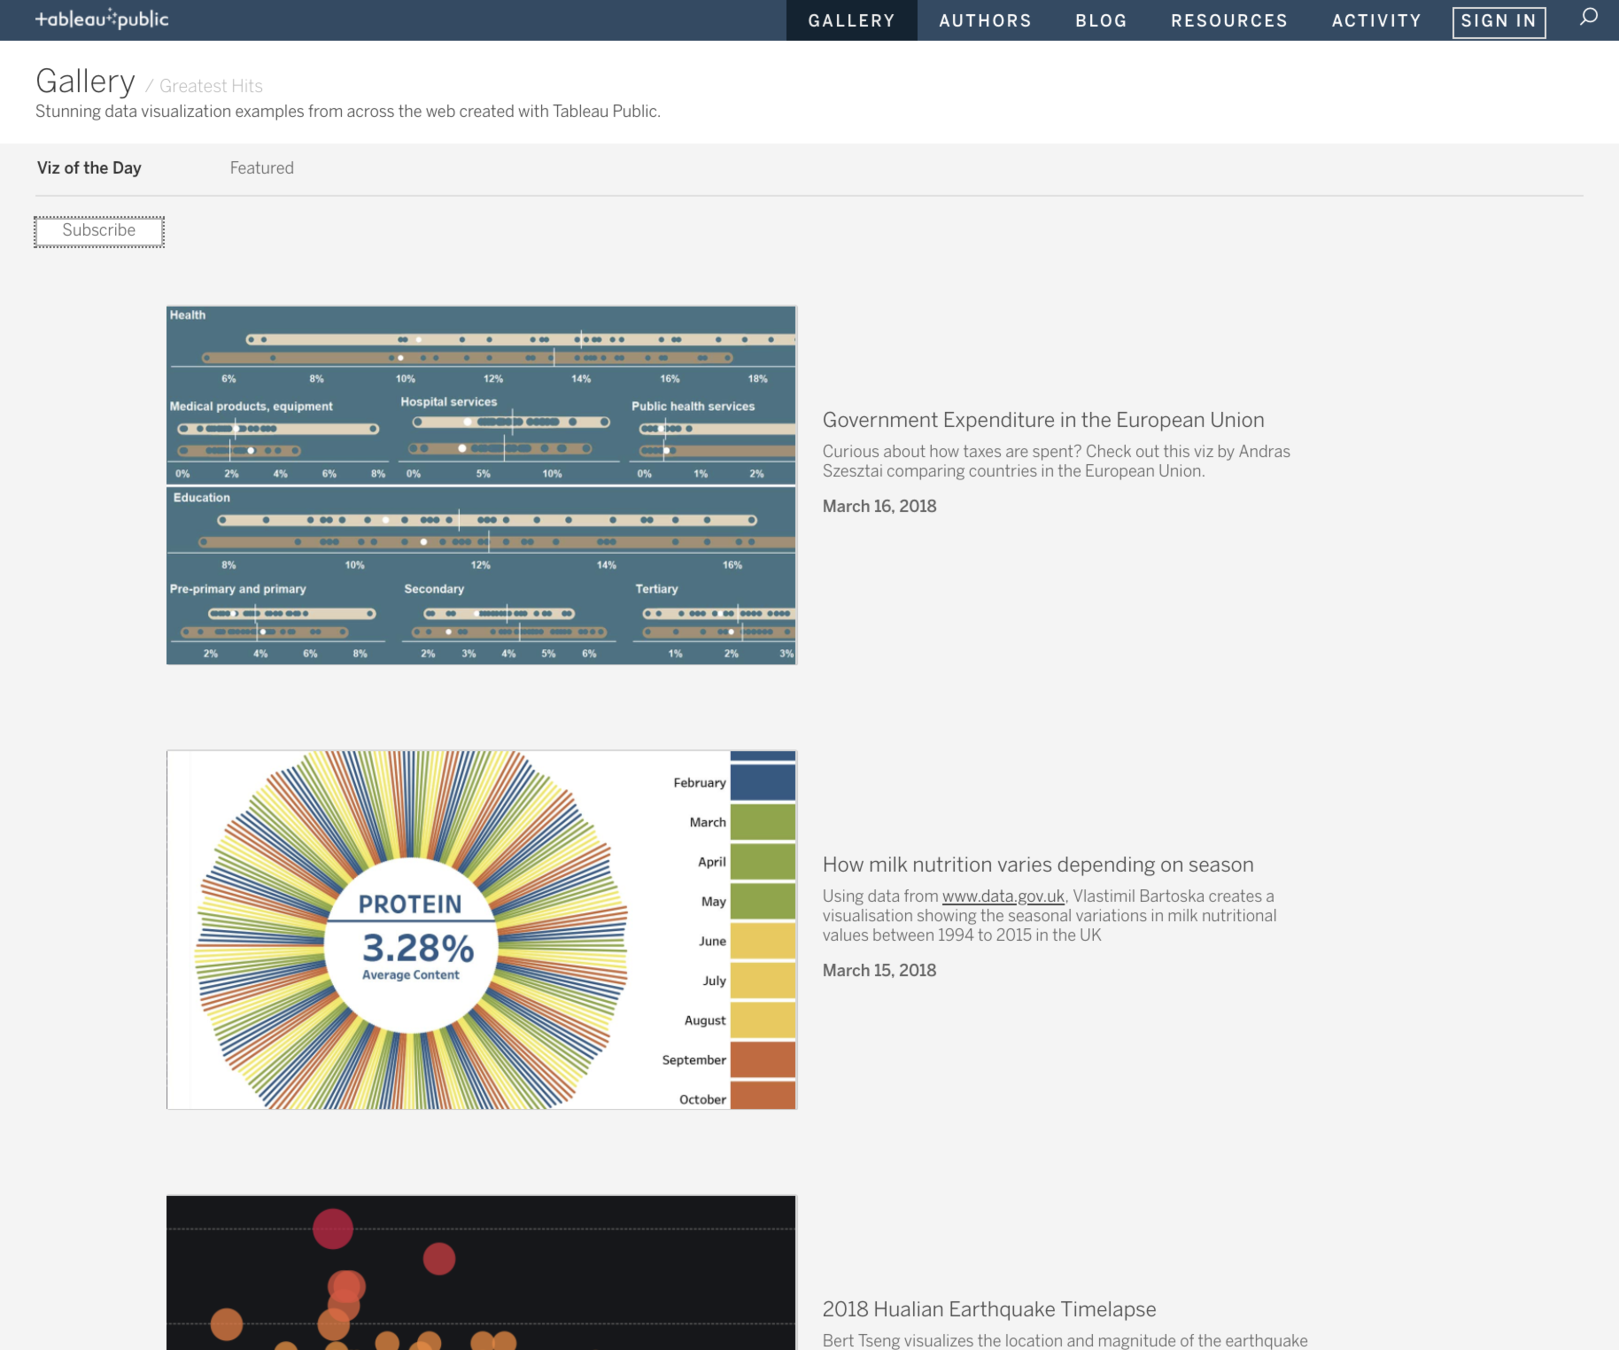
Storytelling with Data - chart by Elizabeth Ricks

Contest entry, created with Tableau Public - 2018
Storytelling with Data - by Sarah

Writing code vastly expands what's possible
Drawing/illustration
pen/paper or with tools like Adobe Illustrator, Paper, etc
GUI Charting tools
Spreadsheets like Excel, Google Sheets
Viz tools like Tableau
code charting tools
Ggplot2 in R, matplotlib and Seaborn in Python, vega and nvd3 and highcharts in Javascript
Code: as part of data analysis

Text
Drawing/illustration
pen/paper or with tools like Adobe Illustrator, Paper, etc
GUI Charting tools
Spreadsheets like Excel, Google Sheets
Viz tools like Tableau
code charting tools
Ggplot2 in R, matplotlib and Seaborn in Python, vega and nvd3 and highcharts in Javascript
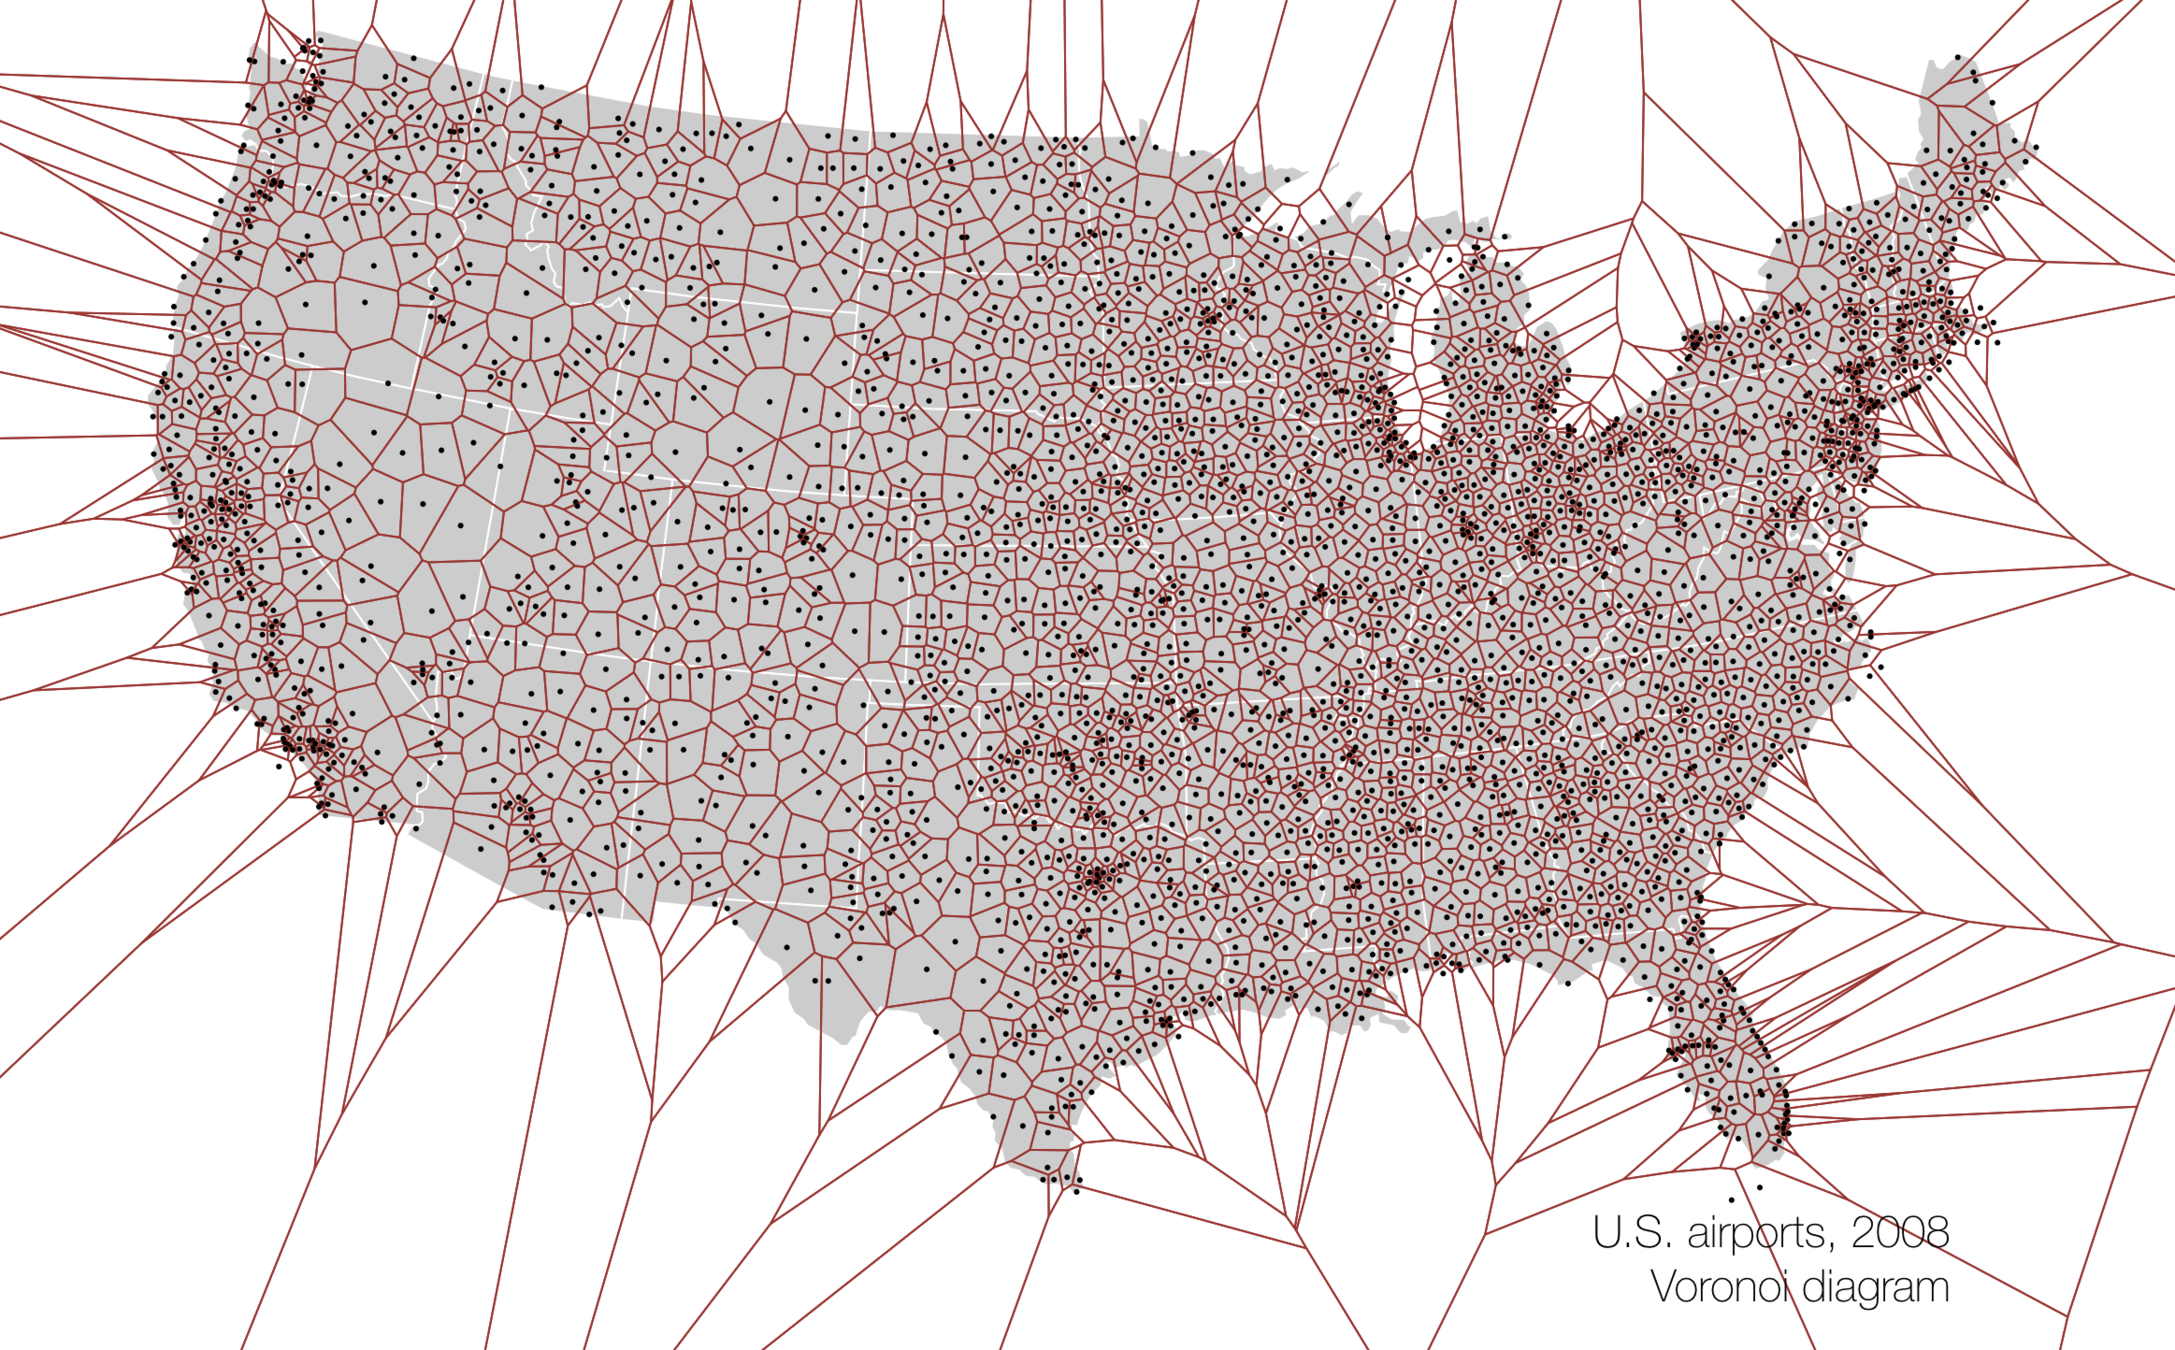
Using code to draw with data
D3 in Javascript, pixi.js and three.js in WebGL
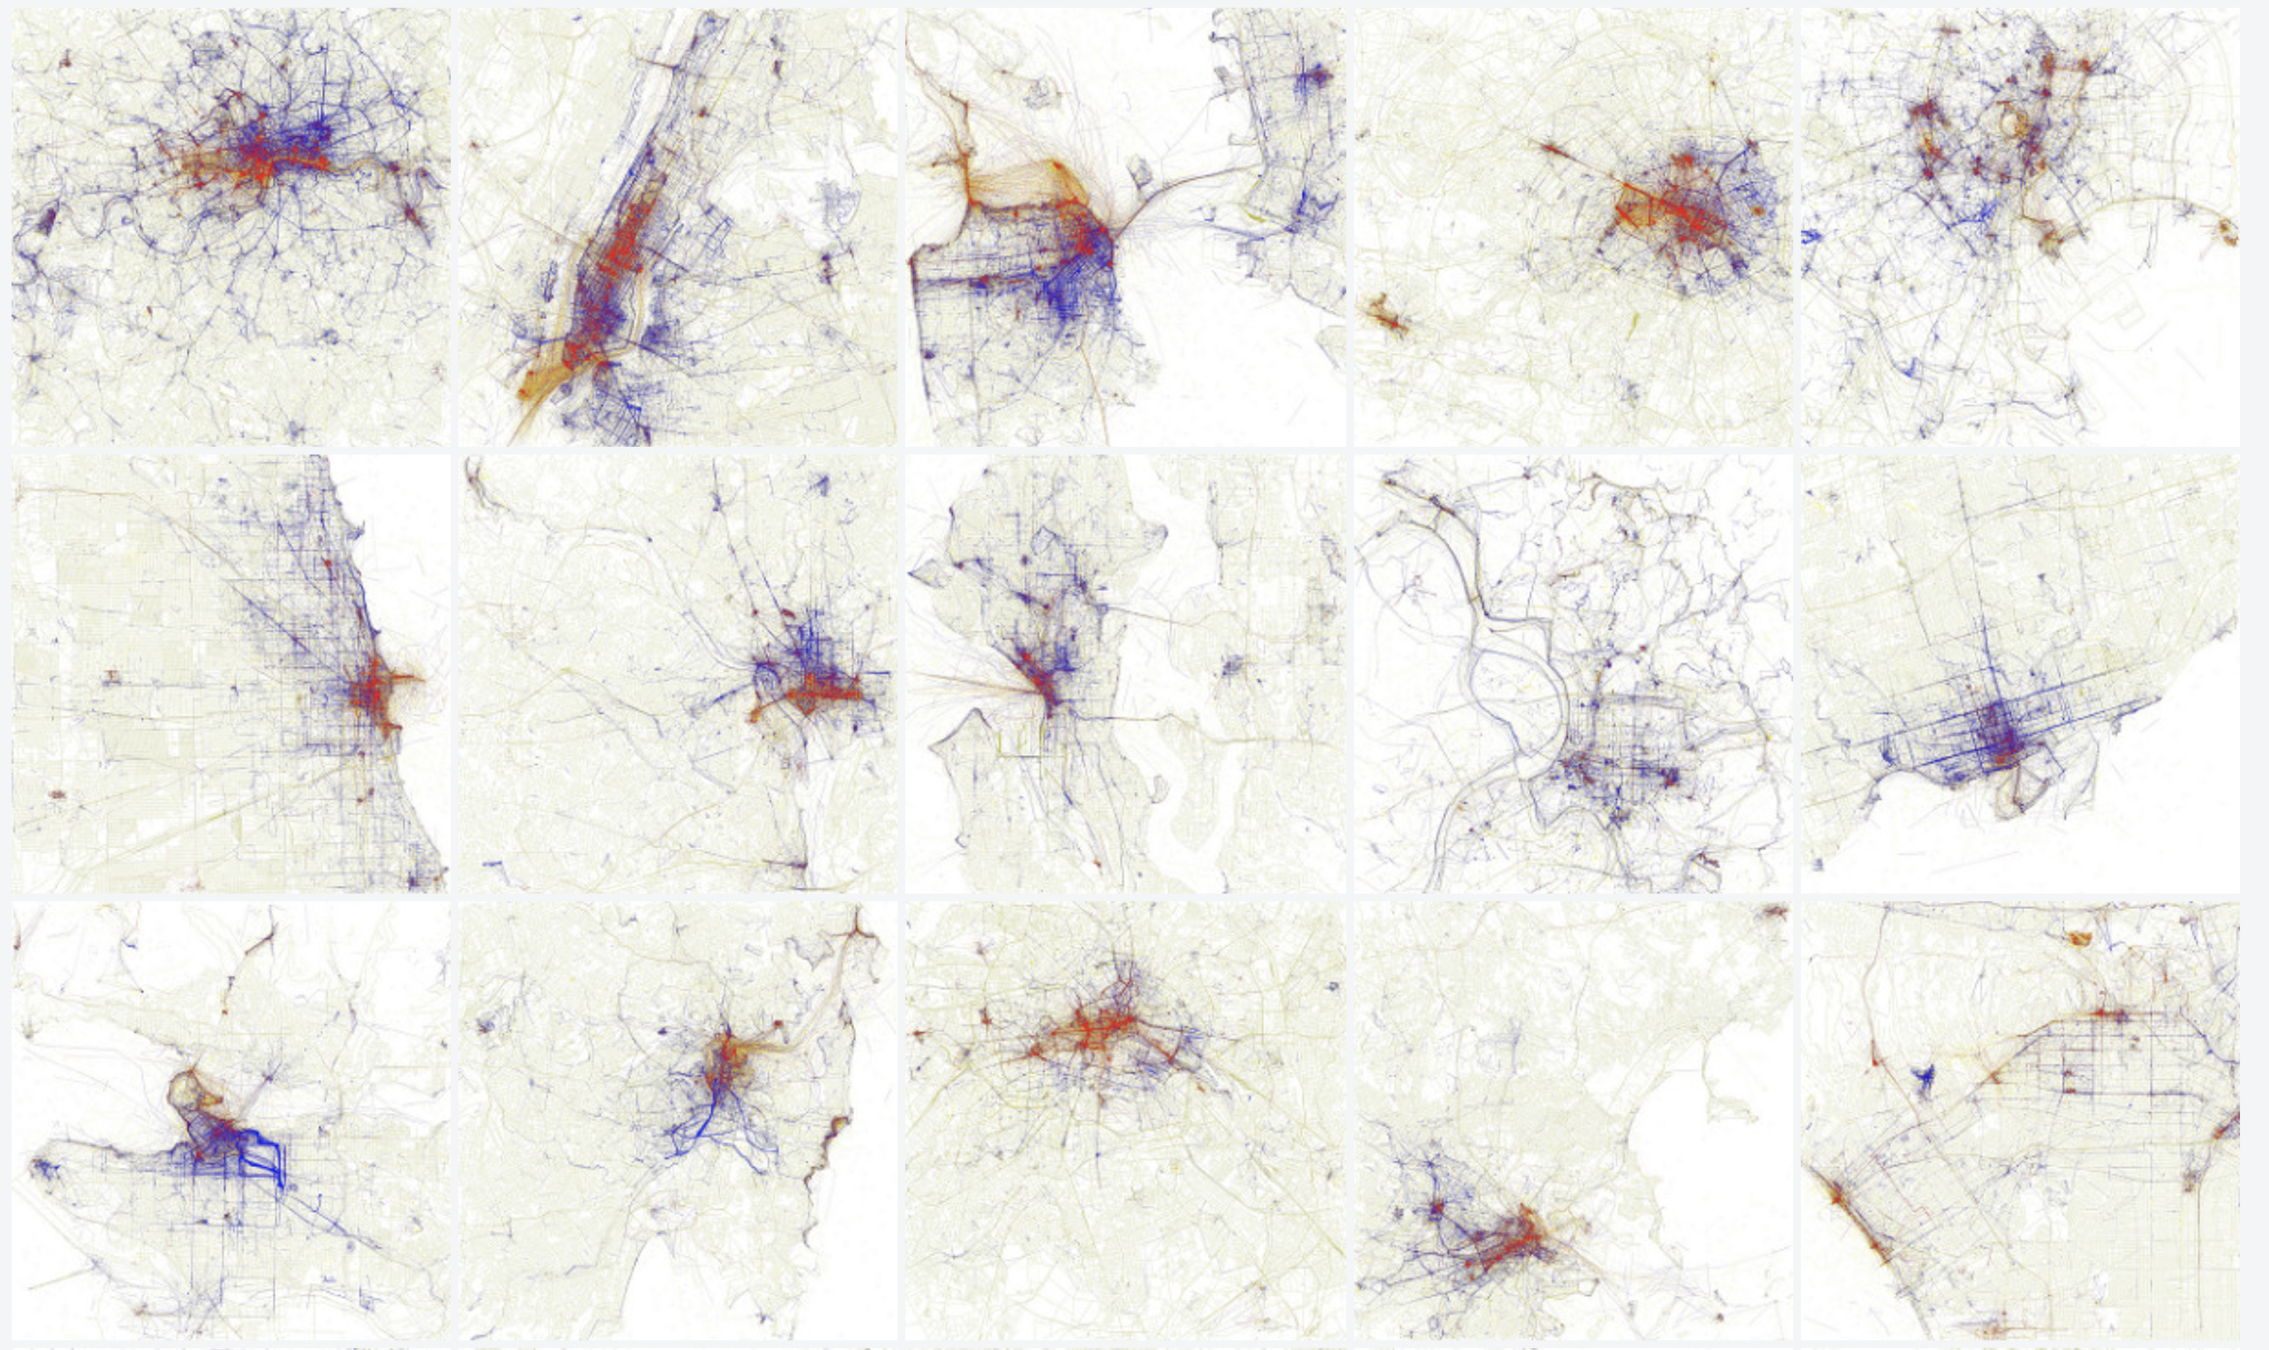
Early data visualization created with code


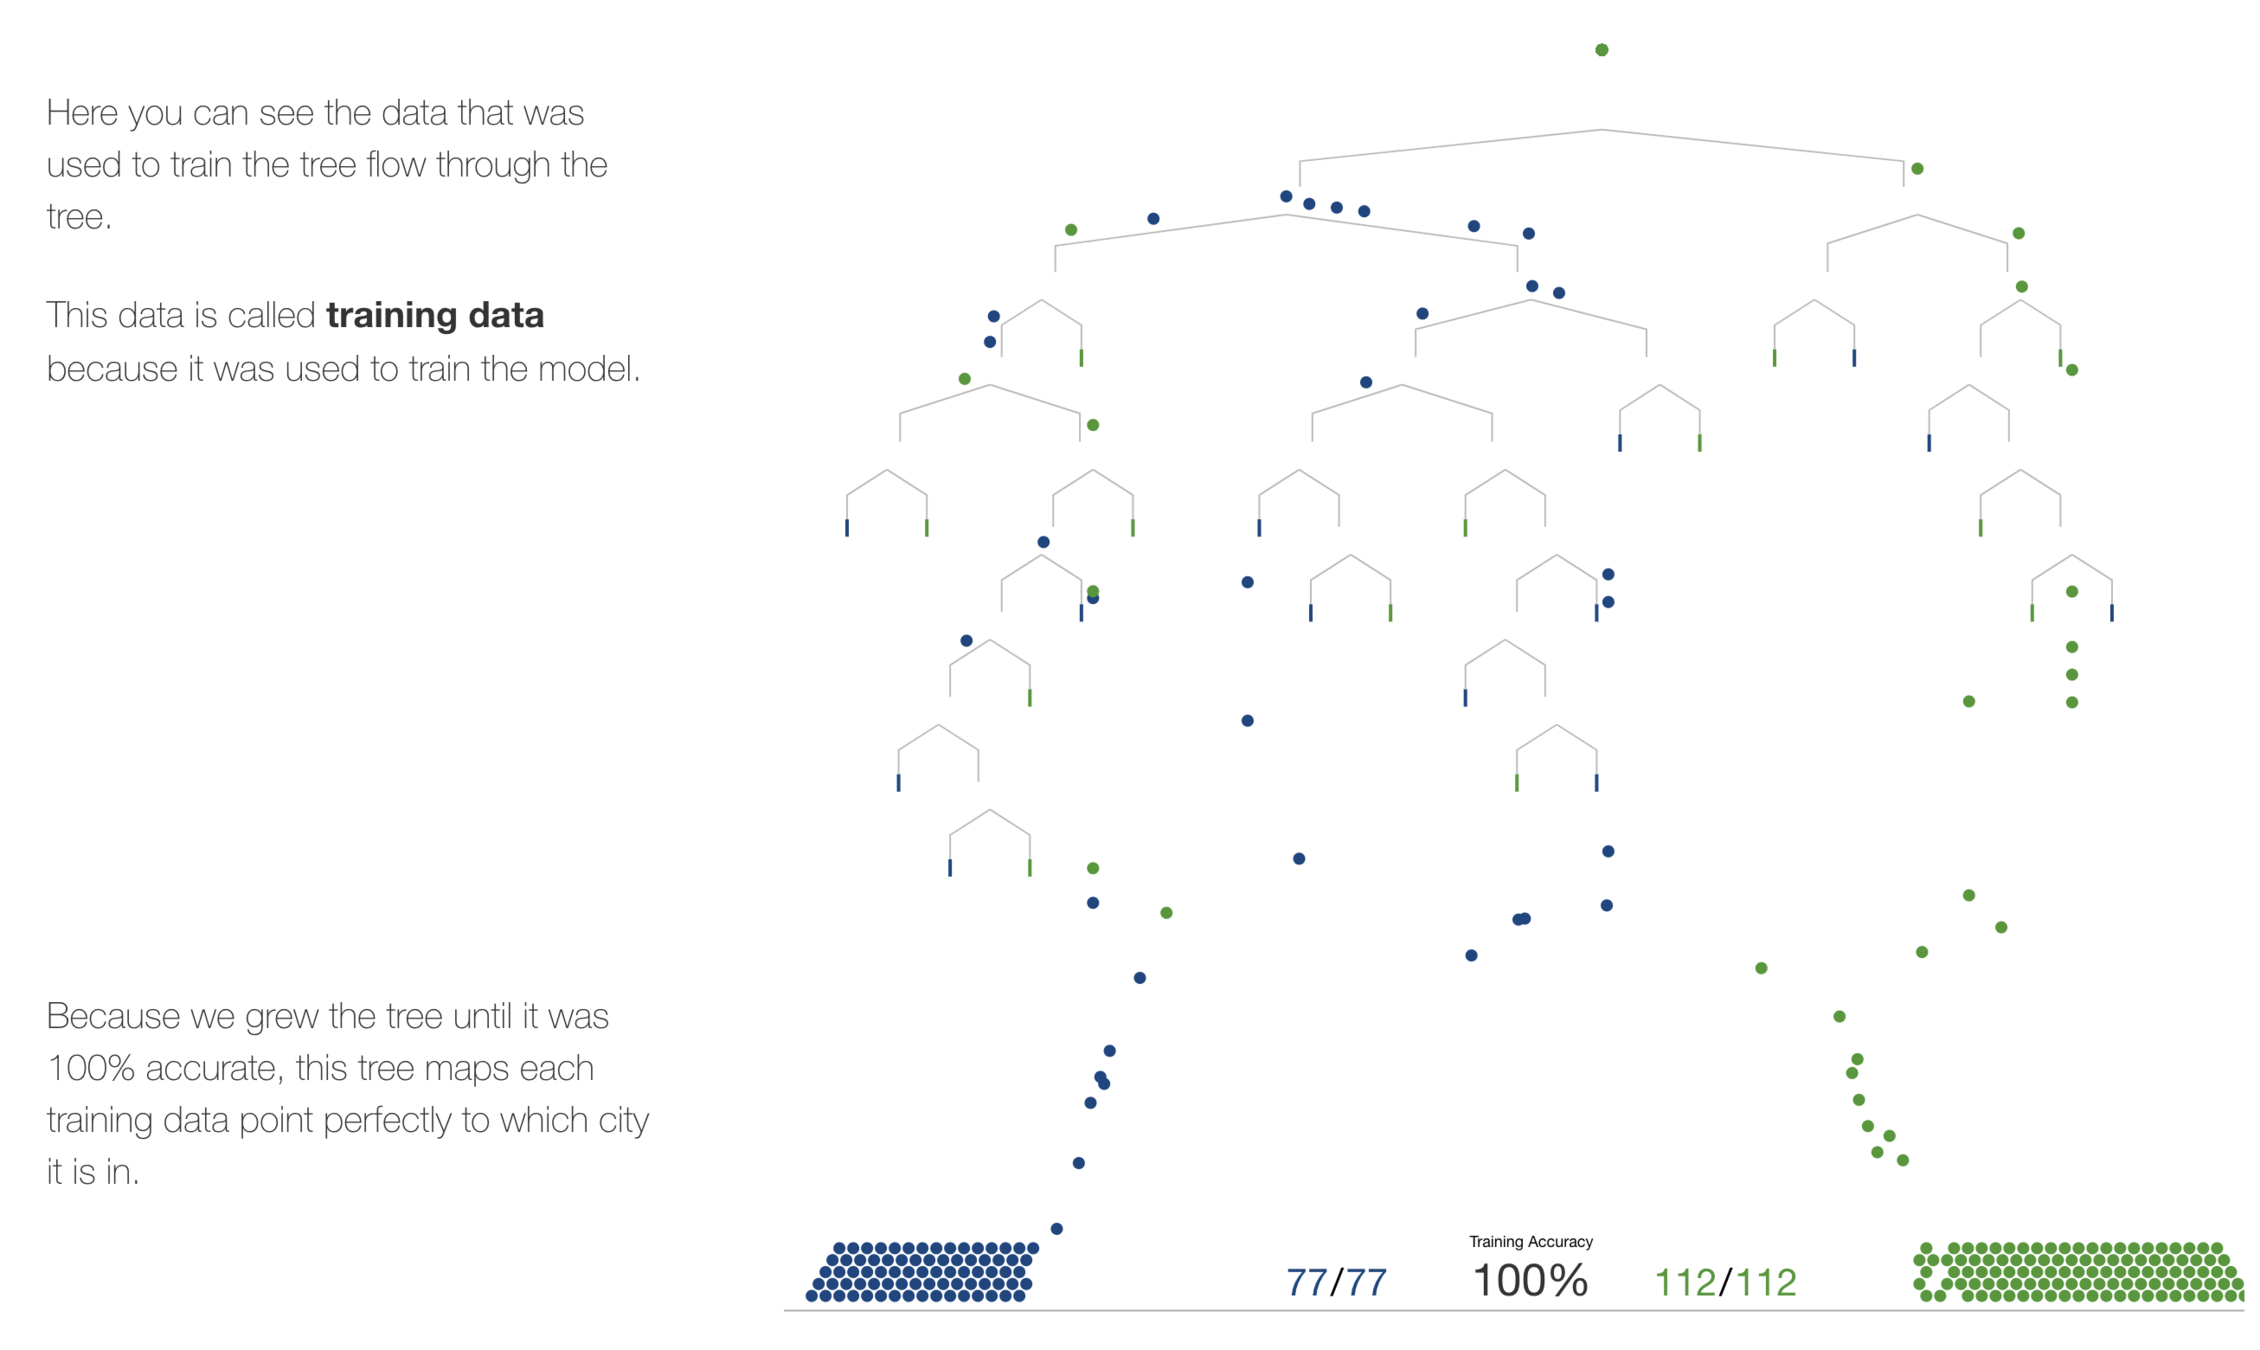
Code: bigger datasets
Code: same viz, different data (now)
Code: same viz, different data (personal)
Code: same viz, different data (as a tool)

Code: animations

Code: to reveal & use time
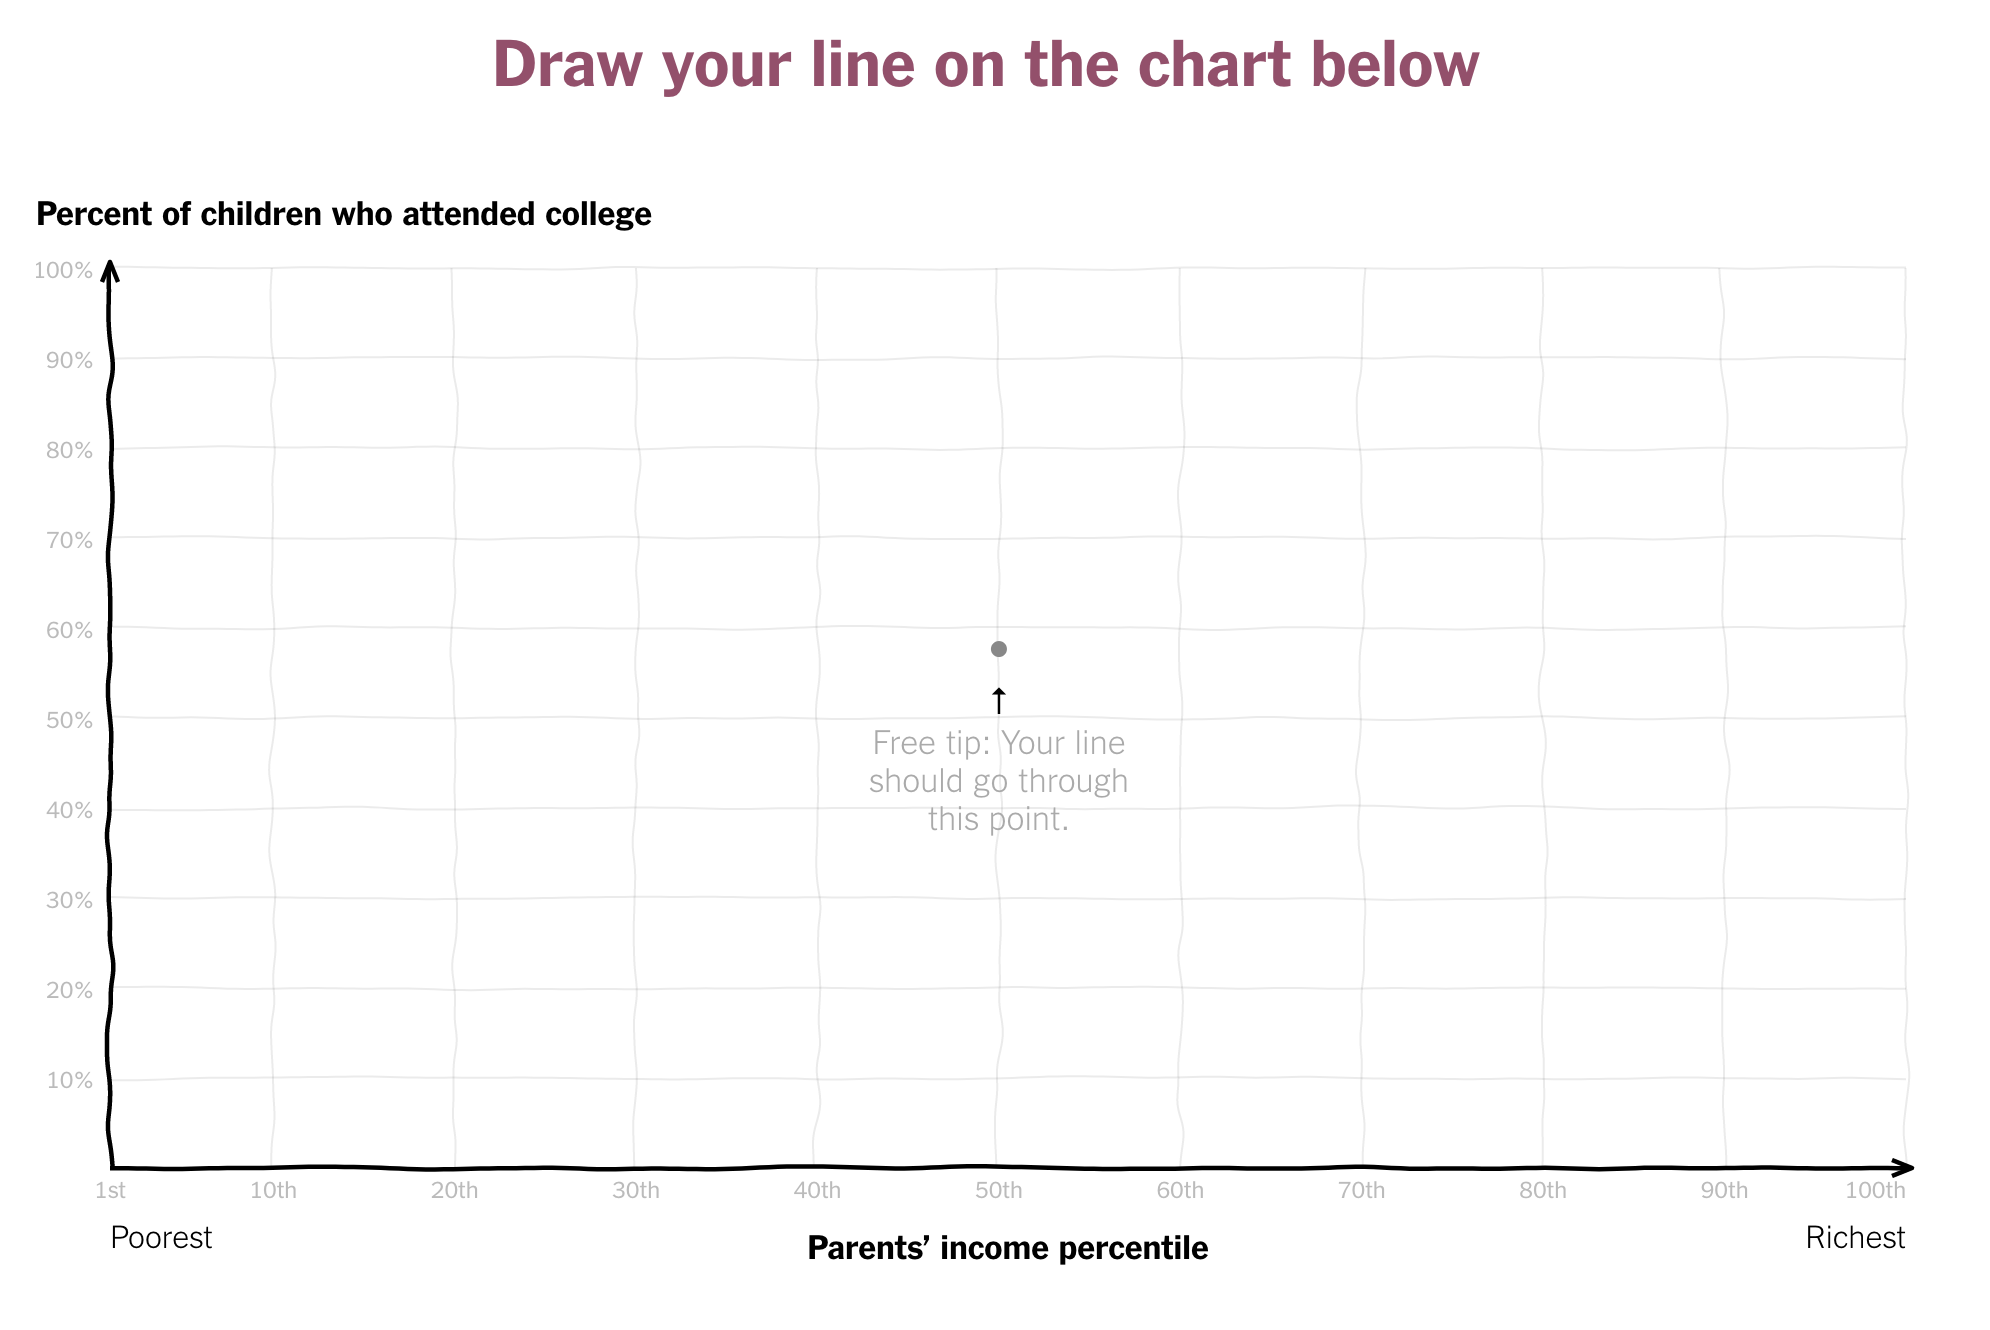
Code: interactive

Code: interactive
You Draw It - New York Times
Code: can draw with math; make anything you imagine


Write down, then talk with your neighbors...
what does data visualization mean to you Now?
How has your answer changed?
Color
&
human perception

Notice anything interesting about this group of numbers?
Easier question: how many 7's are there?
It's common to add color to show categories. Maybe this helps? How many 7's do you see?

Because it's ordered, we might use a color spectrum like this. How many 7's do you see?

But, maybe this is easier... how many 7's are there?

What about 3's?

What about 1's?

What about all the numbers?

But did you notice that the lower left corner is all 3/4/5?

Pre-attentive Attributes
Visual analysis appears to be functionally divided between an early preattentive level of processing at which simple features are coded spatially in parallel and a later stage at which focused attention is required to conjoin the separate features into coherent objects.
Pre-attentive Attributes

Not just in data viz...

Business Data Viz example (anonymized)


Before: color shows categories of things that might influence job satistifaction
After: color used to emphasize the core story -- what aspects of job satisfaction are most influenced by managers
Using a highlight color: gene lookup tool

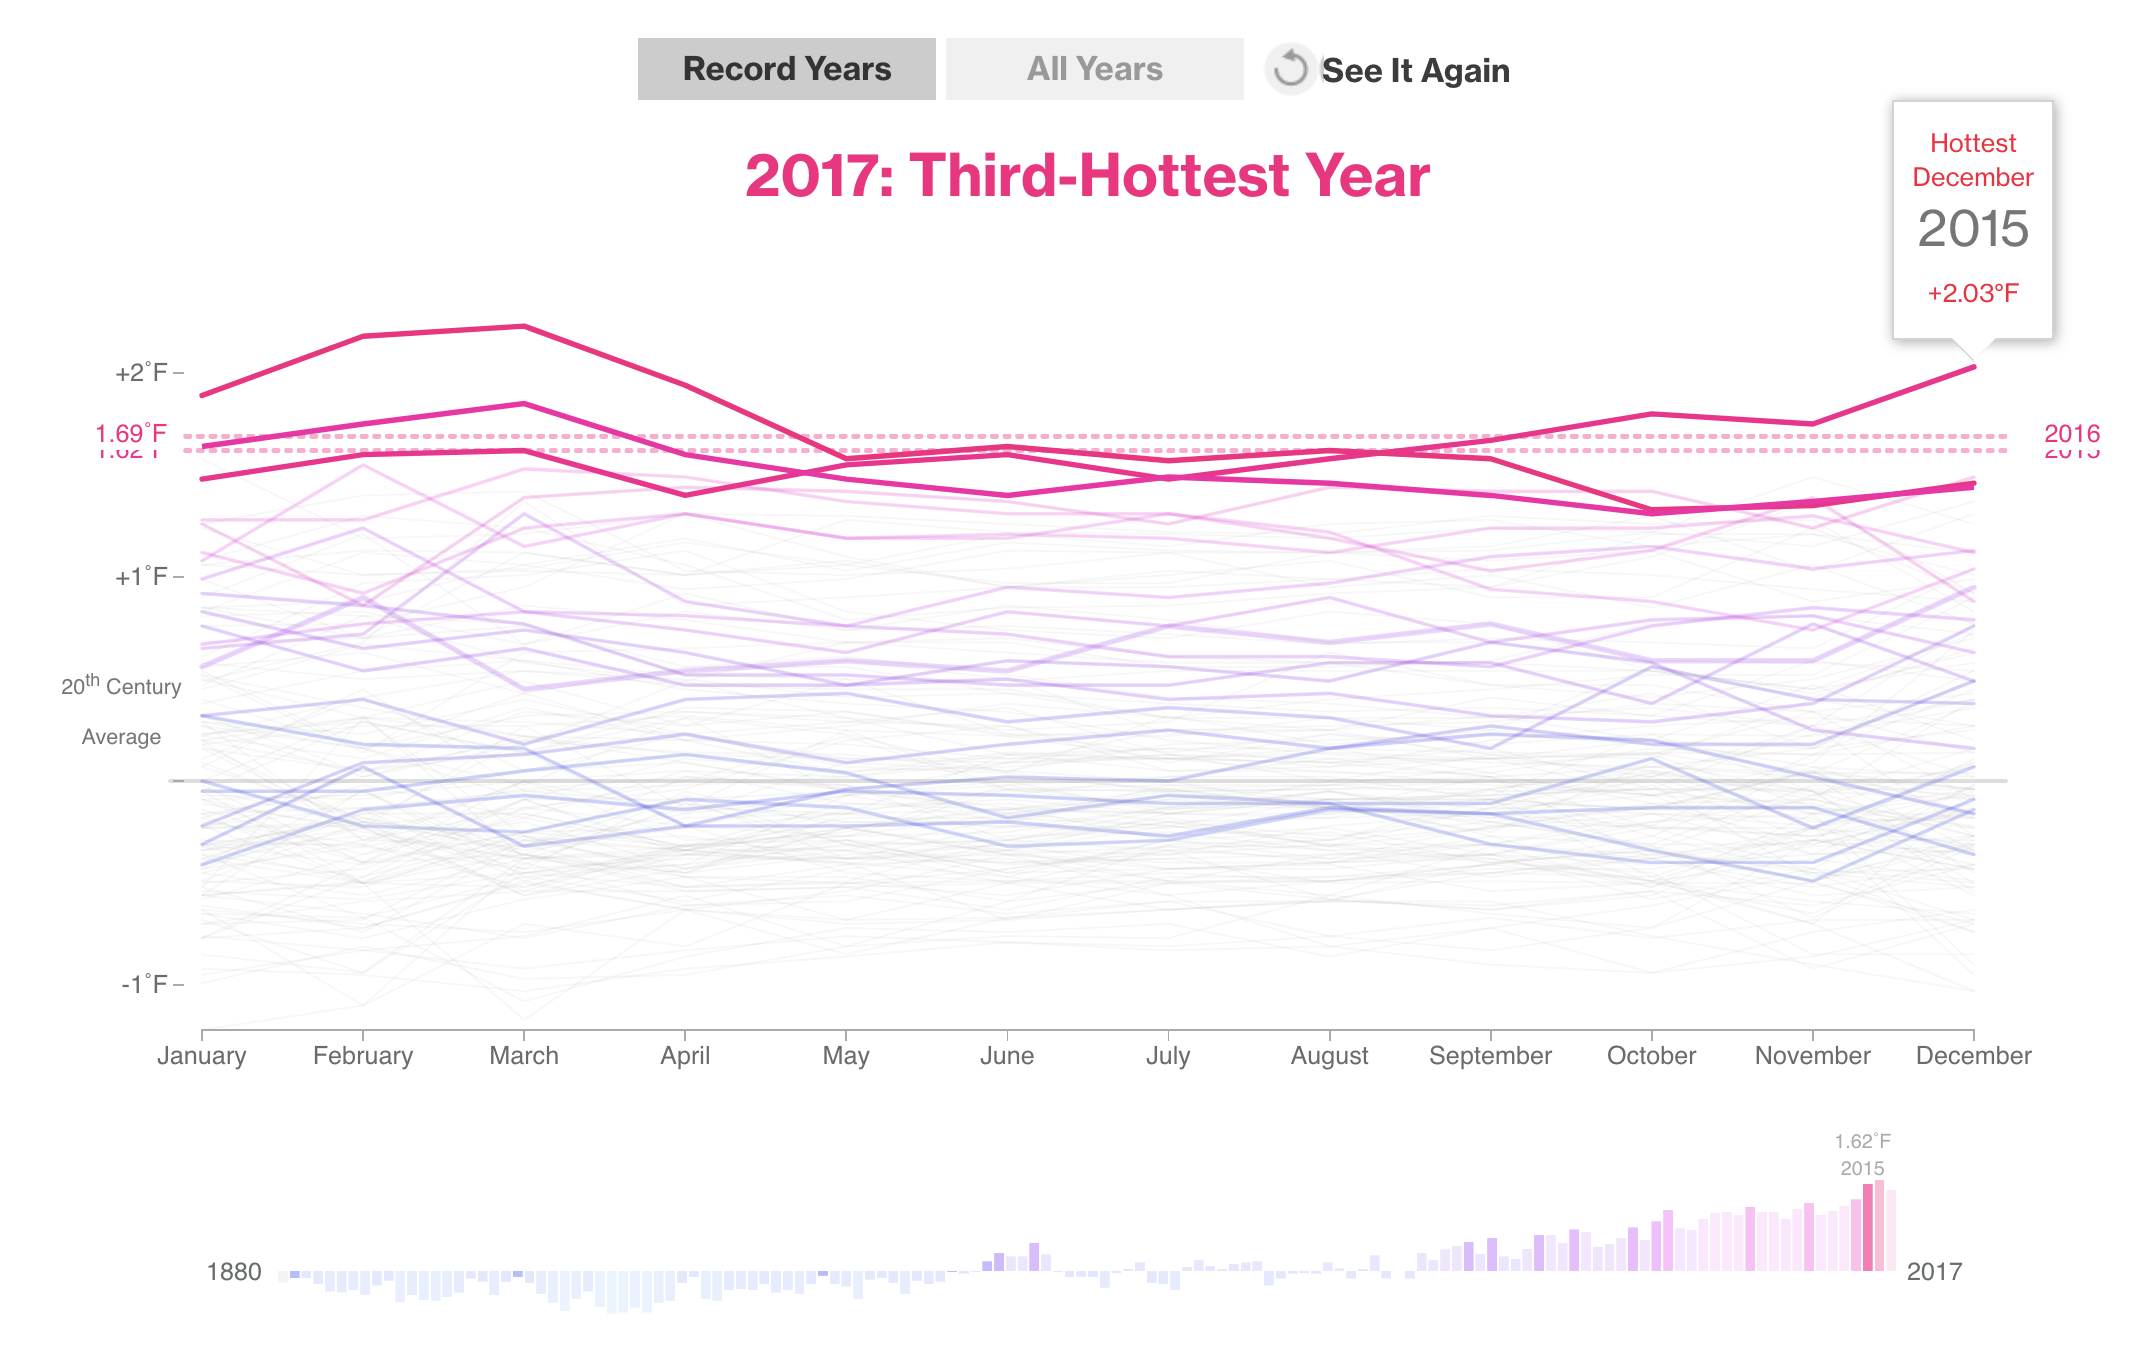
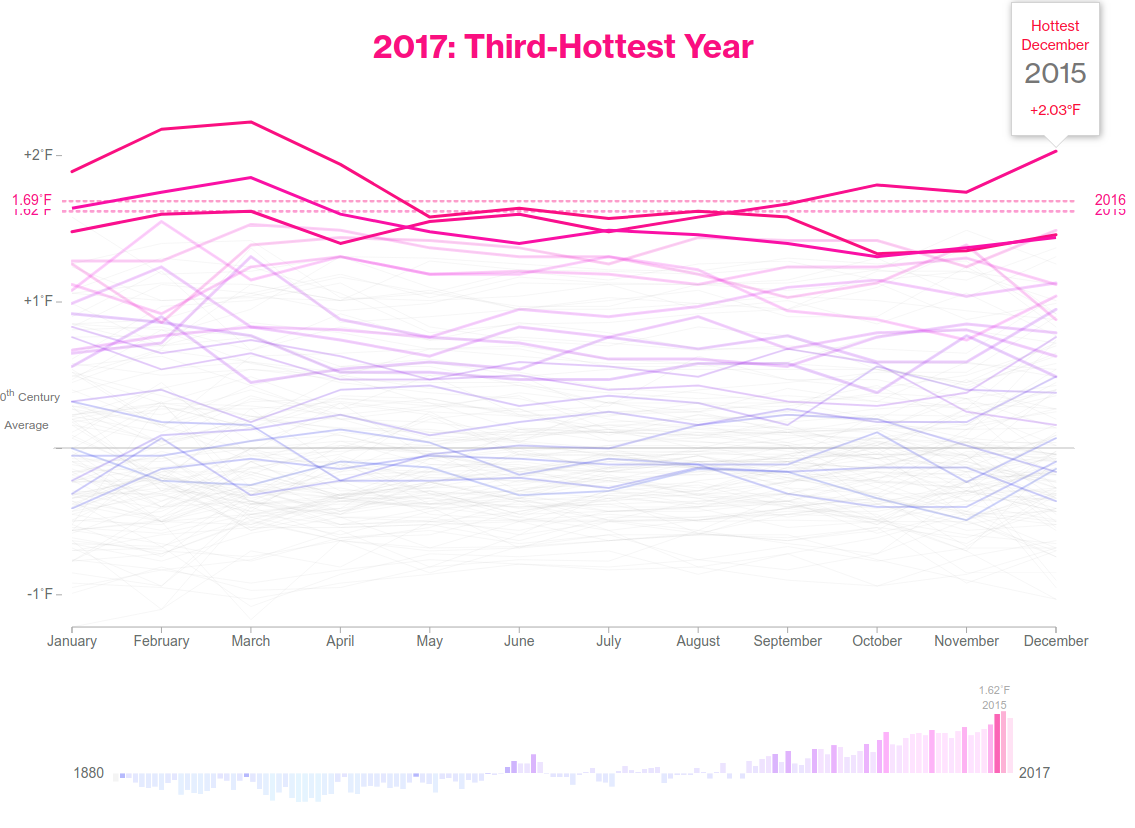
Different Color; Different insights

Unemployment Rate - Aug 2016
Different Color; Different insights

Unemployment Rate - Aug 2016
D3 - Bostock; Adapted by Zan
Being intentional with color: meta genomics project
Being intentional with color: meta genomics project

Critique A visualization
Visual form
What visual attributes encode the data?
What does this form help us notice?
FoCus attention
How can we use color, annotations, text, and other elements to help focus the user's attention on what we think is most important?
what's the visual form?
what focuses your attention?
SF Population 2010
|
age |
male |
female |
|
Under 5 |
17,963 |
17,240 |
|
5 to 9 |
14,466 |
13,996 |
|
10 to 14 |
13,467 |
12,832 |
|
15 to 19 |
16,888 |
17,718 |
|
20 to 24 |
29,269 |
31,349 |
|
25 to 29 |
44,178 |
43,978 |
|
30 to 34 |
41,351 |
38,613 |
|
35 to 39 |
38,264 |
32,549 |
|
40 to 44 |
34,906 |
27,963 |
|
45 to 49 |
31,783 |
25,794 |
|
|
|
|
|
50 to 54 |
28,957 |
25,273 |
|
55 to 59 |
26,777 |
24,931 |
|
60 to 64 |
22,455 |
22,433 |
|
65 to 69 |
14,318 |
15,462 |
|
70 to 74 |
11,274 |
13,268 |
|
75 to 79 |
9,294 |
11,545 |
|
80 to 84 |
6,878 |
10,312 |
|
85 and over |
5,974 |
11,517 |


Go to worksheet
Part 1: Critique each visual form
Part 2:
a. Choose one chart.
b. Decide what about the data you want to communicate.
c. Add a title, color, and annotations to the chart that help communicate that aspect of the data.
data viz for Lowell HS
By Zan Armstrong


