Analyzing the Energy-Time Trade-OFF in high performance computing applications
Presentation done by Kevin Gee
based on Freeh, Lowenthal, Pan, Kappiah, Springer paper
published in IEEE Transactions on parallel and distributed systems,
Vol. 18, No. 6, June 2007
Purpose
- Demonstrate results of energy-time trade-off of a wide range of applications - serial and parallel - on a power scalable cluster
- Introduce metrics to predict memory and communication bottlenecks
2
Content
- Introduction
- Experimental methodology
- Single node results
- Multi node results
- Metrics
- Conclusion
3
Introduction: facts
- HPC (High Performance Computing) tends to push performance at all cost
- Last 10% increase in performance requires disproportionally large amounts of resources
- The Earth Simulator consumes 7 MW of power
4
INTRODUCTION: Solution
-
Low-power high-performance clusters to save energy
- Green Destiny consumes about 3 times less energy than Accelerated Strategic Computing Initiative (ASCI) Q machine
- ASCI_Q machine is about 15 times faster per node
5
INTRODUCTION: SOLUTION
- Using high-performance commodity microprocessor with frequency and voltage scaling
- Increase in frequency results in:
- a smaller increase in application performance
- increase in CPU stalls
6
Introduction: prediction
It is possible to reduce power consumption without a significant increase in execution time
7
Methodology: Programs
- Single node benchmark sets
- Nasa Advanced Supercomputing (NAS)
- System Performance Evaluation Cooperative (SPEC) integer
- SPEC float
- Multiple node benchmark sets
- NAS MPI
- ASCI
8
METHODOLOGY: Cluster
10 nodes, connected by 100 Mbps network,
each has:
- AMD Athlon 64 CPU
- 1 Gb main memory
- 128 Kb L1 cache
- 512 Kb L2 cache
9
METHODOLOGY: Gears
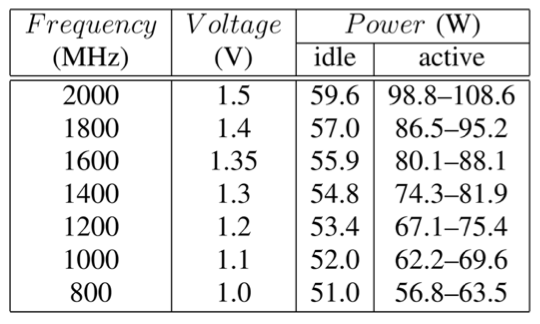
Idle and active power for each AMD-64 node
10
Single node results
Overall results
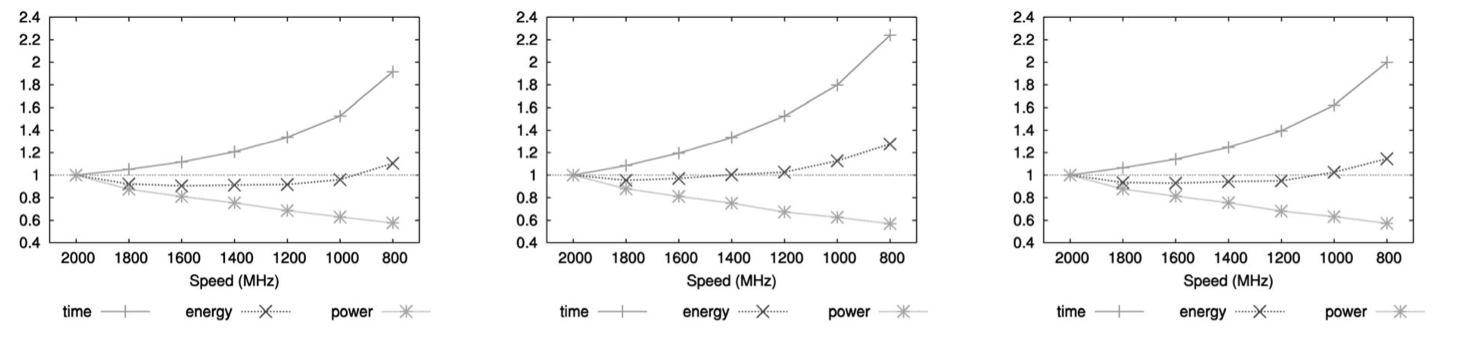
NAS SPEC INT SPEC FP
11
SINGLE NODE RESULTS
Best energy-time trade-off in each set with different programs
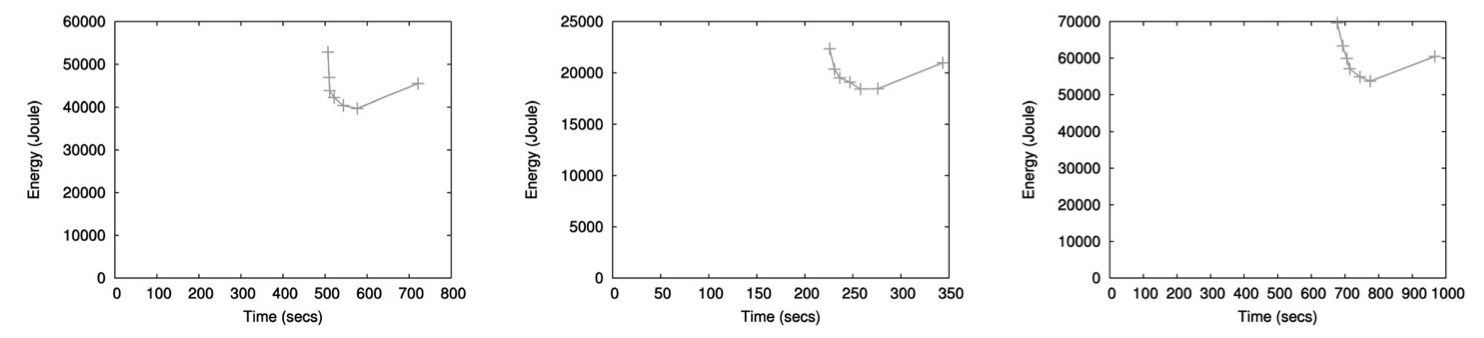
12
SINGLE NODE RESULTS
Worst energy-time trade-off using different programs
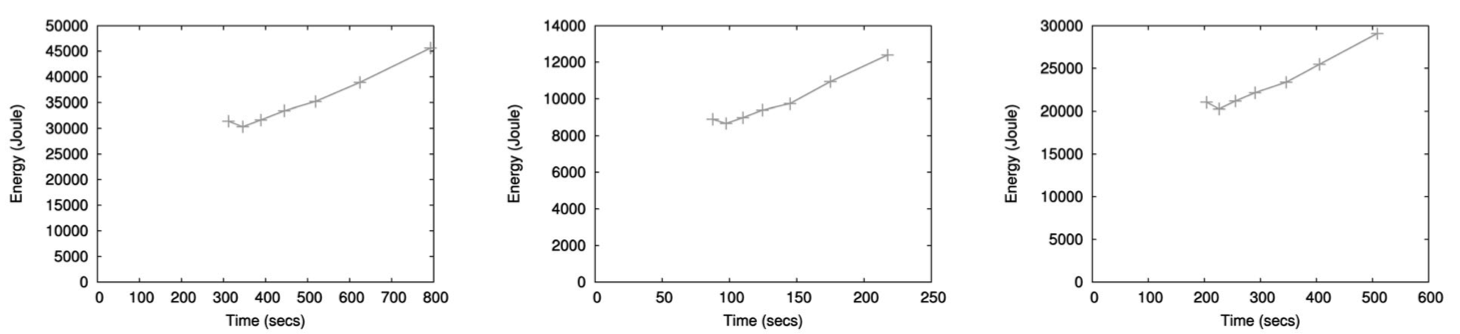
13
Multiple node results
Bottlenecks:
- Memory
- Communication
14
Multiple node results
Possible layouts of the graph :
- Poor speedup - more energy, less time
- Perfect or superlinear speedup
- Speedup is good and there are significant memory operations
15
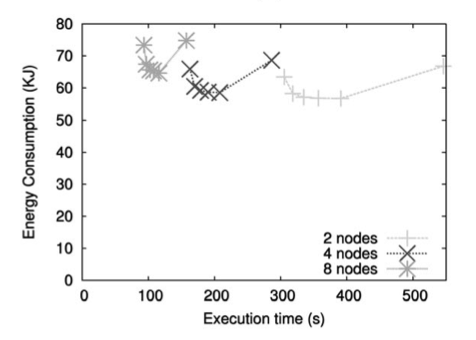
MULTIPLE NODE RESULTS
Poor speedup (more energy, less time):
16
MULTIPLE NODE RESULTS
Perfect speedup (no energy-time trade-off):
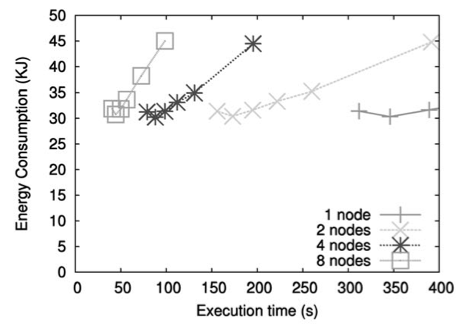
17
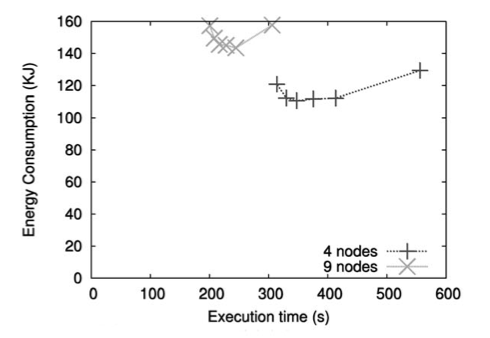
MULTIPLE NODE RESULTS
Good speedup:
18
Metrics: CPU criticality
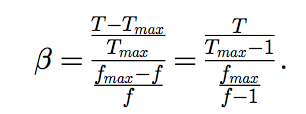
Tmax - execution time in maximum frequency
T - execution time in current frequency
fmax - maximum frequency
f - current frequency
if (beta == 0) => application is independent from CPU
(T == Tmax)
19
METrics: MPO
-
MPO - Misses Per Operation
- Measures memory pressure
- MPO = The number of operations retired and the L2 cache misses( which are memory accesses)
- Constant while changing frequency
- If MPO decreases - application becomes more CPU bound
20
Metrics: slack
- Predicts communication bottleneck
- Slack - ratio of the total time a node is blocked in MPI calls to the total execution time
- Greater slack suggests reducing gear
- Collected on the fly
21
Conclusion
-
In the best case on one node, reducing the CPU speed makes it possible to use 20 percent less energy while increasing time by only 3 percent.
- On the other hand, a program that is largely CPU bound should be run at the fastest gear possible.
- MPO and slack can be used to to choose appropriate gear.
22
Your Questions
23
Energy-Time Trade-OFF in high performance computing applications
By Žilvinas Kučinskas


