The Value of a Millisecond:

Harnessing Information in Fast, Fragmented Markets

paper by Chen, Foley, Goldstein, and Ruf

discussion by Andreas Park

Research Question

Who benefits from a speed bump on marketable orders that provides a speed advantage to some limit orders?

Answers

  1. HFTs liquidity providers: larger profits on the speed-bump venue.
  2. Aggregate liquidity worsens.
  3. Liquidity providers: lower profits on remaining venues.

Speed Bumps

The famous case: IEX's Speed Bump

  • main idea: orders into IEX are slowed down by 350 milliseconds but updates SIP data (=NBBO) faster.
  • => NBBO pegged orders trade at "fresh" prices
  • Chicago Exchange proposes “Liquidity Taking Access Delay"
  • Incoming marketable orders get delayed by 350 microseconds, limit order cancellations do not

Speed Bumps

  • all orders send to TSX Alpha Exchange are randomly delayed, between 1-3 milliseconds
  • the exception are "post-only" orders which are not subject to the delay

Here: TSX Alpha Exchange

  1. higher maker fee:
    • 16 cents per 100 shares vs
    • 14 cents per 100 shares
  2. minimum posting size

Cost of using post-only?

How do you benefit from post-only?

market event

expect market orders

200 shares

100 shares

500 shares

before

at the ask

How do you benefit from post-only?

market event

expect market orders

200 shares

100 shares

500 shares

after

cancels

Comment 1:

Many things happened at the same time

  1. TMX Select was closed
  2. Alpha fees became inverted
  3. Alpha introduced a speed bump
  4. Alpha became "unprotected"
    • Brokers/marketplaces could "trade-through" Alpha's prices

1 event    =     4 changes

Comment 2: Endogeneity of Adverse Selection measures in the paper

General Idea:

  • the speed bump protects liquidity provider against adverse selection
  • => avoid posted orders to become stale and can cancel ahead of market orders

Defining an informed order

  • Step 1: Collect strings of trades
    • = trades within 50 milliseconds
  • Step 2: Informed = displaced/absorbs entire NBBO (i.e. across multiple markets)
    • accounts for
      • the trade itself
      • plus trades by others
      • plus cancellations!
    • What if the NBBO is only 100 shares?
    • Creates an endogeneity when speed bumps are introduced!

Comment 3: Did spreads change?

Comment 4: Beware of retail orders
Retail Myth 1:

(not this paper, but generally)

"retail trades are small"

Price level retail non-retail
$1-$5 1,486 697
$5-$10 791 413
$10-$25 422 266
>$25 275 203

average volume for single-market marketable orders


Retail Myth 2:

"retail trades are single-market and small"

Price level retail non-retail %retail minimum size Alpha
$1-$5 5,100 5,797 26% 5,000
$5-$10 2,134 2,378 17% 3,500
$10-$25 1,032 1,128 27% 1,000
>$25 664 719 17% 500

average volume for multi-market marketable orders

=> retail trades are neither small nor trade on only one market

HANDLE WITH CARE: "retail orders, on average, are unlikely to need to execute quantities larger than the 5 board lot minimum Alpha enforces"

Smaller Comments on Results and Interpretation

  1. "[The change] increase[s] profits for liquidity providers on [...] Alpha but [...] liquidity suppliers’ profits [are] reduced across remaining venues."
    • Often these will be the same entities: do they just cross-subsidize and costs/benefits net to zero?
  2. NBBO Computation for Alpha trades - does it include Alpha?
  • would explain quote-fade/fill rate result

overall I like many of the results, and I believe that they make intuitive sense, but I think the construction of measures requires work

Results and Interpretation

  1. informed=consume all liquidity
    Tight spreads: 50-80% of trade-strings consume all liquidity
    Wide spreads: significantly lower levels of informed. 
    • I am sympathetic to the measure 
    • BUT: Way too much informed trading! If depth is low, too much will be absorbed
  2. The fill-rate measure has to be explained more thoroughly, e.g., by using examples.

overall I like many of the results, and I believe that they make intuitive sense, but I think the construction of measures requires work

Broker Activities

Broker %Vol
Anonymous 24%
CIBC 13%
TD 11%
RBC 9%
BMO 5%
Scotia 5%
National Bank 4%
Merrill 4%
Instinet 2%
Morgan Stanley 2%
\sum\approx80\%
80%\sum\approx80\%
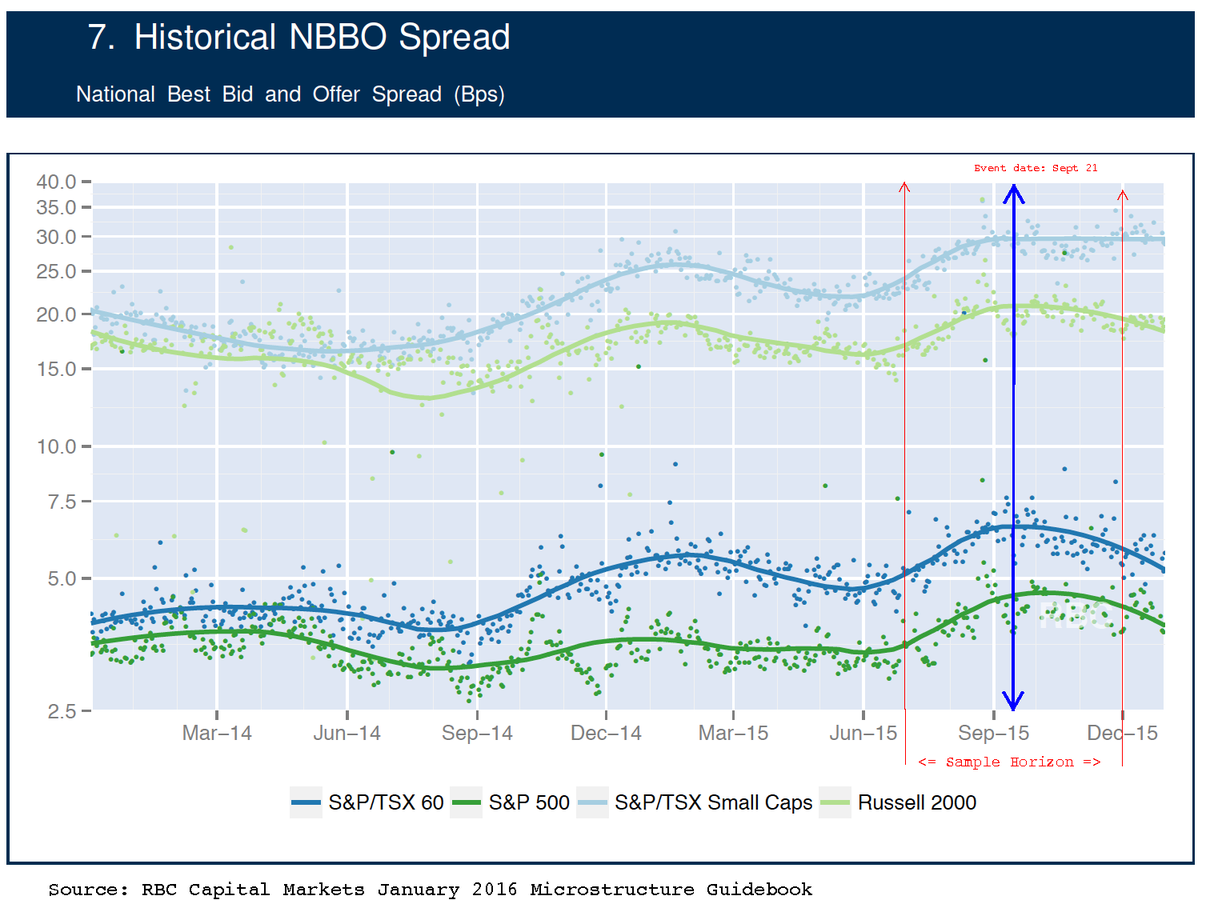
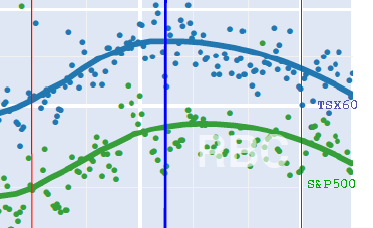
Source: RBC Marketstructure Guidebook Jan 2016

Who are the retail brokers? RBC & TD?

  • are the largest retail brokers
  • have many institutional clients

Comment on Results on Adverse Selection

  • Result: Adverse Selection on Alpha declines 
    • => makes perfect sense to me
    • hard to show in the data, but apparently one retail broker send all its flow there first.
  • lower realized spreads for non-HFT liquidity provision on Alpha also makes perfect sense 
    • => only get to trade once the HFTs stepped out of the way

Effects on other venues

  • "Section 4 establishes that Alpha’s systematic order processing delay against marketable orders enables the segmentation of uninformed order flow"
    • statement much too strong!
  • Question: with minimum post size, what is the ratio of depth Alpha/depth rest when Alpha at NBBO?
  • Feature of TSX Composite:
    • around 180 of 250 have 1-2 cent spreads
    • rest has very wide spreads
    • Suggestion: split sample!

my view: take with huge grain of salt due to the many simultaneous changes

Conclusion

  • Paper has a lot of good stuff/ideas
  • Interesting event
  • Need to tighten data collection:
    • What is a string? What is informed?
  • Good call to move away from retail segmentation (old version) as it's too speculative
  • Personal and subtle note: your results on retail flow segmentation contradict your findings in your recent JFE...

Presented Version of my NFA 2016 Discussion

By Andreas Park

Presented Version of my NFA 2016 Discussion

This is a discussion of Chen, Foley, Goldstein, Ruf's paper on "The Value of a Millisecond..."

  • 1,158