
On the shoulders of giants
Attila Bátorfy
ELTE University, Atlo
IDC26, Hilversum, 30th Otcober 2026

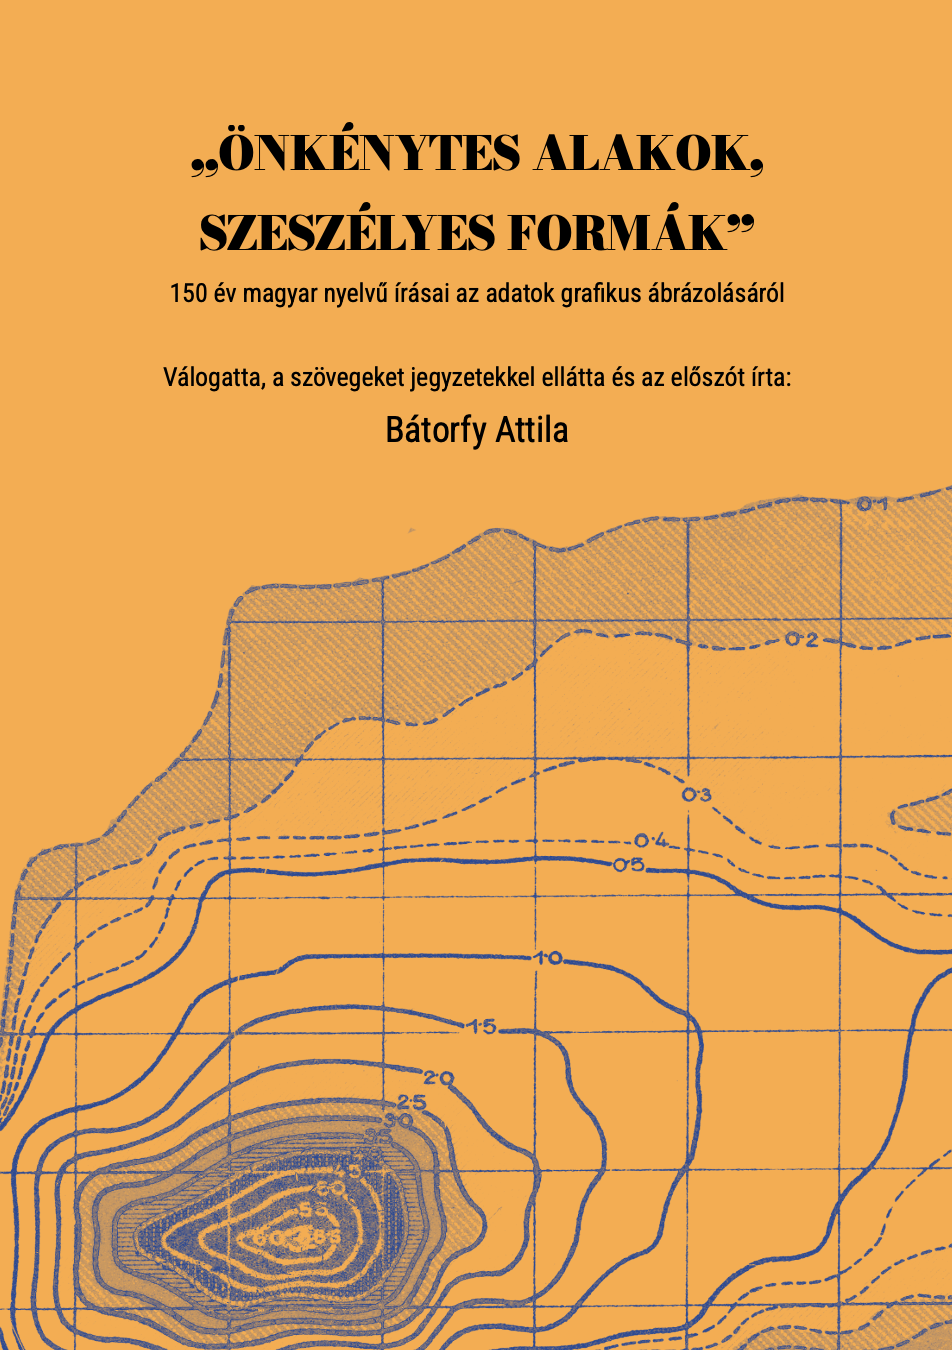
2024
2027

1. The background of Cabinet and our historical perspectives
2. The Cabinet of Infographic Curiosities
3. Remarks and lessons
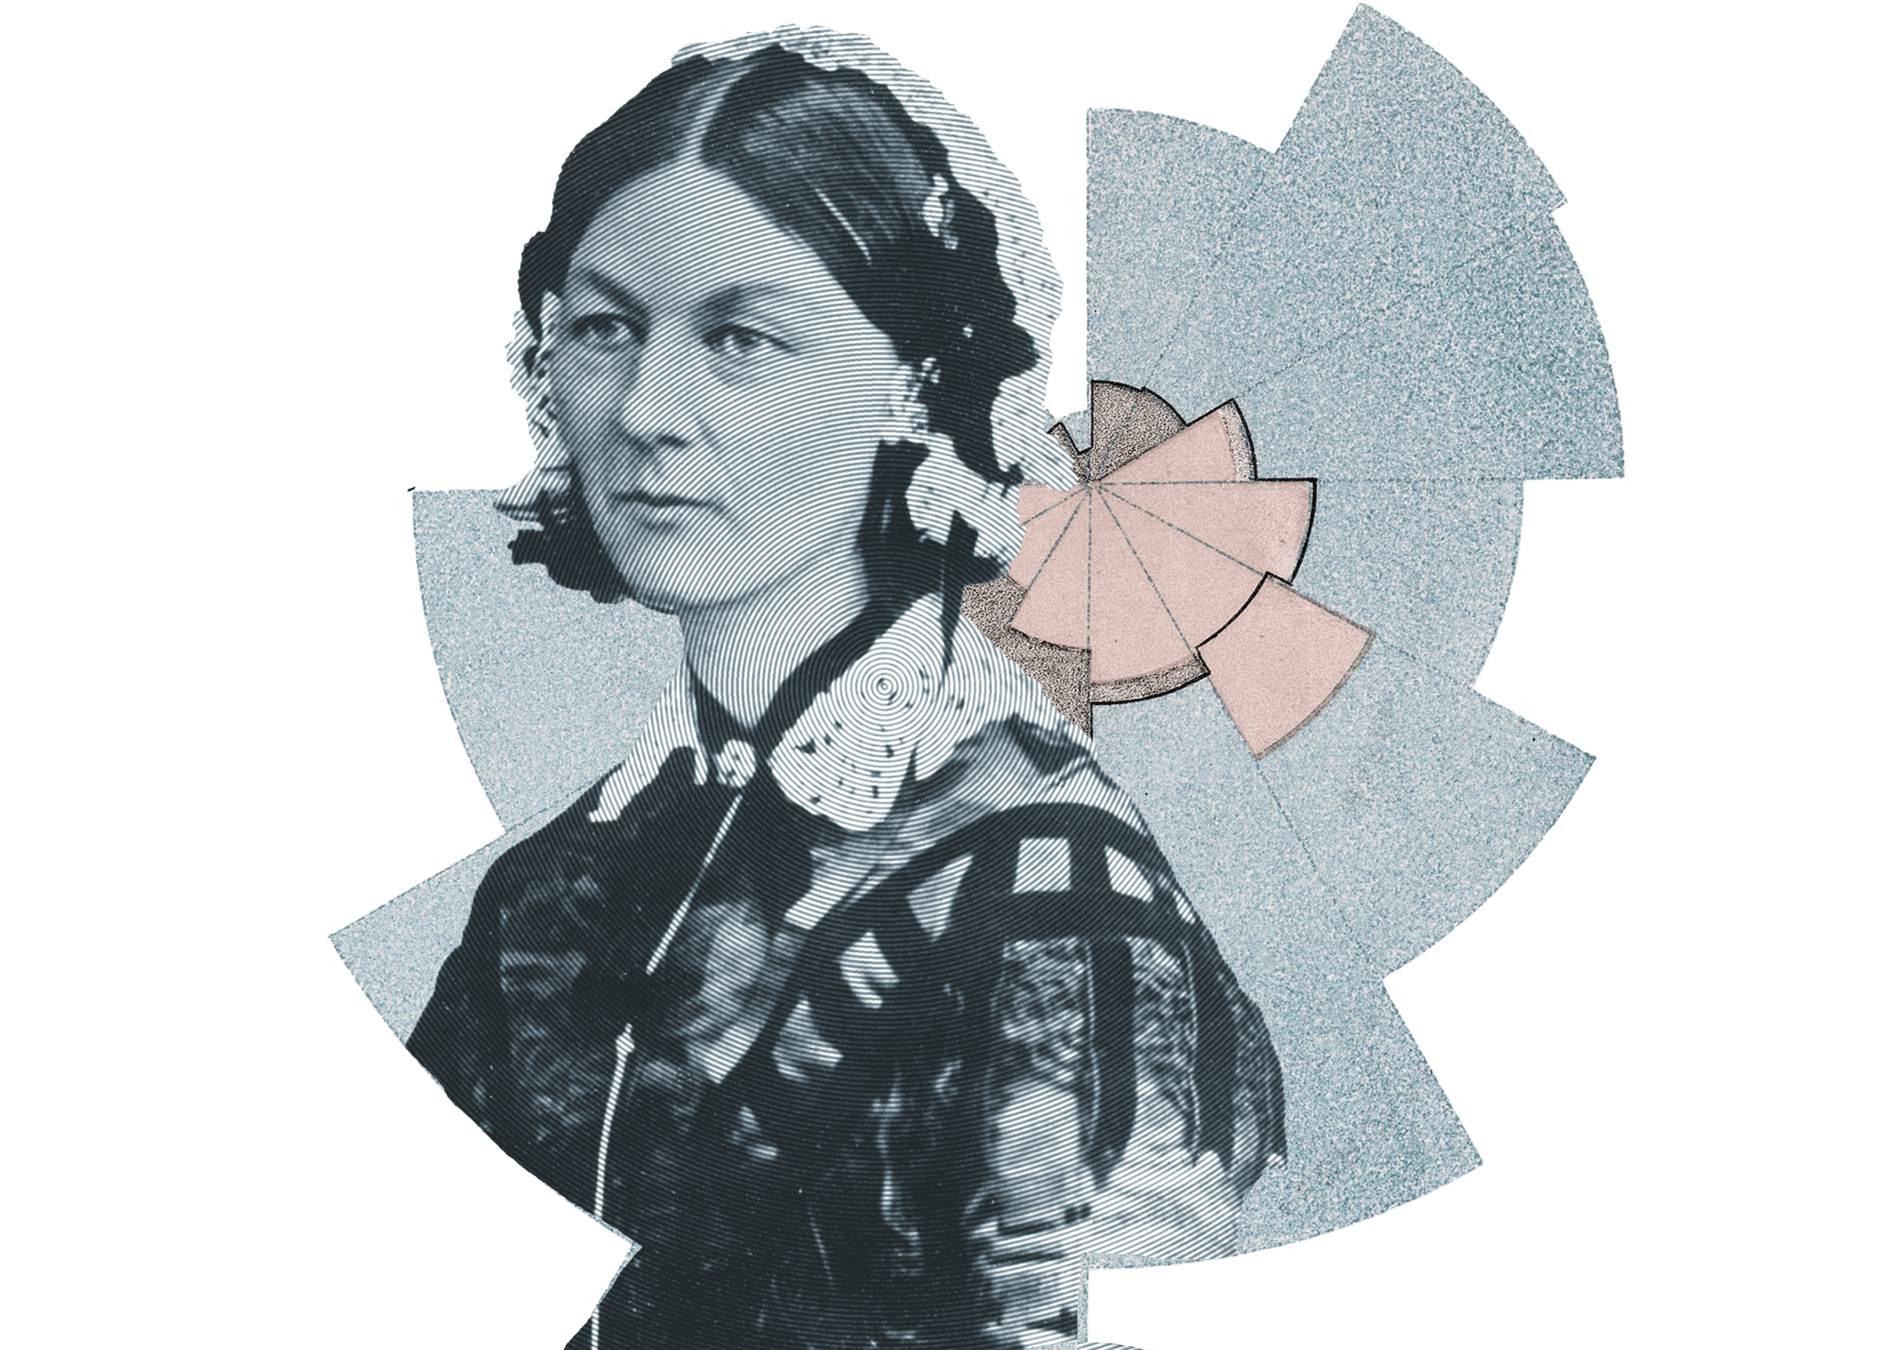
Florence
Nightingale
image: Wikimedia Commons
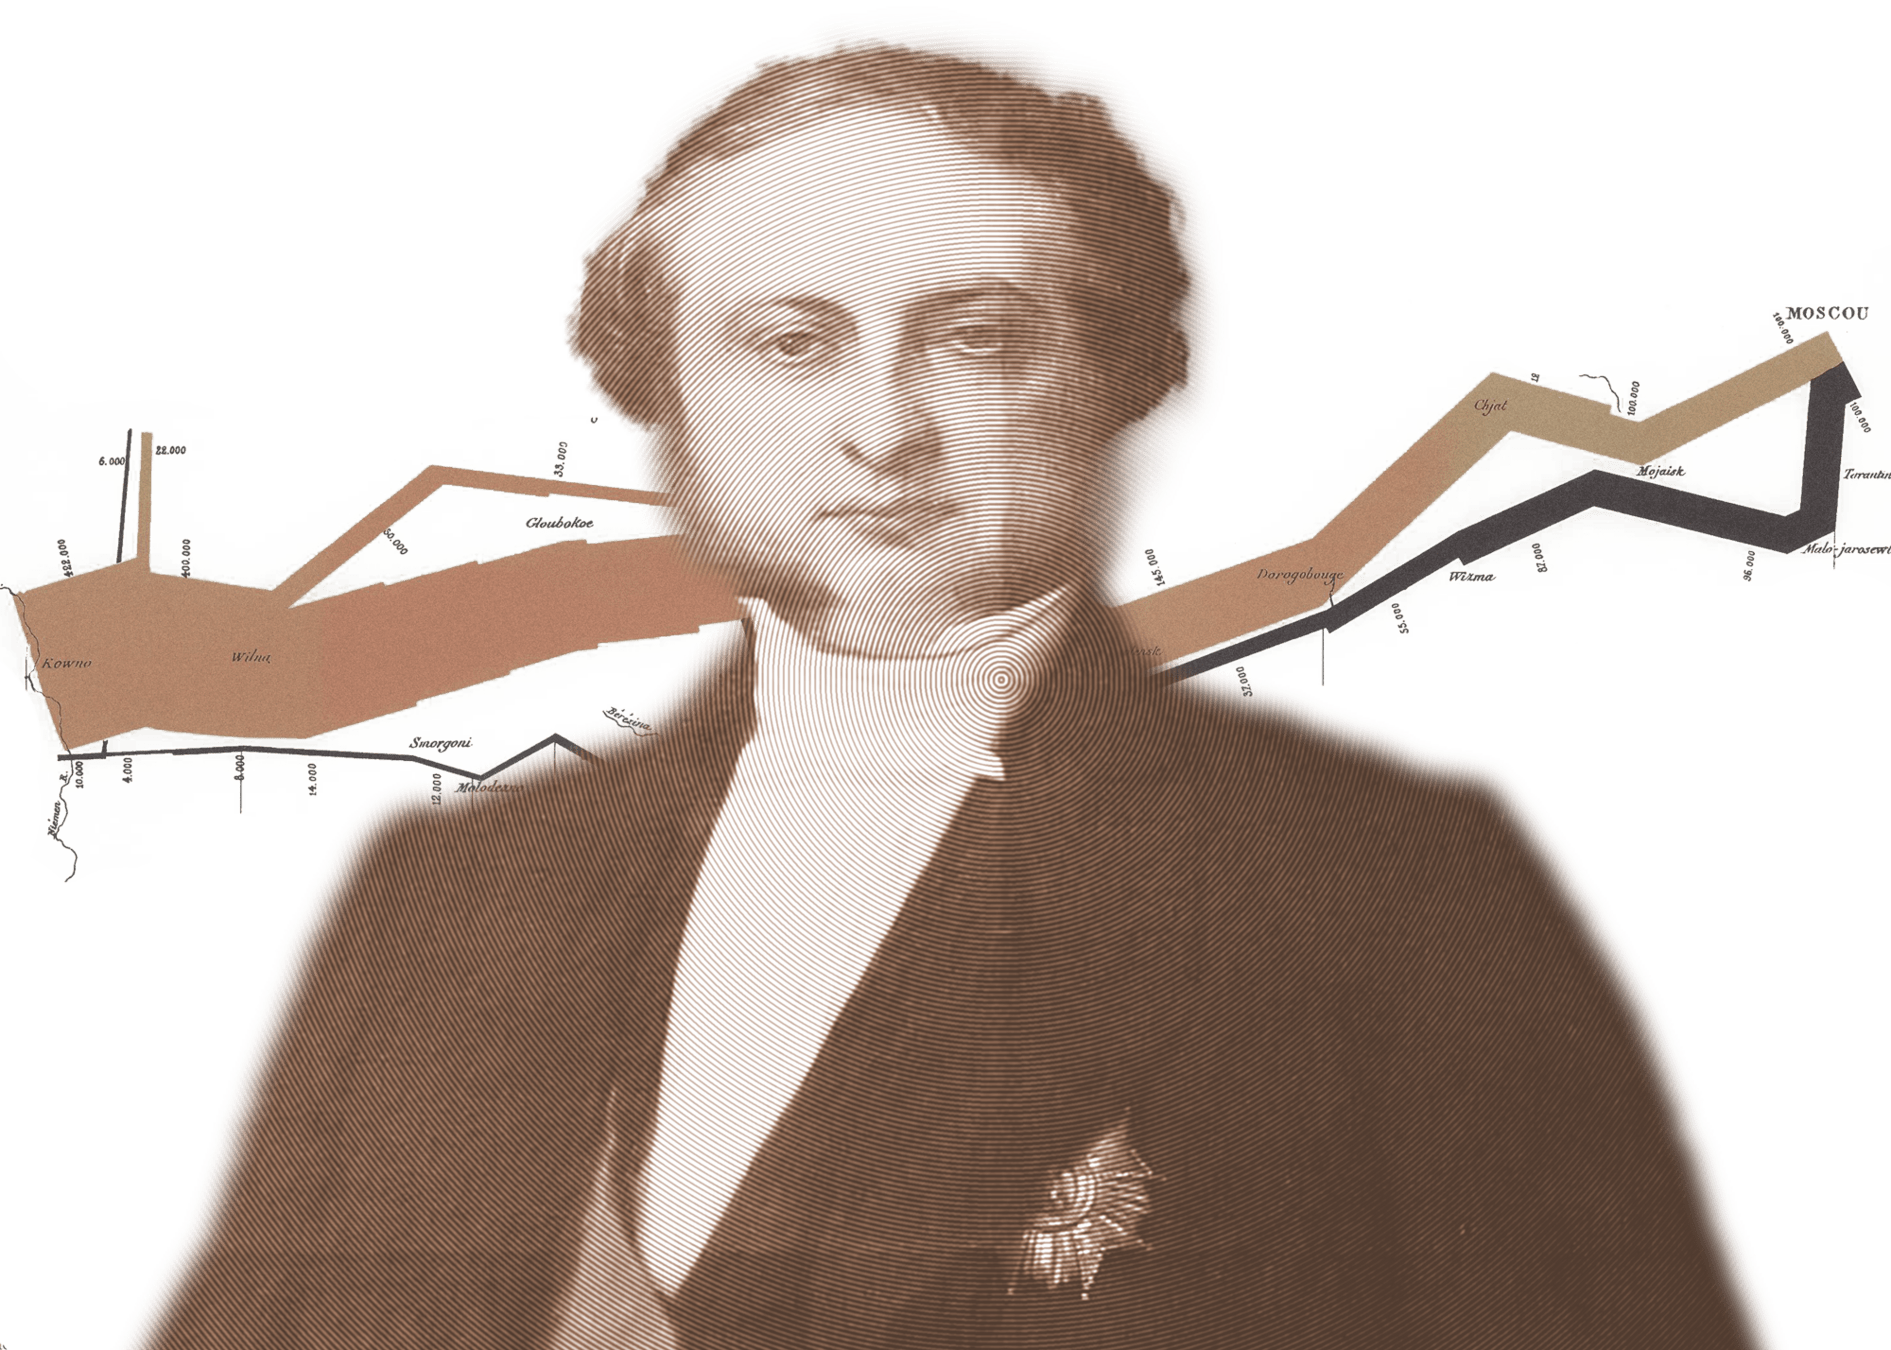
Charles-Joseph
Minard
image: Musée Mandet, RJ Andrews
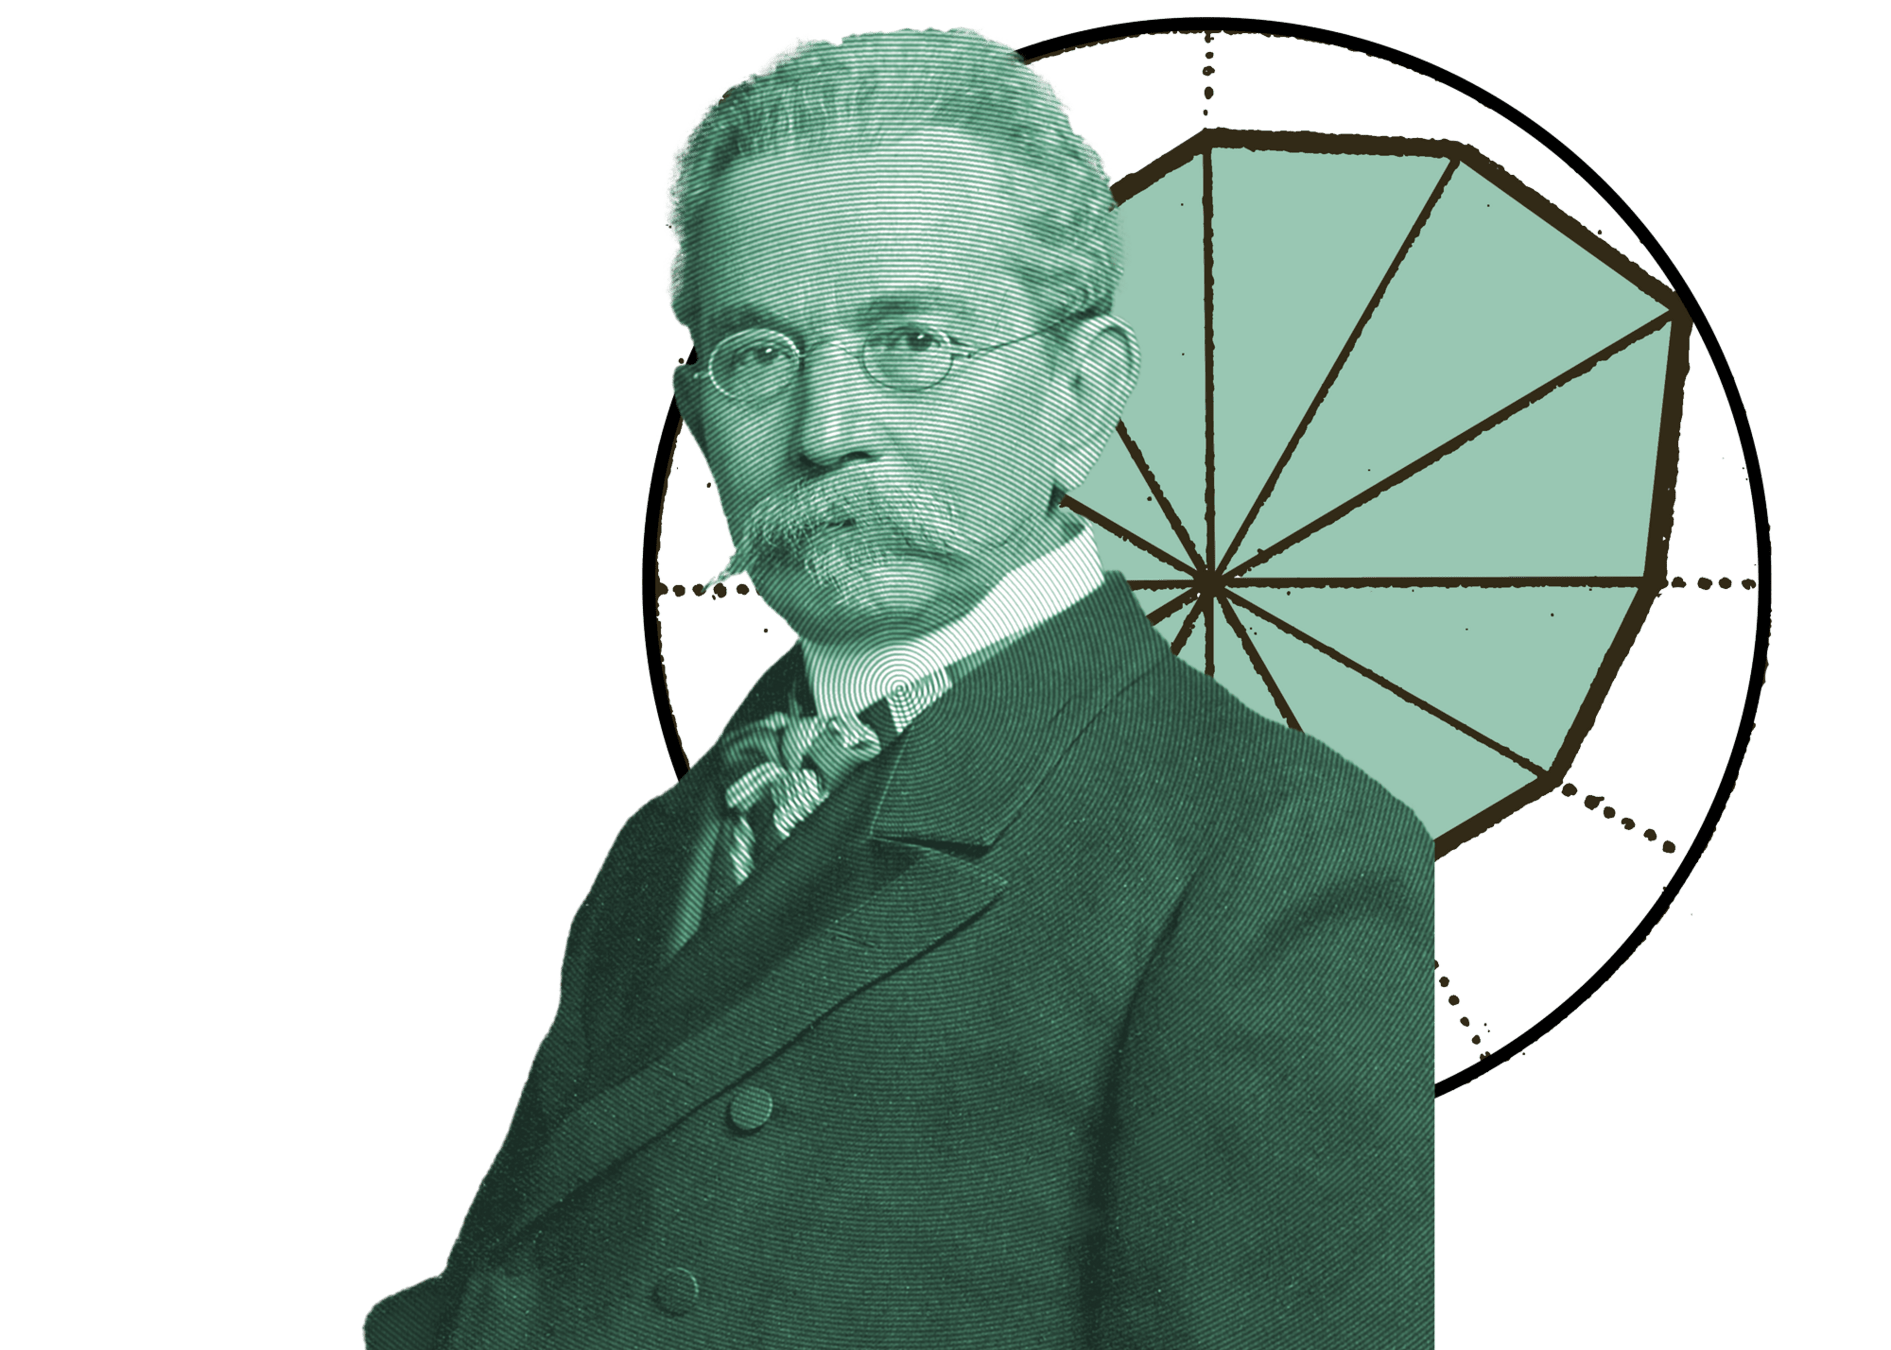
Georg
von Mayr
image: Wikimedia Commons
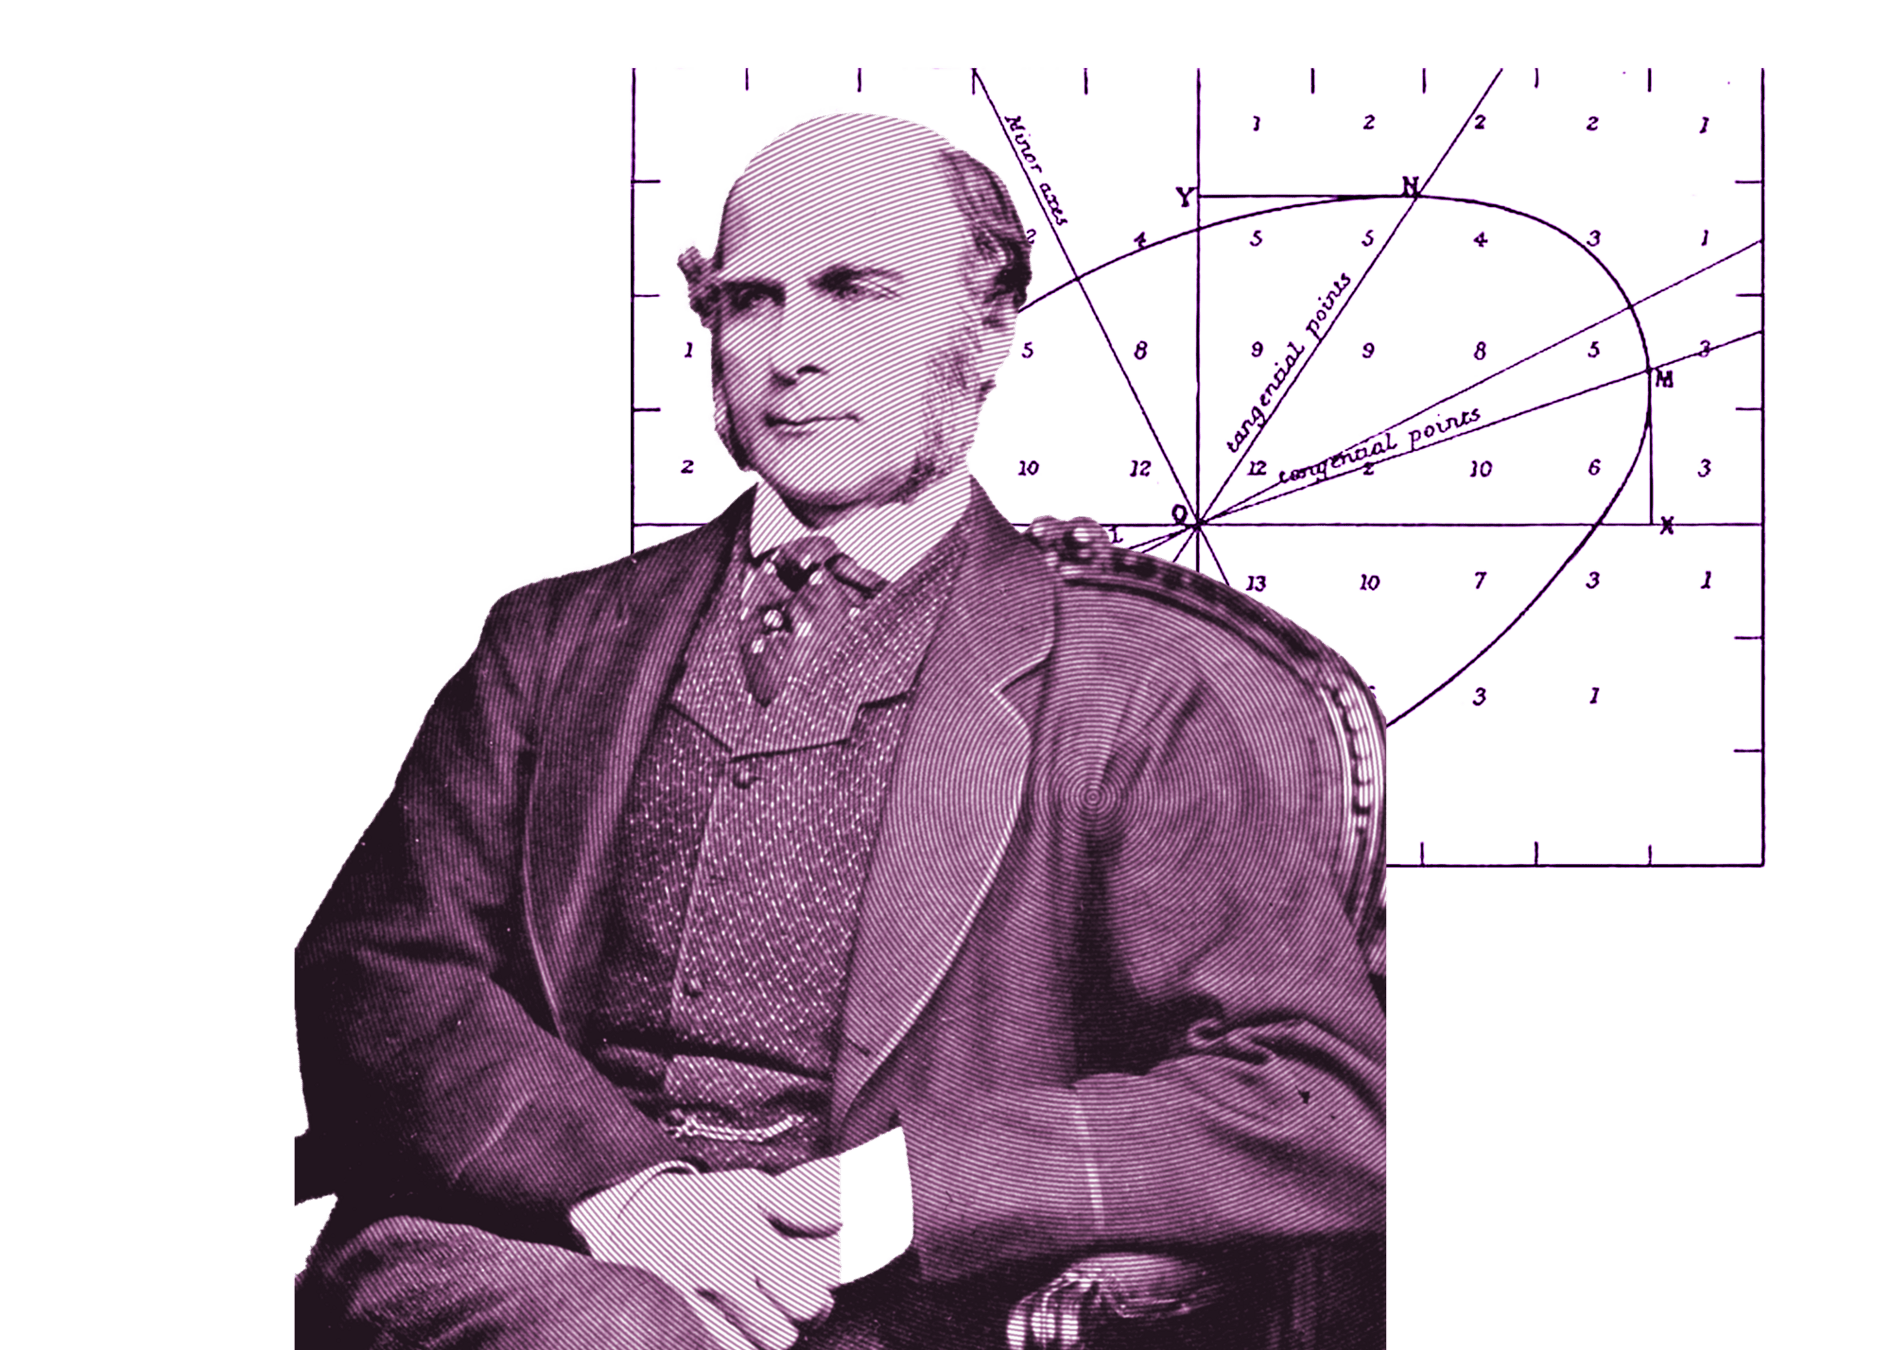
Francis
Galton
image: Wikimedia Commons
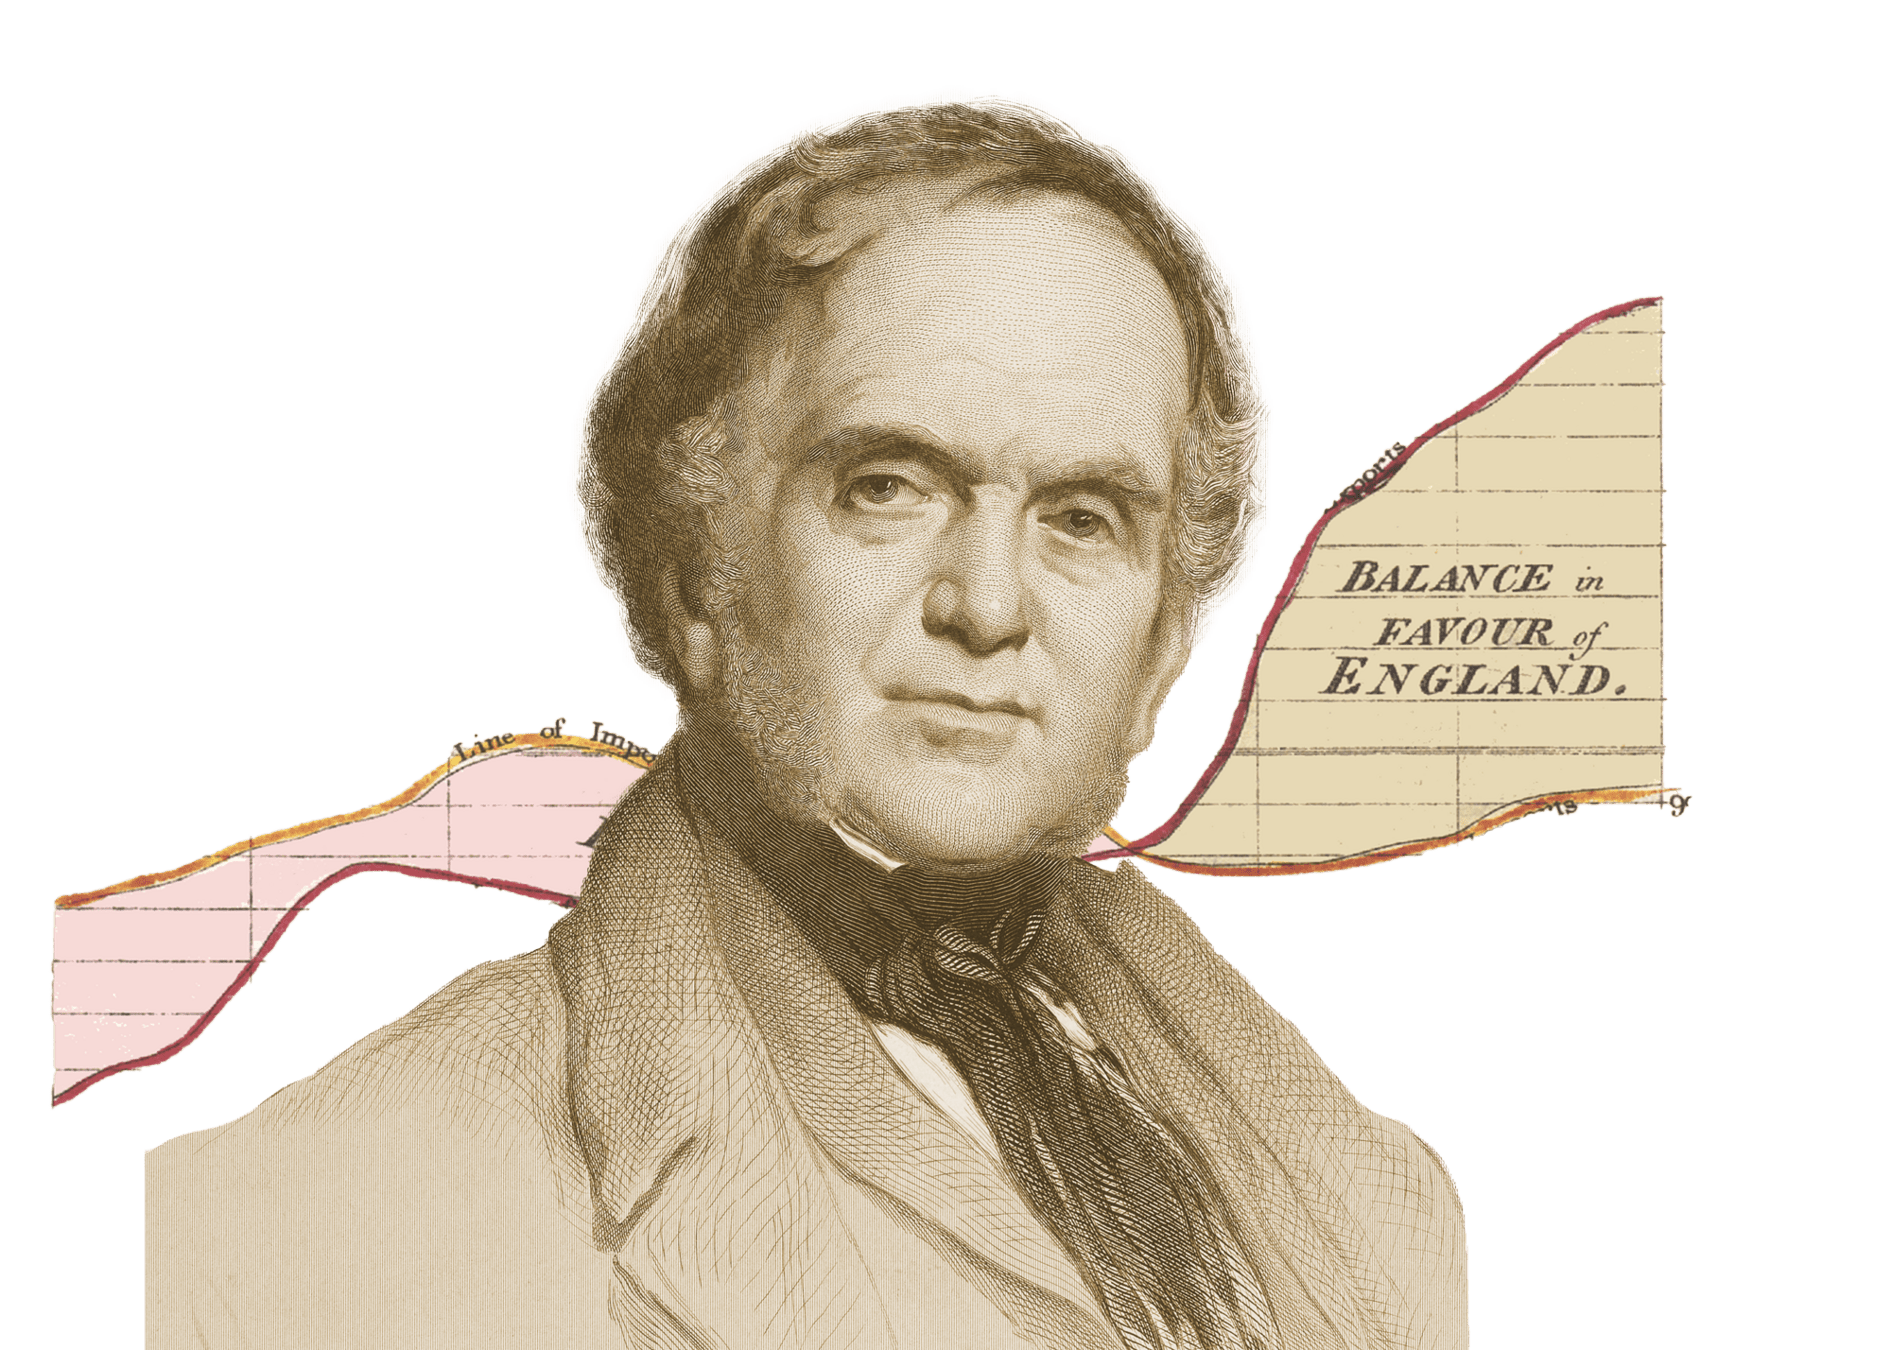
William Henry
Playfair
the architect
image: National Portrait Gallery


Hungarian ugar = barren land
Hungarian culture is provincial, poor, imitative, and traditionally lags behind the West.
Why is sooooo pooooor?

"Adopting a mythical stance is like looking at mountains that peer through high clouds while flying on a plane and assuming that their peaks are all that exist. Snow, Nightingale, Playfair, and other patron saints of visualization are those peaks. The anonymous, failed, neglected Aclands are the slopes. They are silently waiting to be explored."
Alberto Cairo: Heroes of Visualization: John Snow, H.W. Acland, and the Mythmaking Problem. Peachpit, 2013
Our historical perspectives
"The Scottish writer William Playfair claims credit for inventing the graphic method of presentation (in the preface to his 1805 work on the causes of the decline of great and wealthy nations); however, long before that, dating back to 1782, we possess a chart of products by Crome in which various European commodities are indicated by symbols. Indeed, even earlier, Charpentier had made a similar attempt regarding the mining geography of the Electorate of Saxony, wherein various types of earth and rock were depicted in color, effectively creating a visual representation."
Sándor Konek: A statistika elmélete. Gyor, 1847. p. 57.
Our historical perspectives
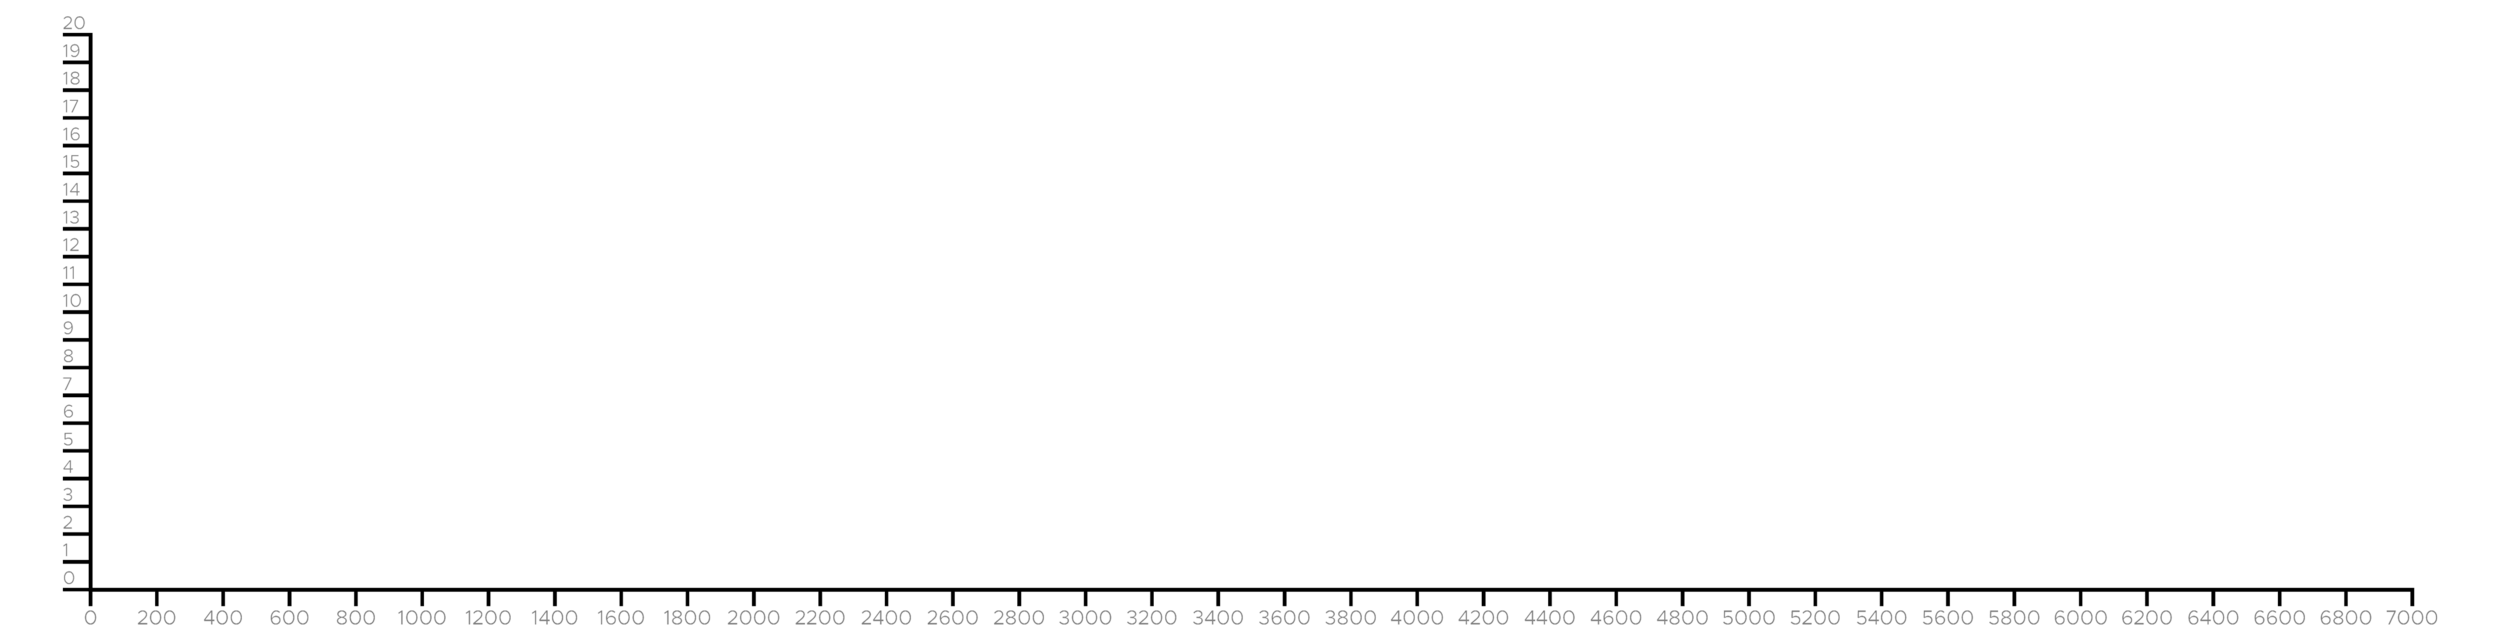
historical timeline
countries mentioned
Marey
Funkhouser
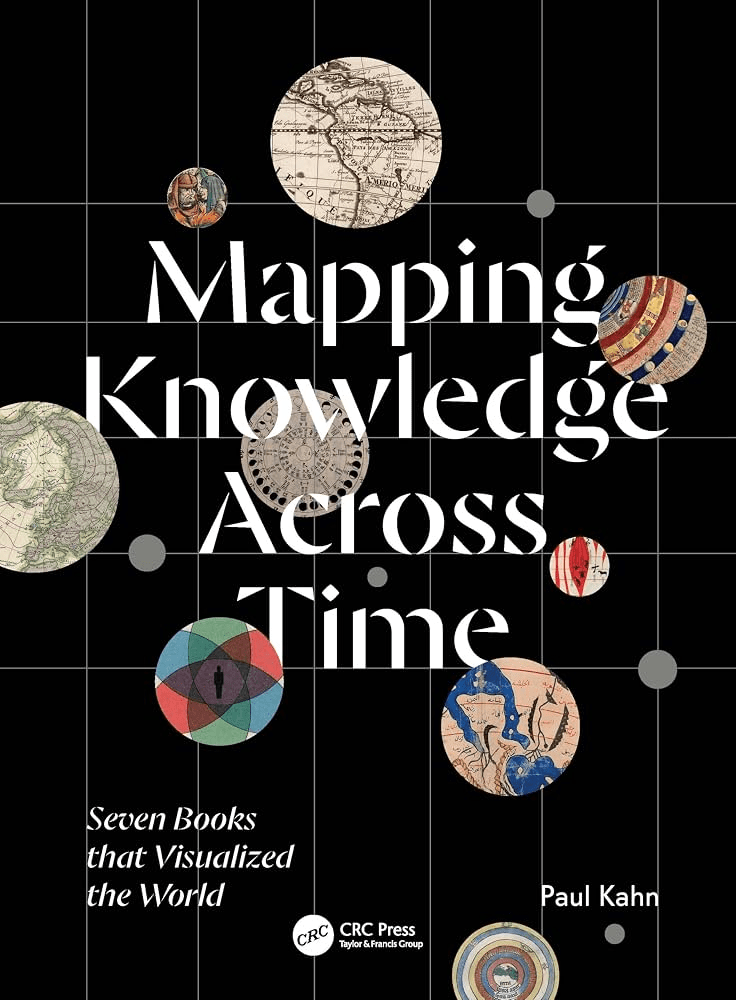
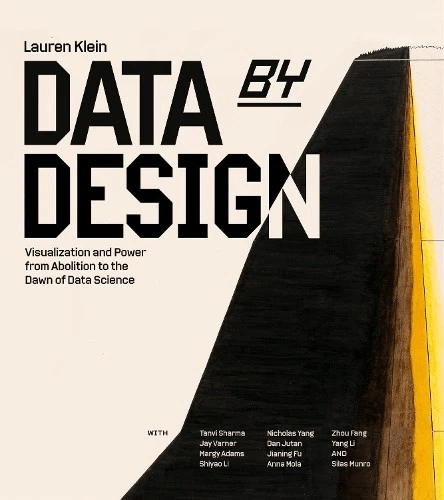
Friendly
Beniger and Robyn
Rendgen and Wiedemann


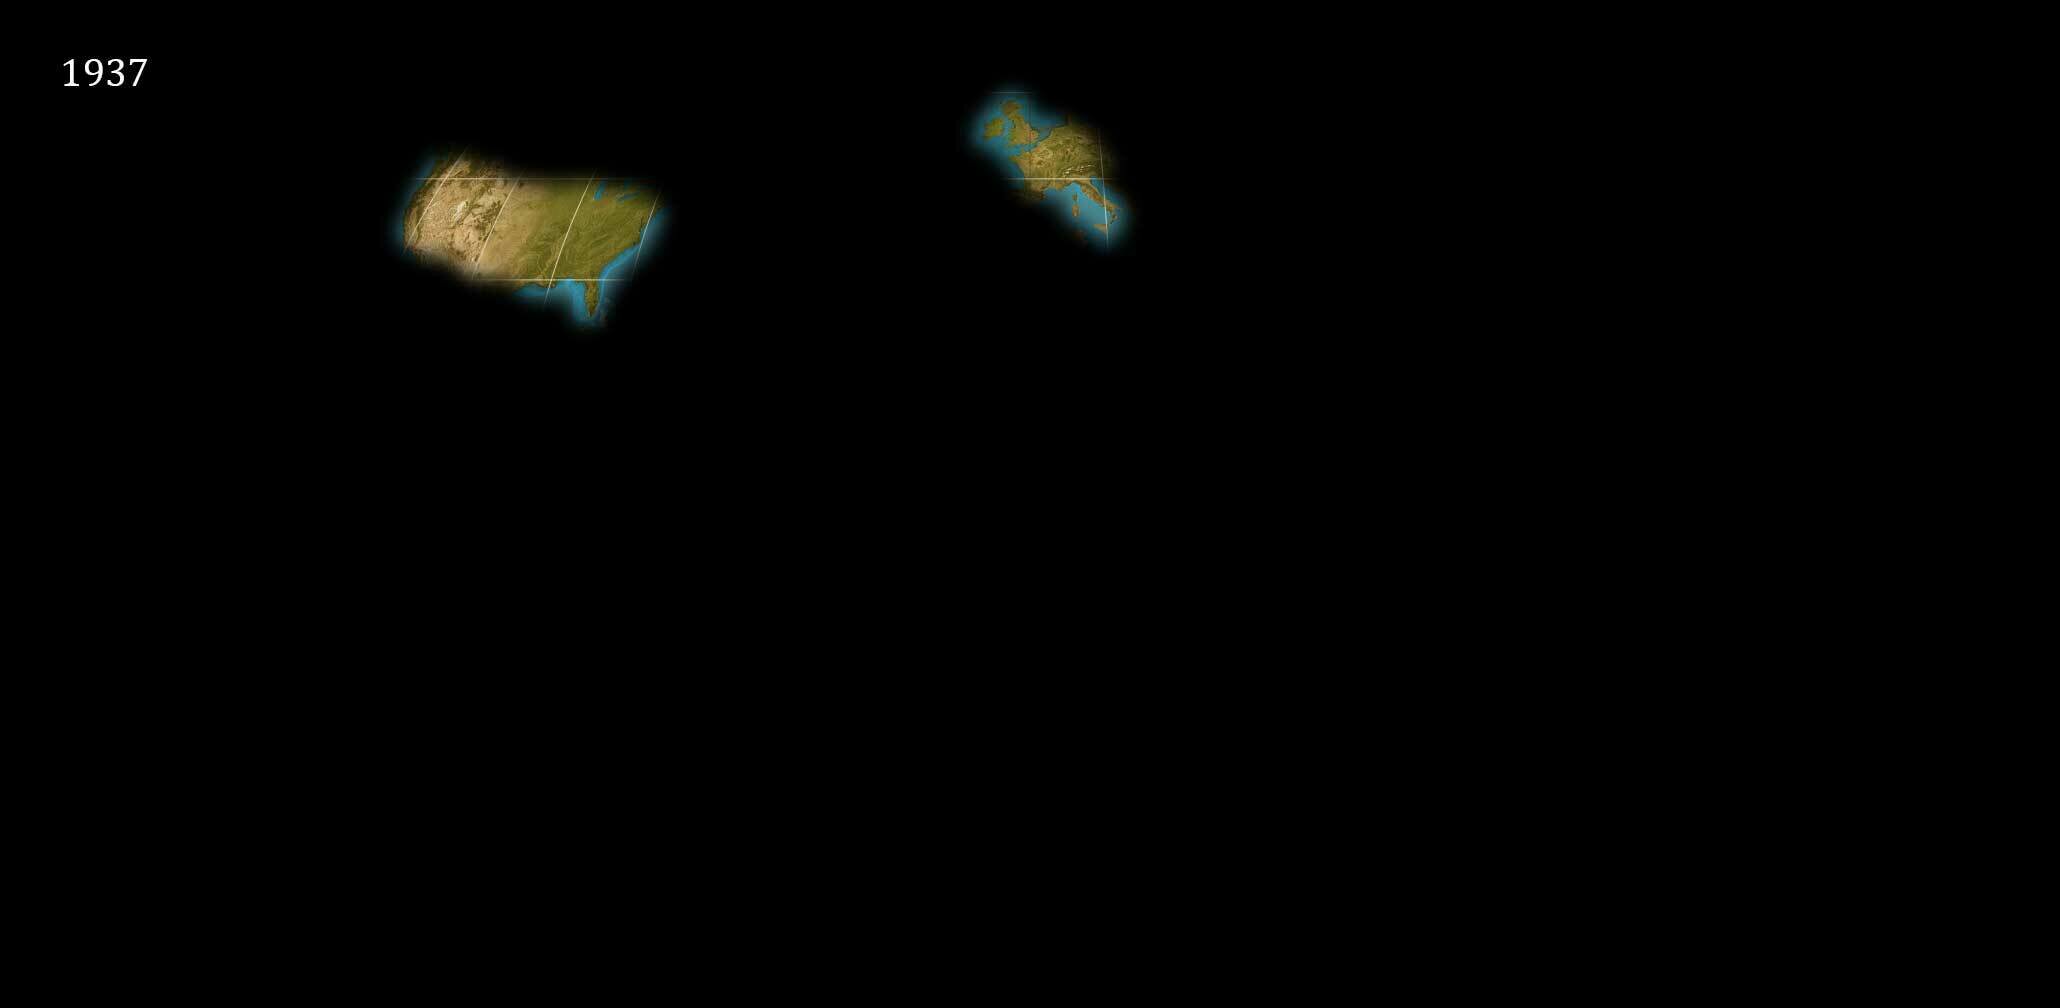
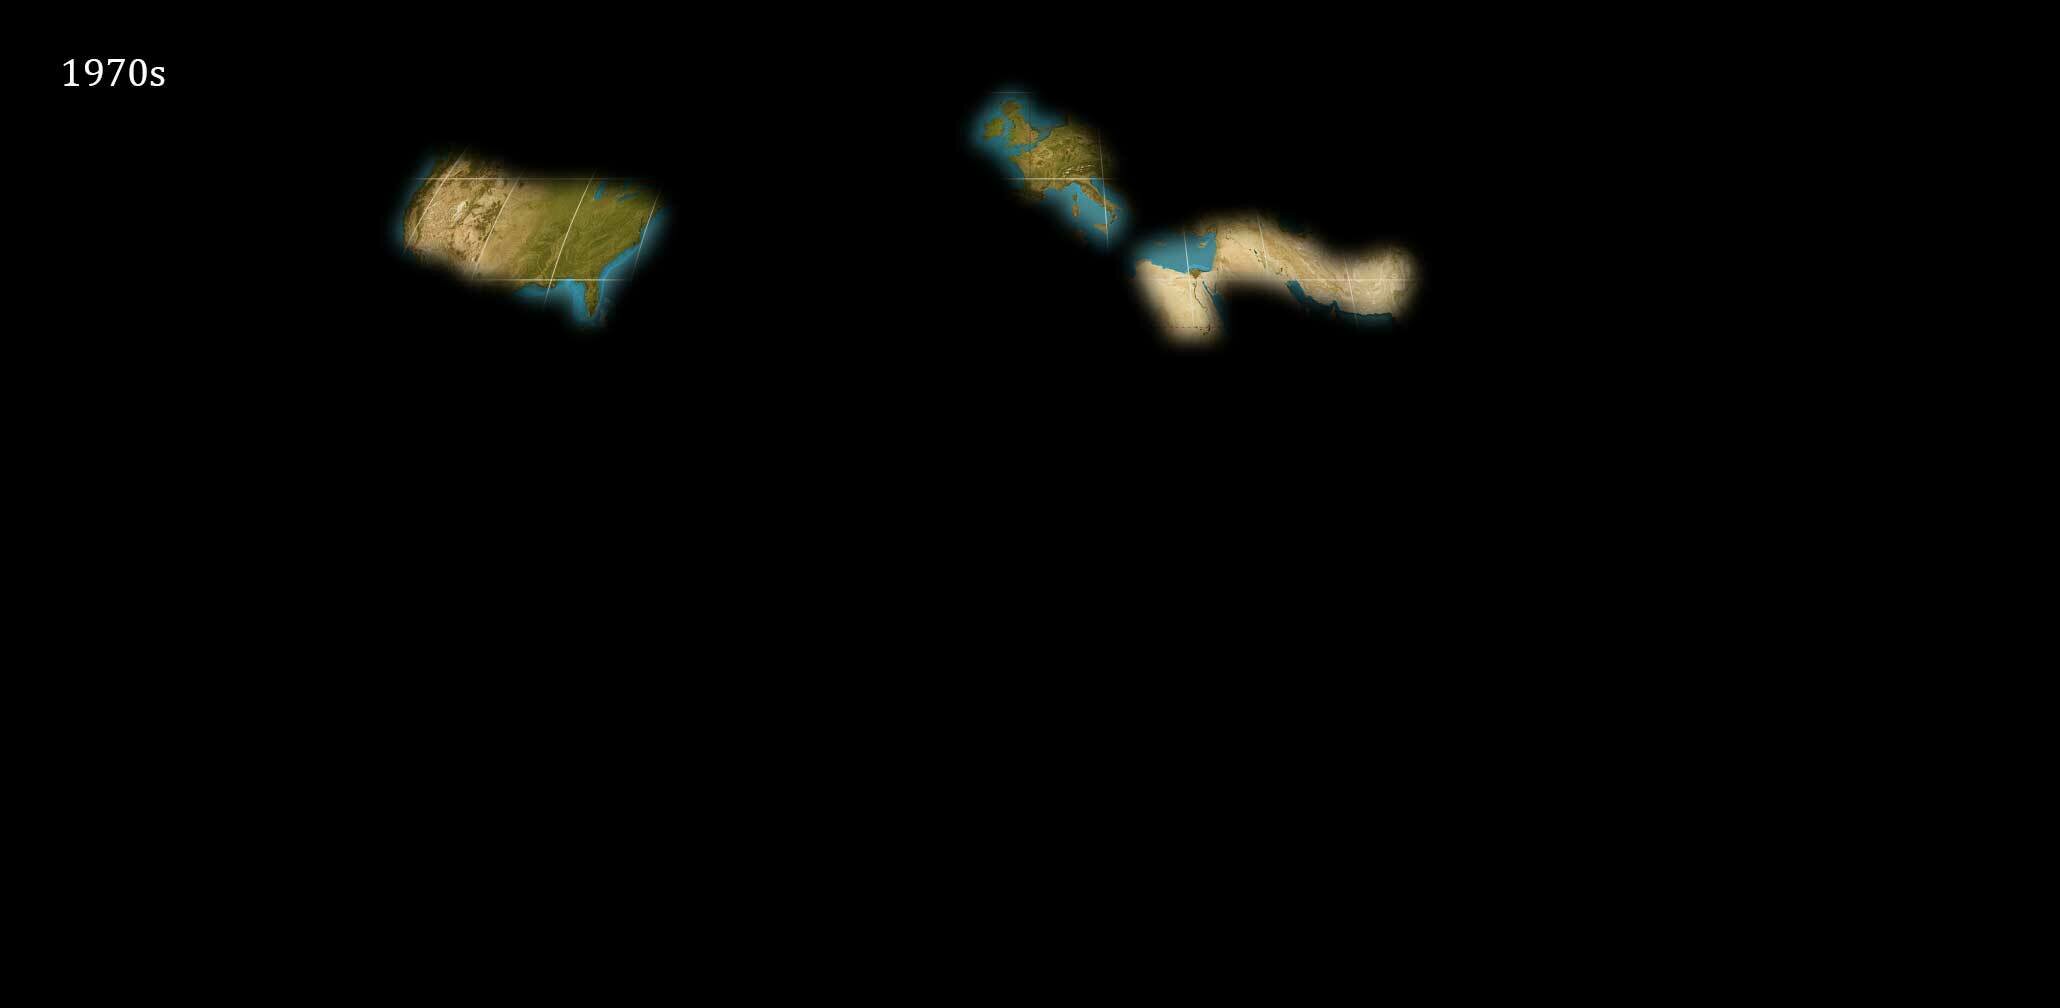
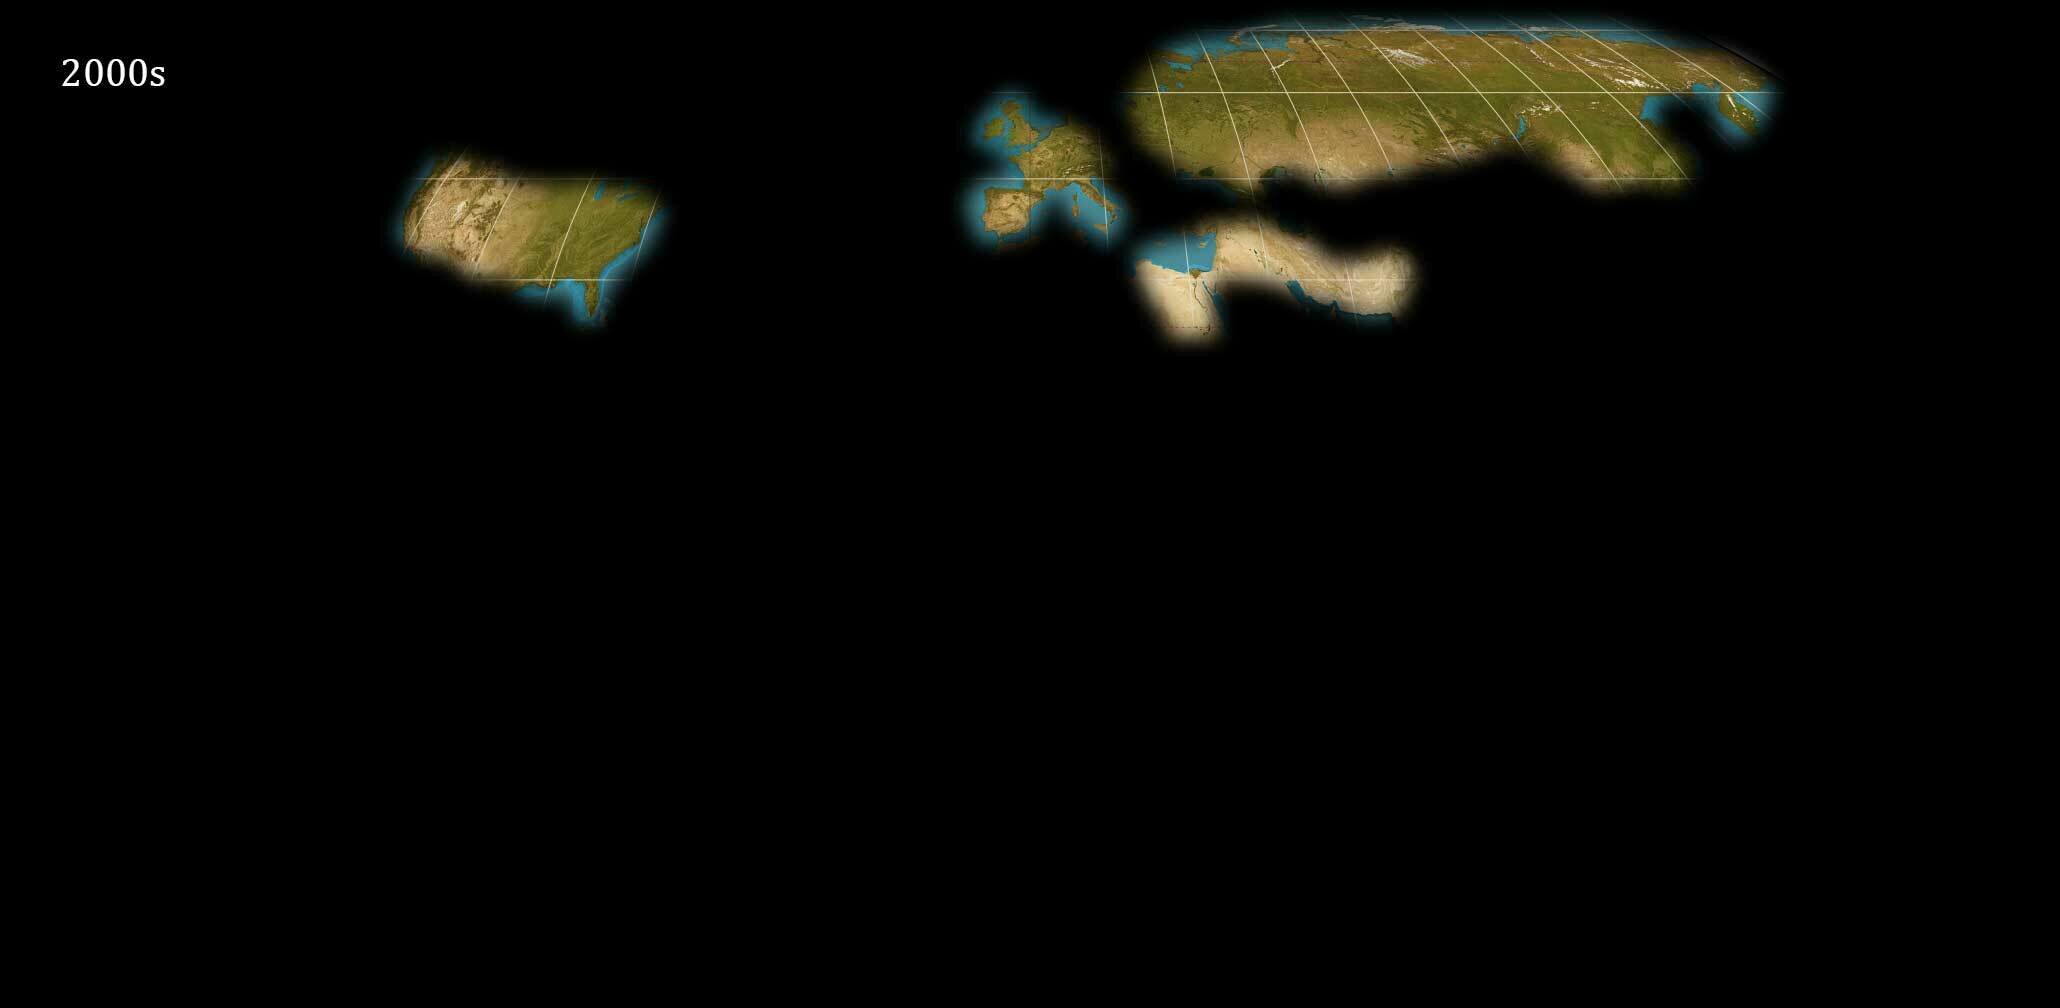
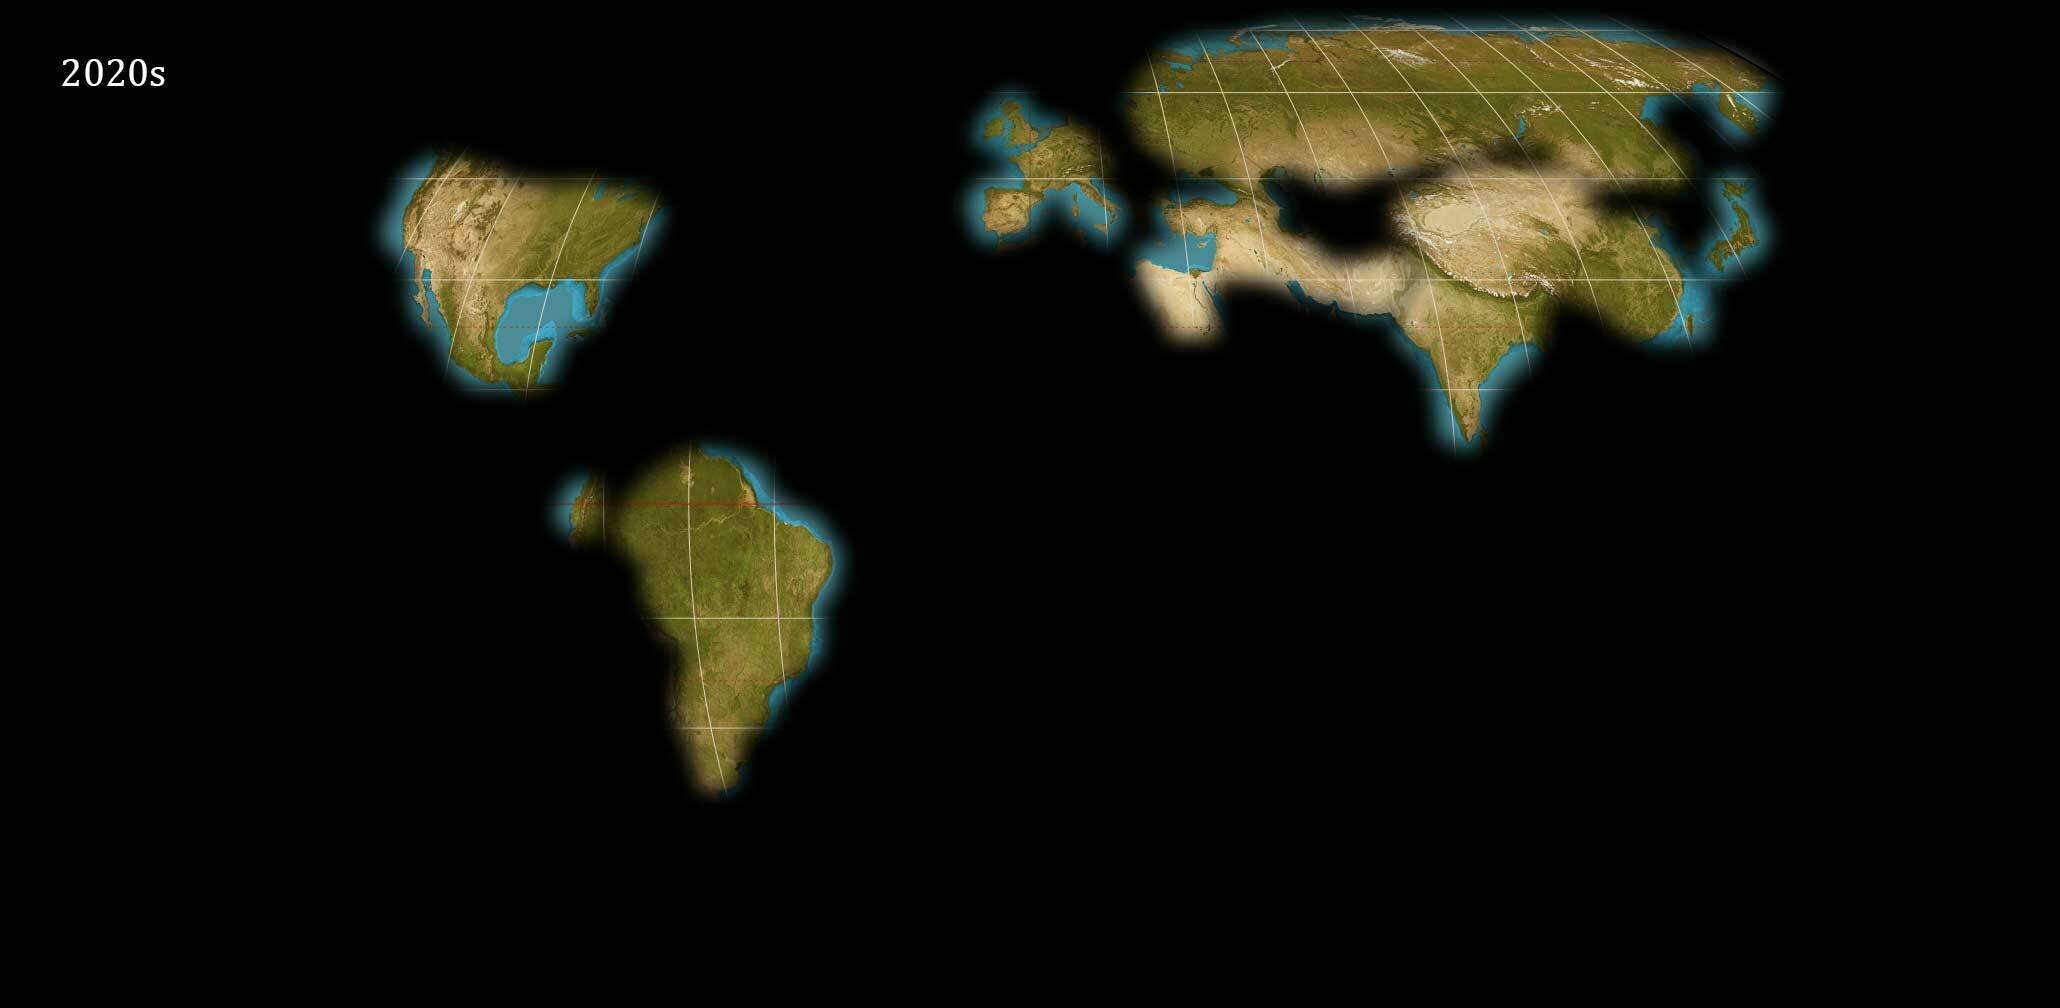
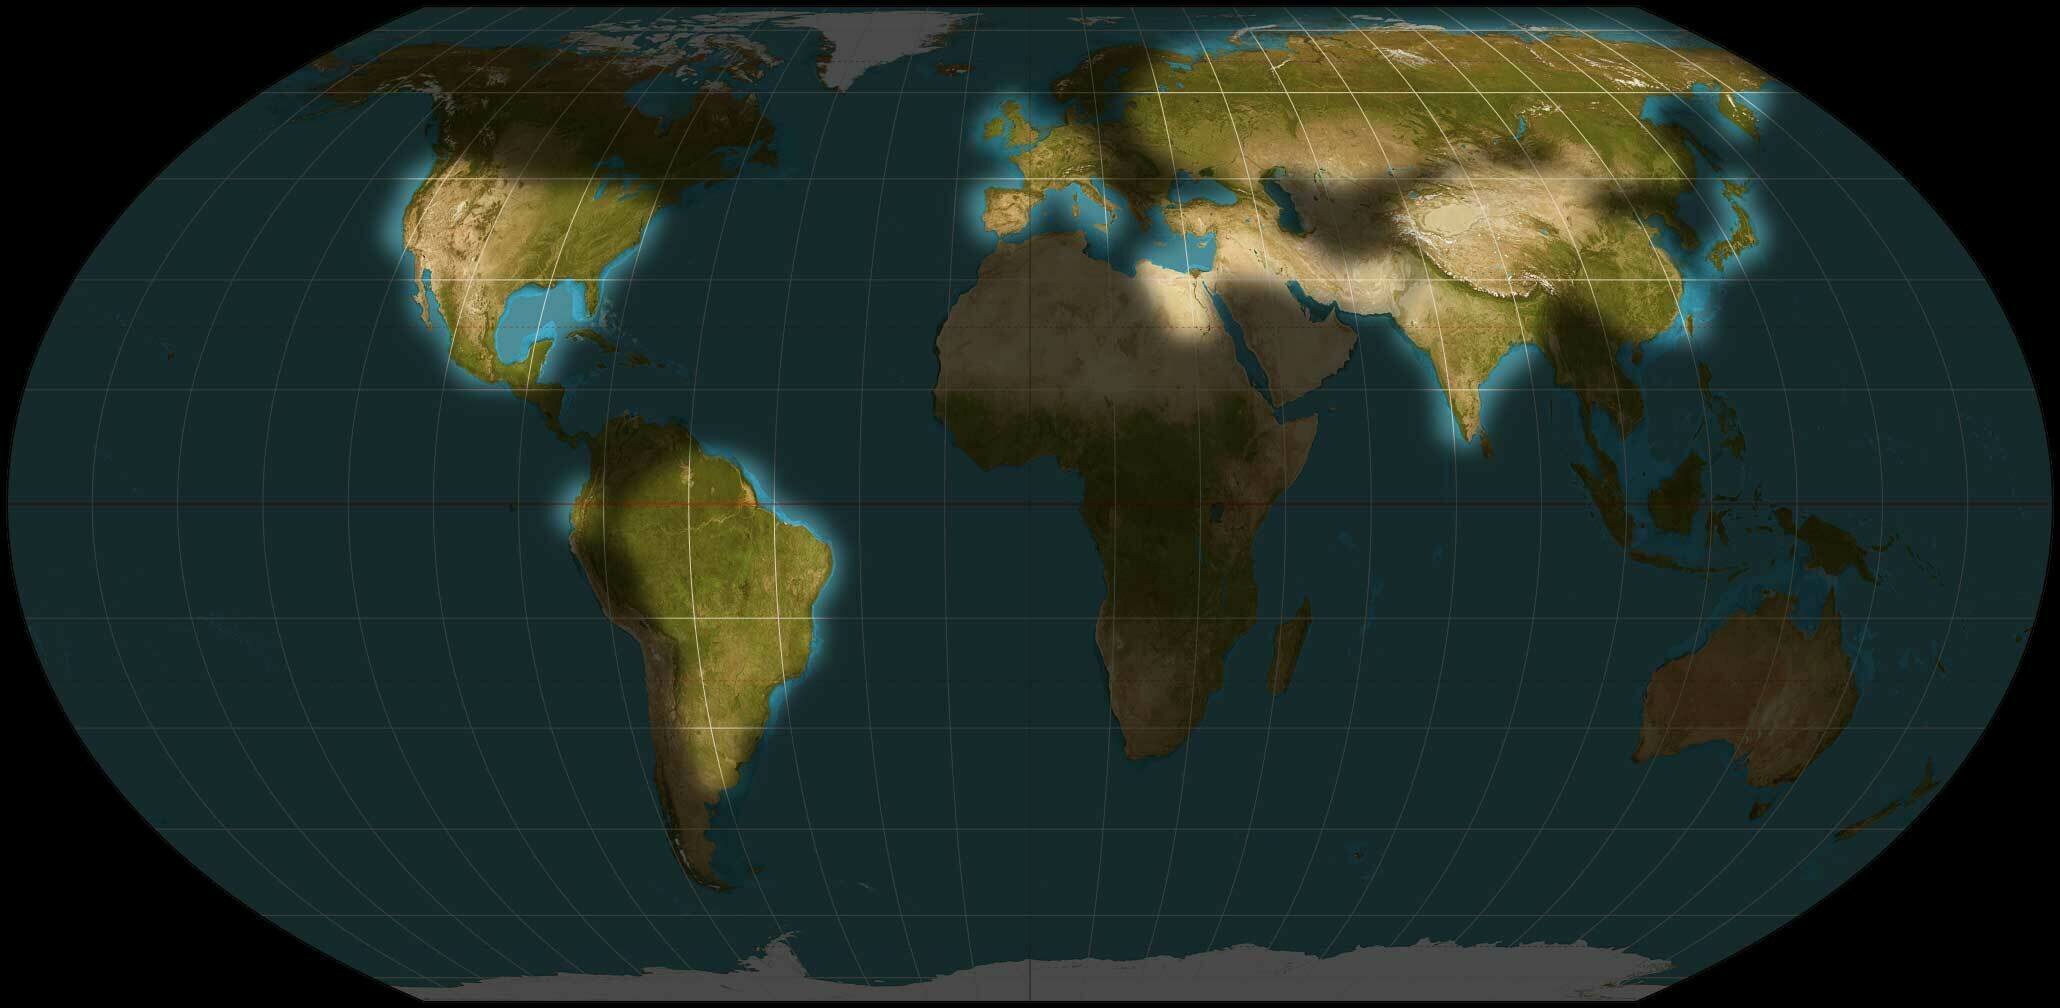
Background
- My doctoral thesis
- Nightingale
- Inspiration
- Support

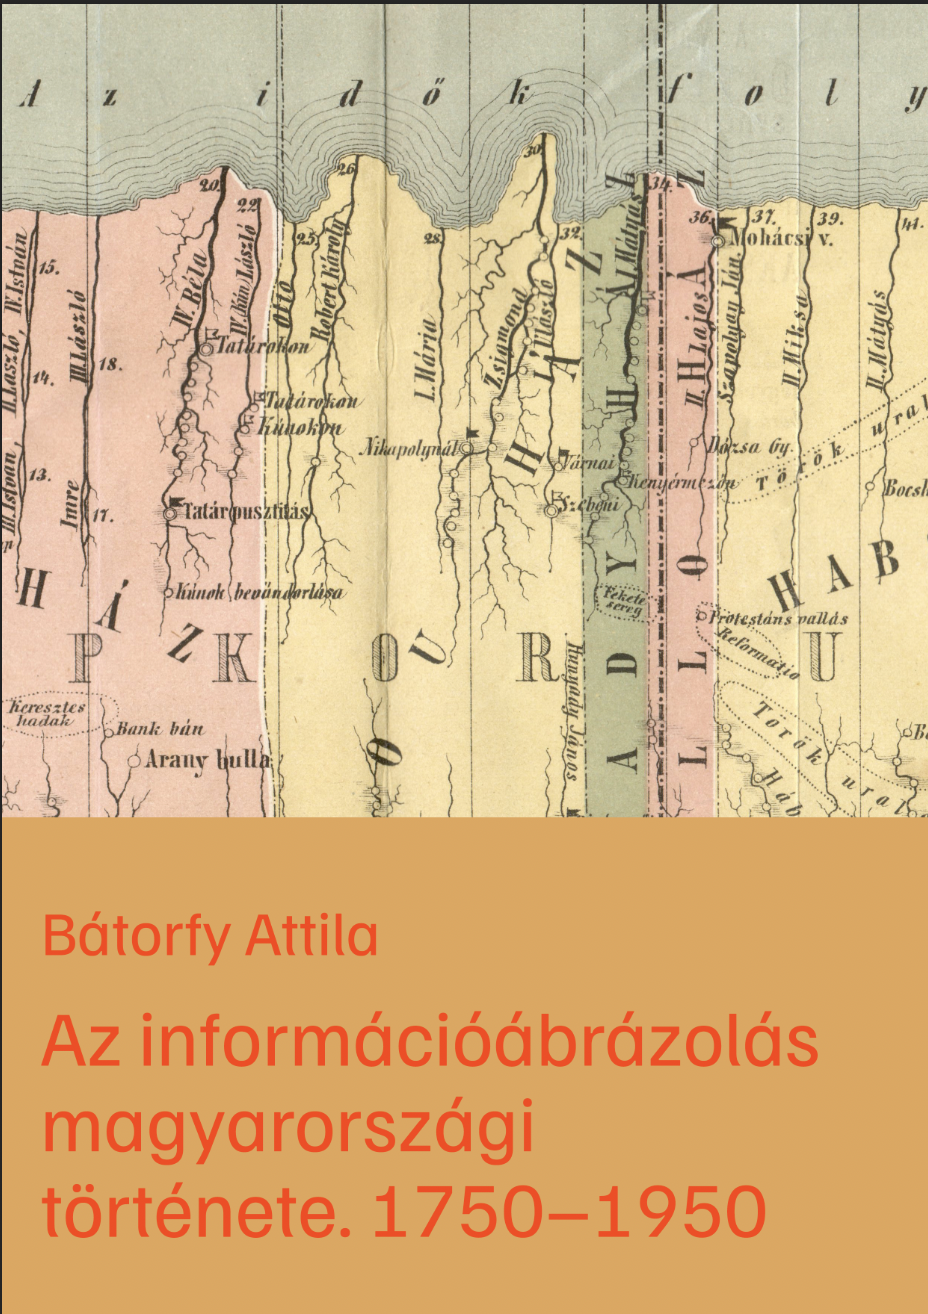

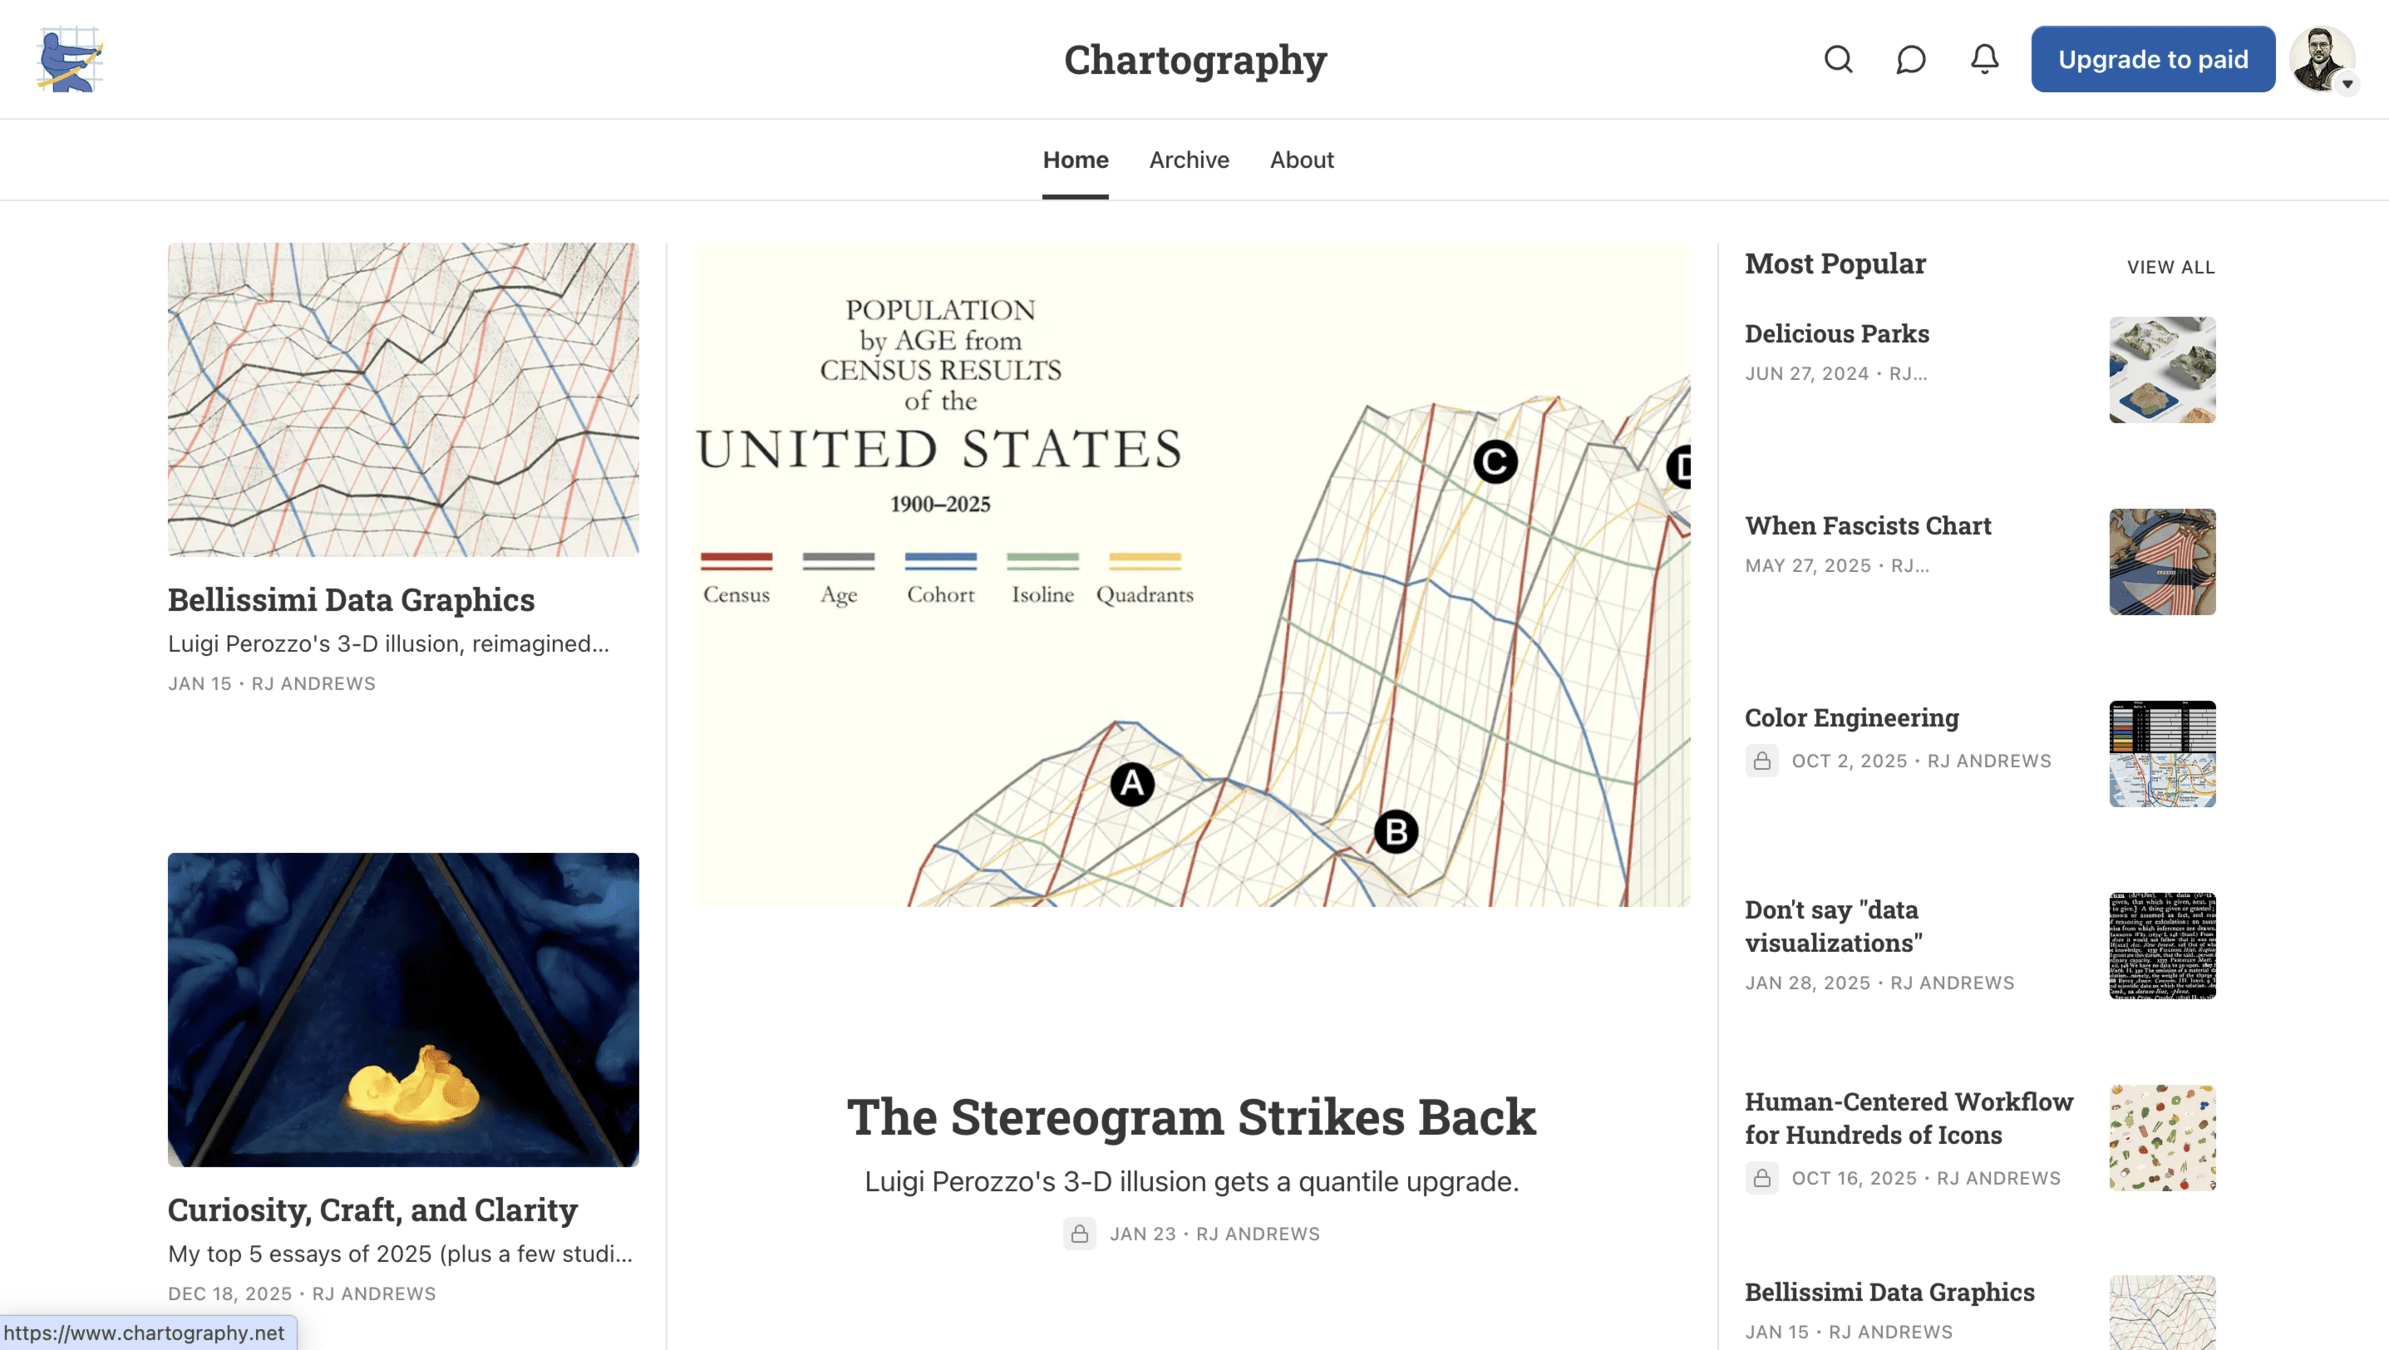
RJ, Jason, Paul, Michael, Alberto
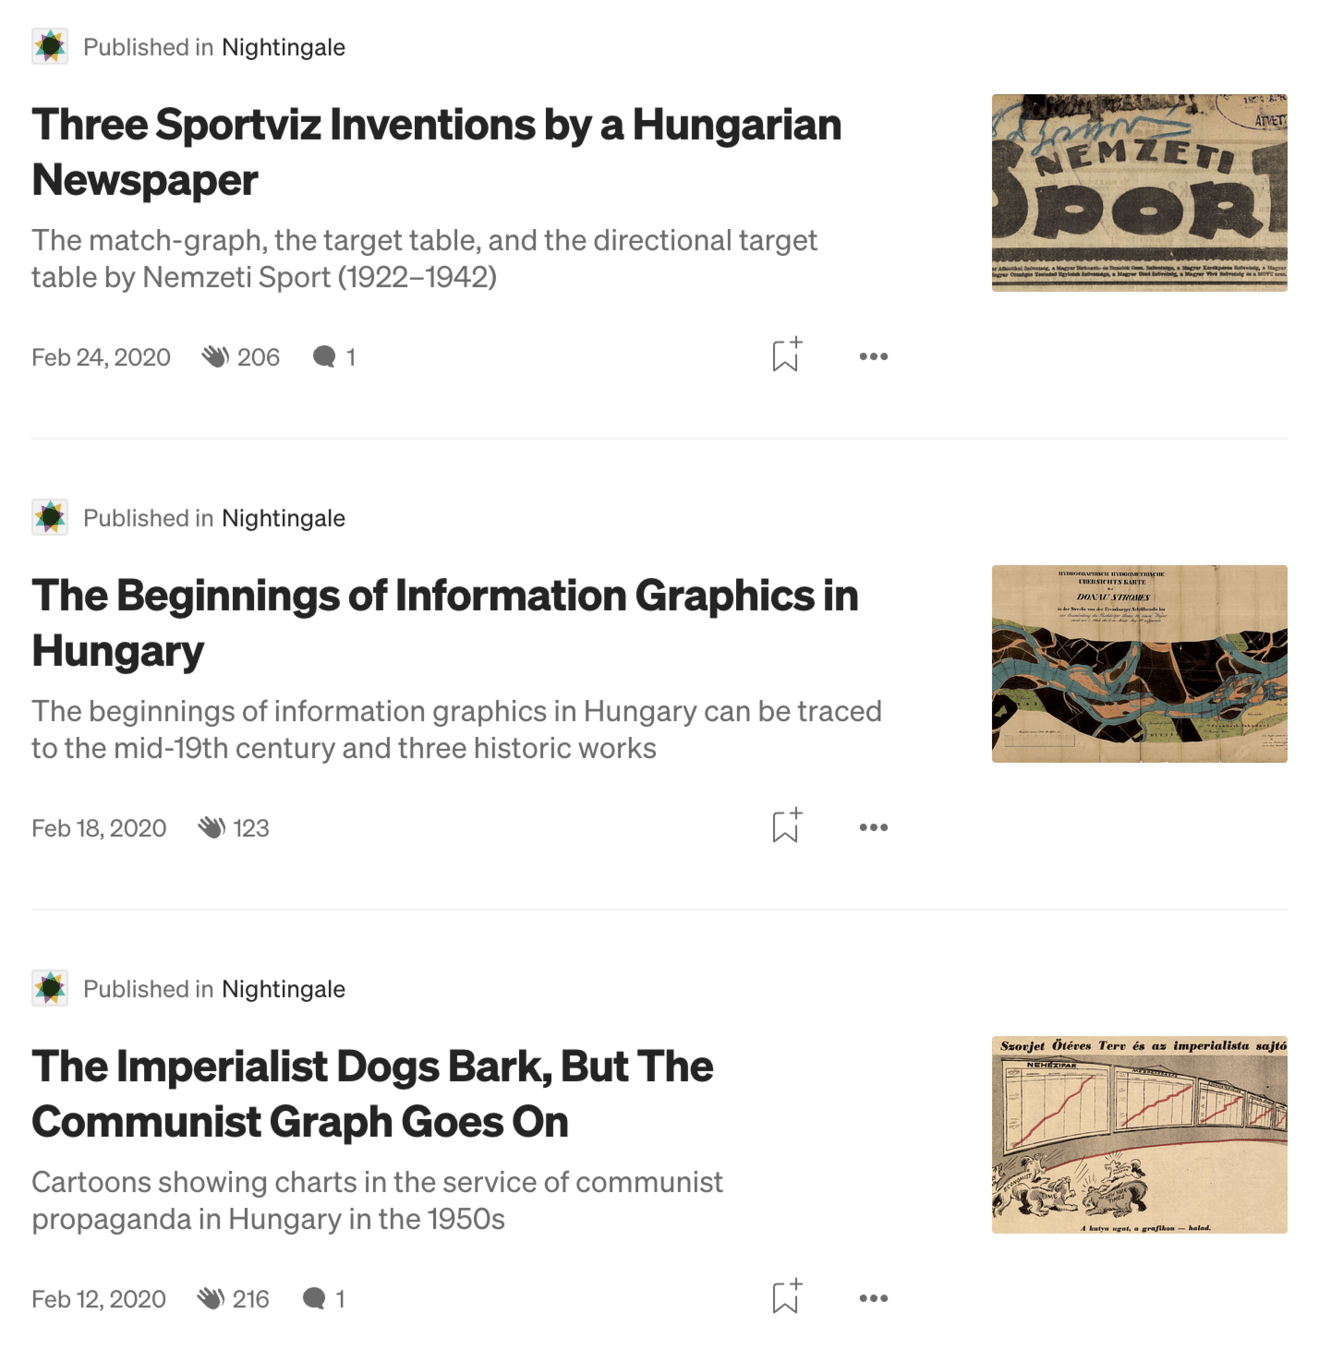
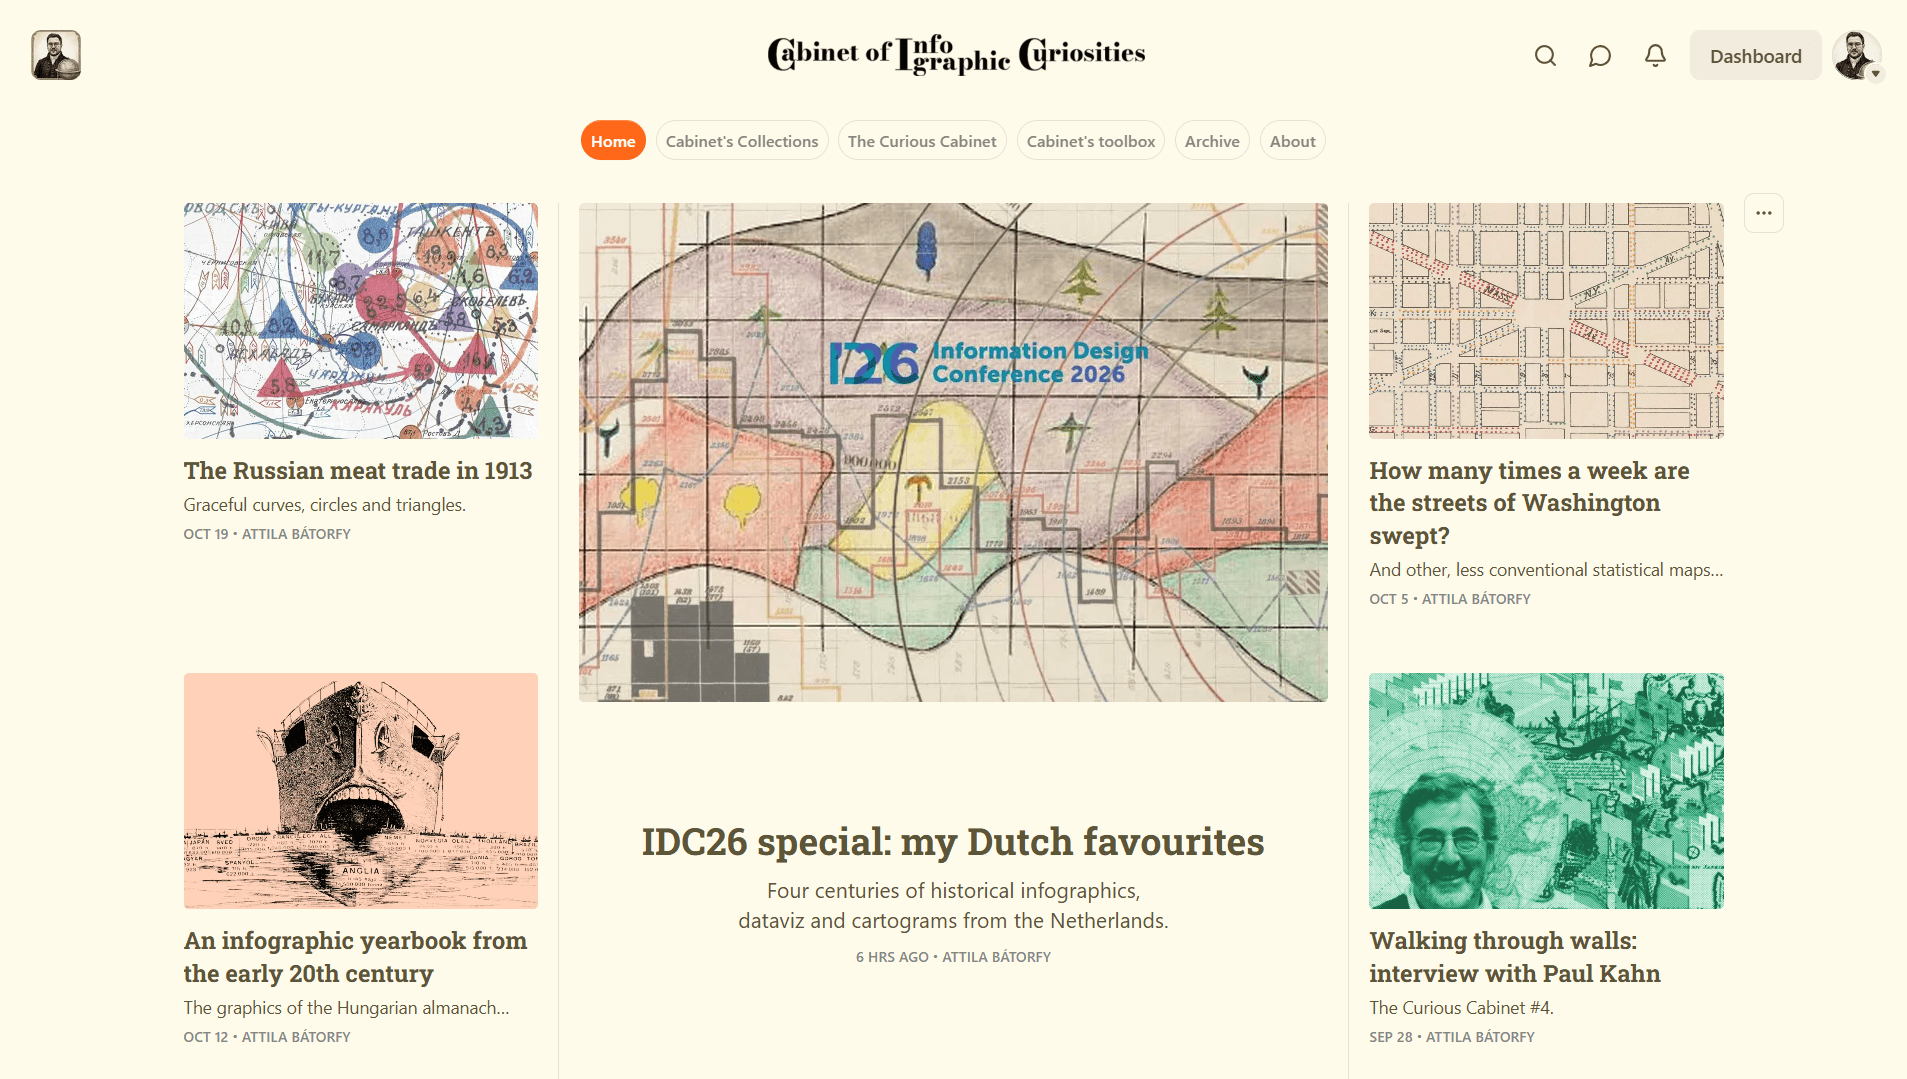
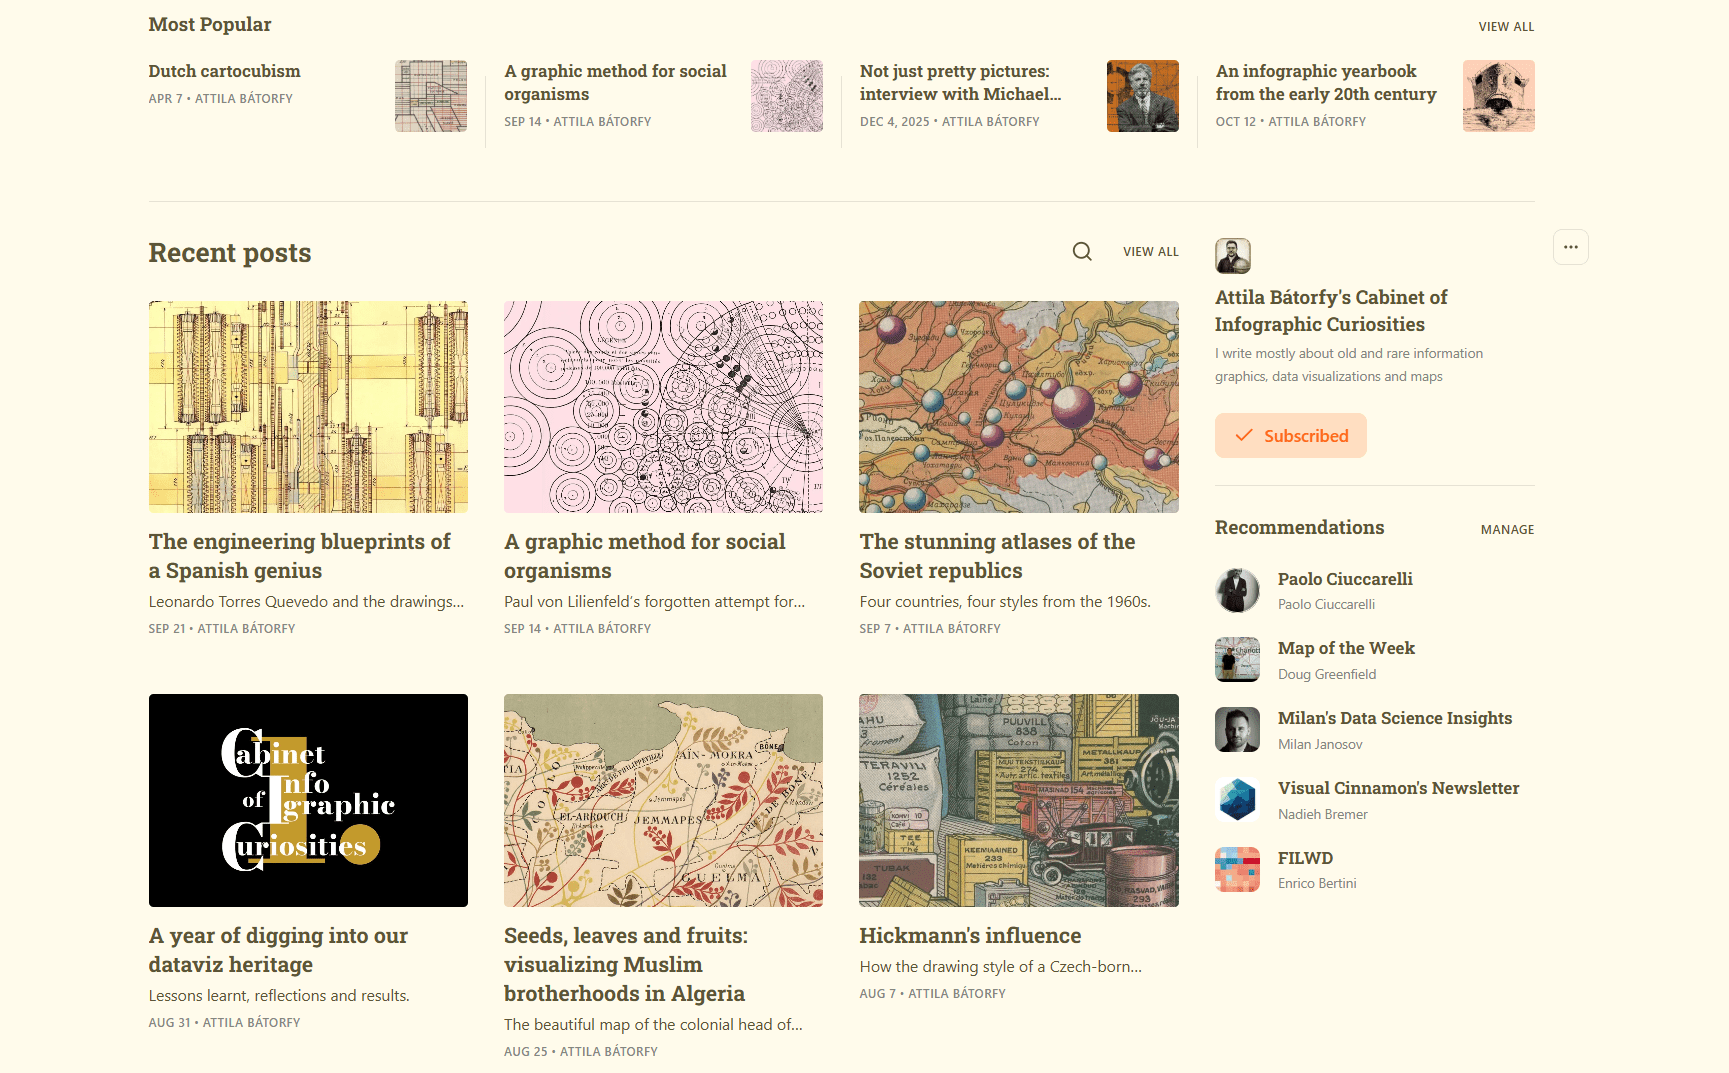
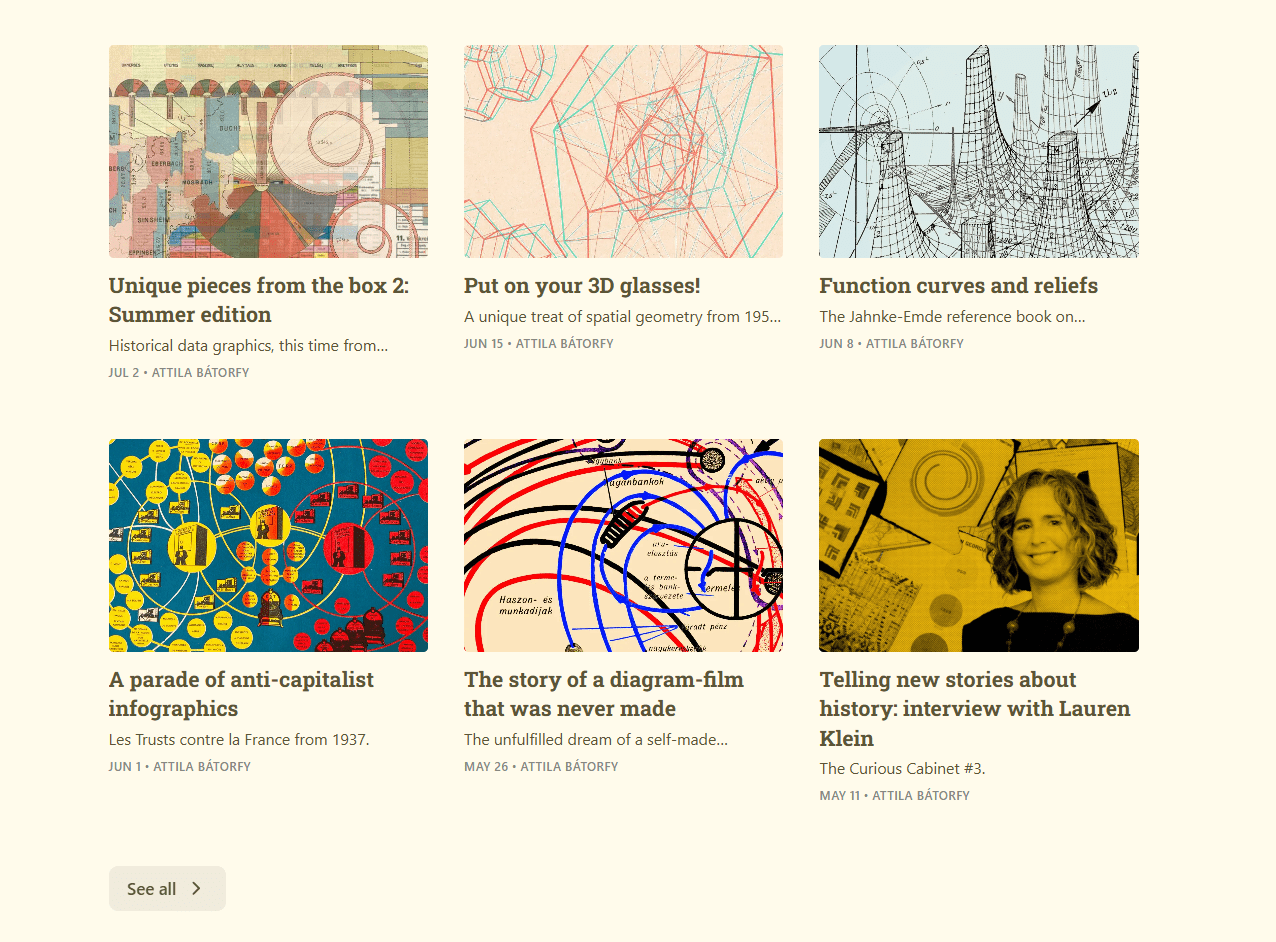
- What lies beyond the Western world?
- What is the relation between the West and other regions of the world?
- What does the West not know about itself?
- Can the traditional Western-centric narrative be supplemented/corrected?
but not rejected!
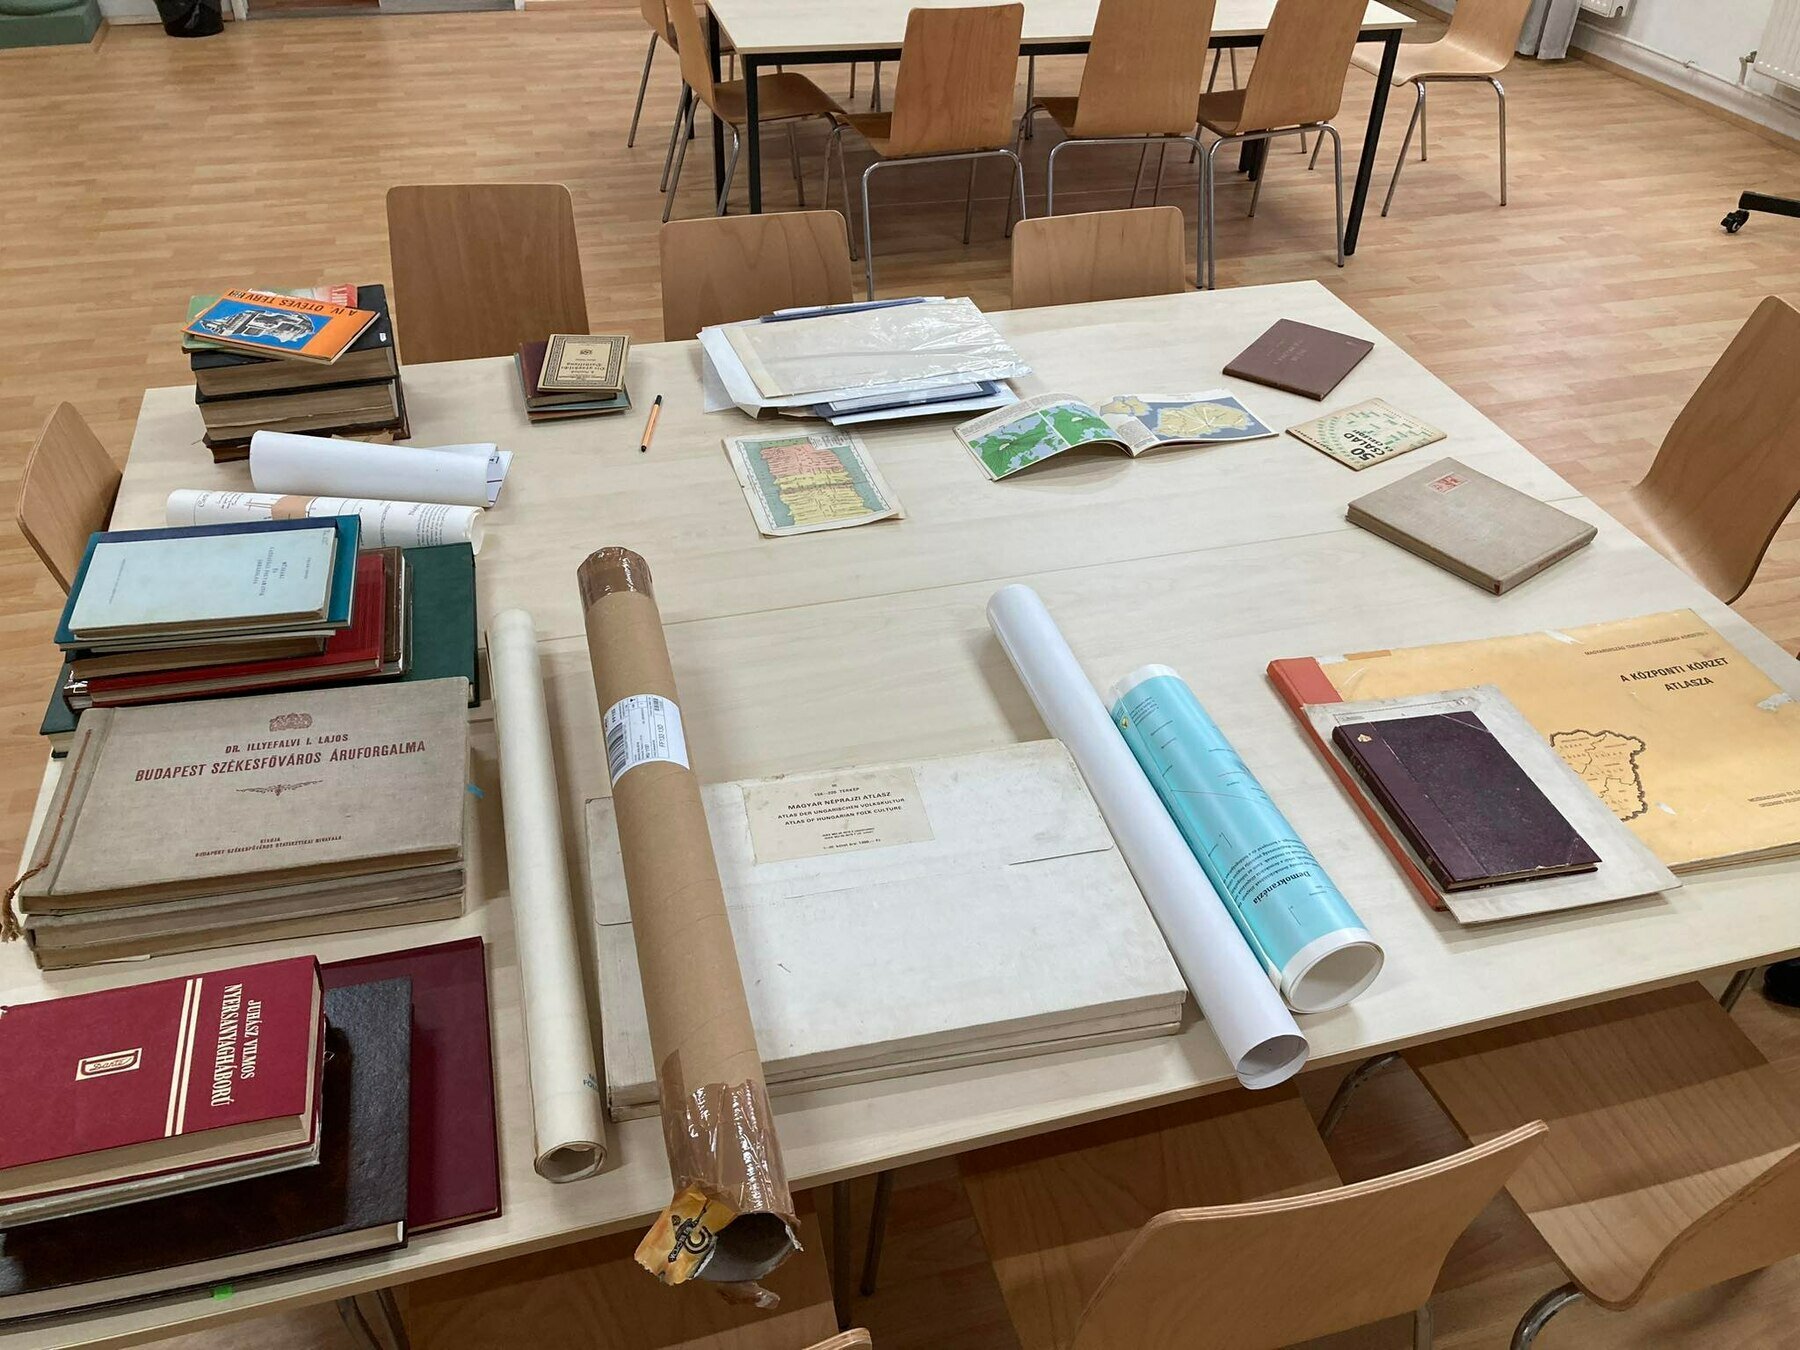
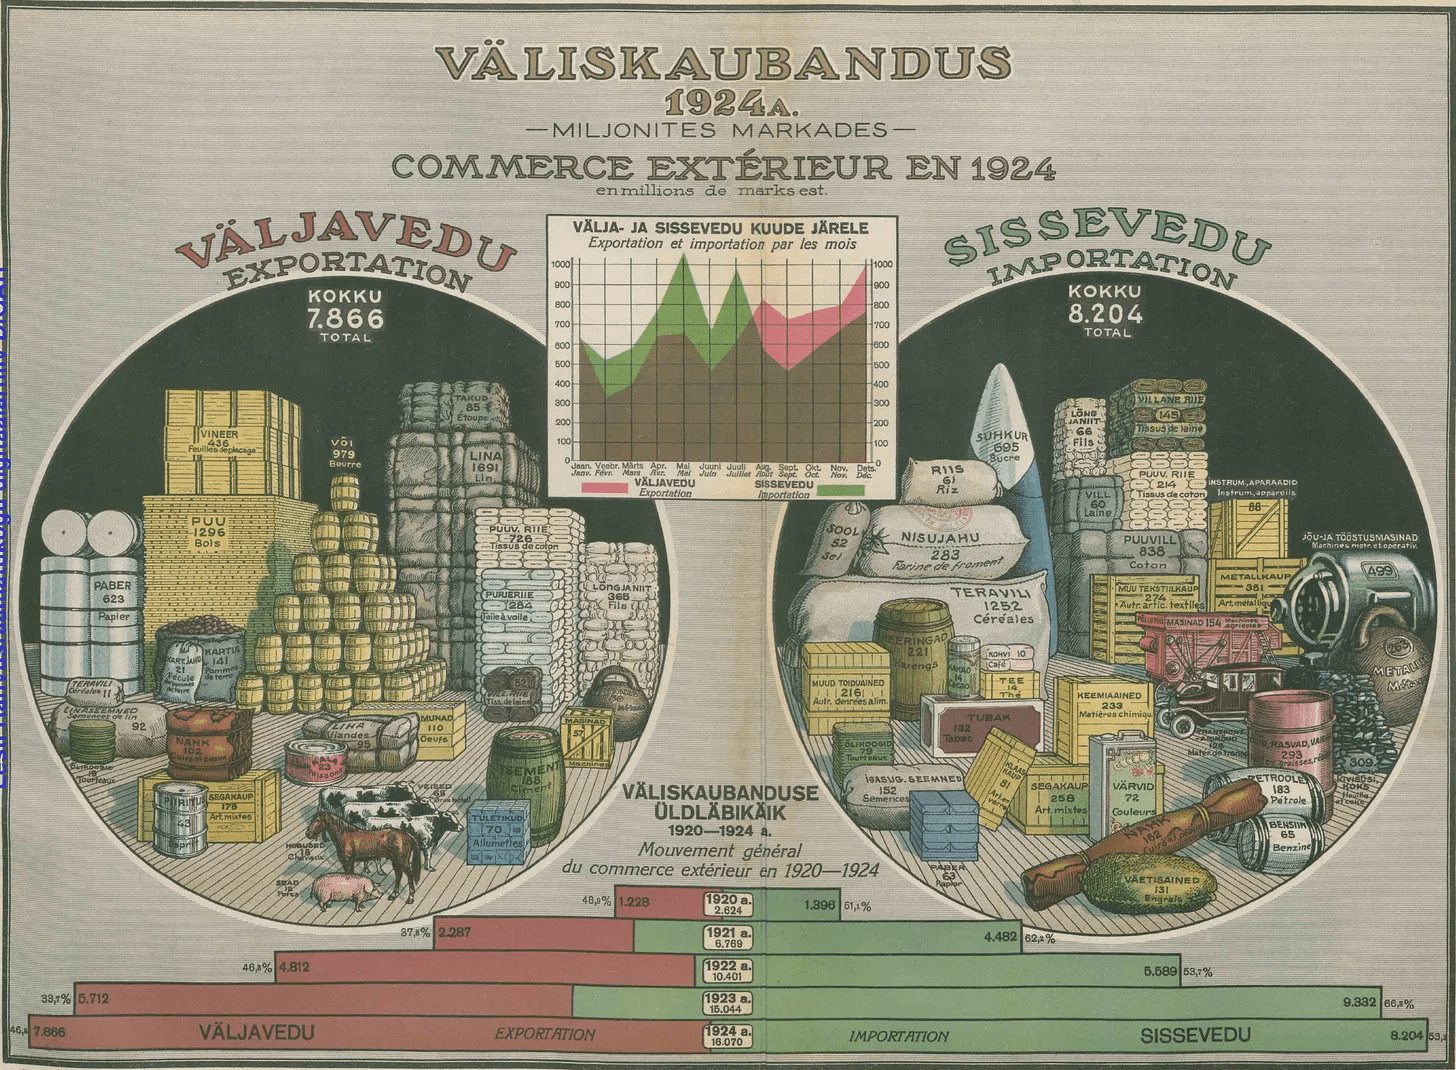
- discovering and presenting unknown, lesser-known and rare data graphics, cartograms and visualization ideas from all around the world
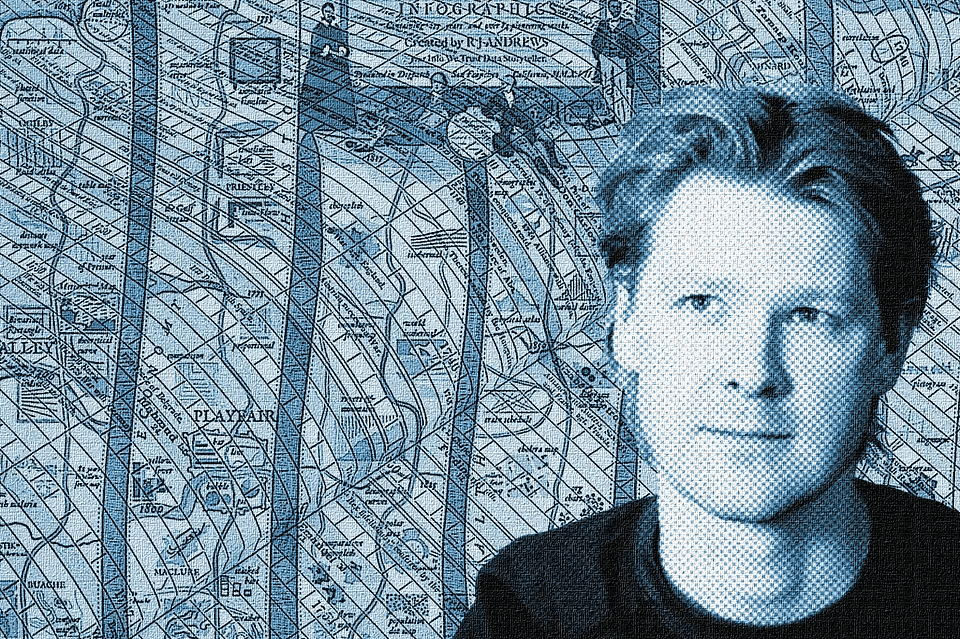
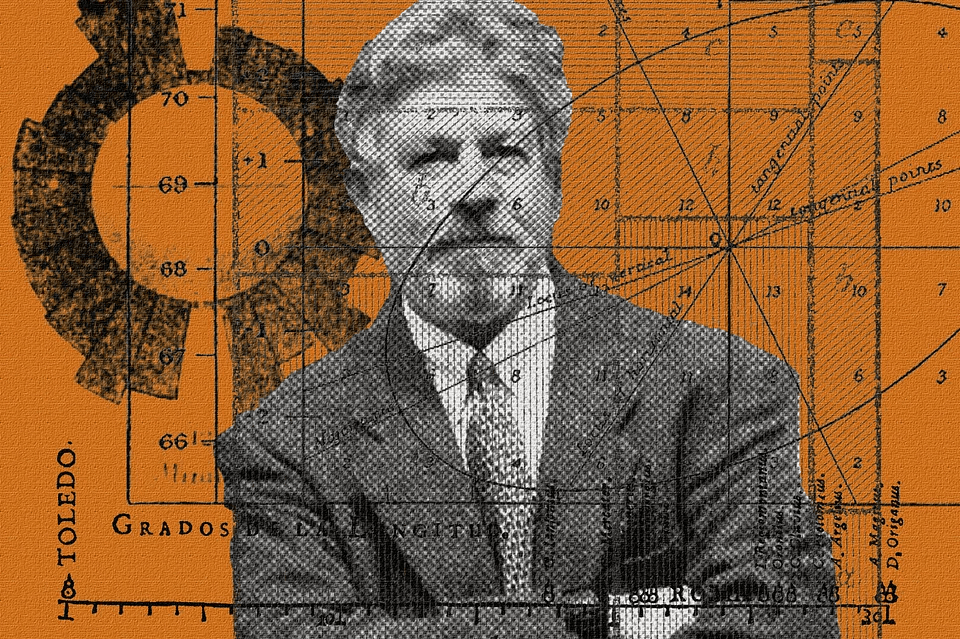
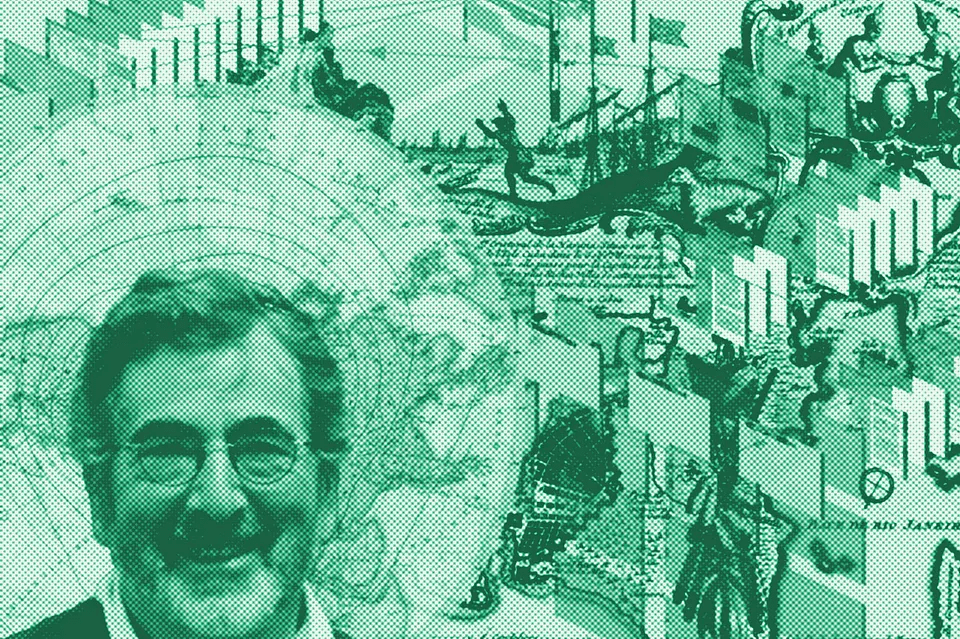
- interviewing researchers, scholars, collectors
- involving others, or encouraging them to participate in the research
method
some discoveries, identifications or first publications in English
Imre Milecz: Mappa Regni Hungariae demonstrans universas caeo regias salis stationes..., 1773
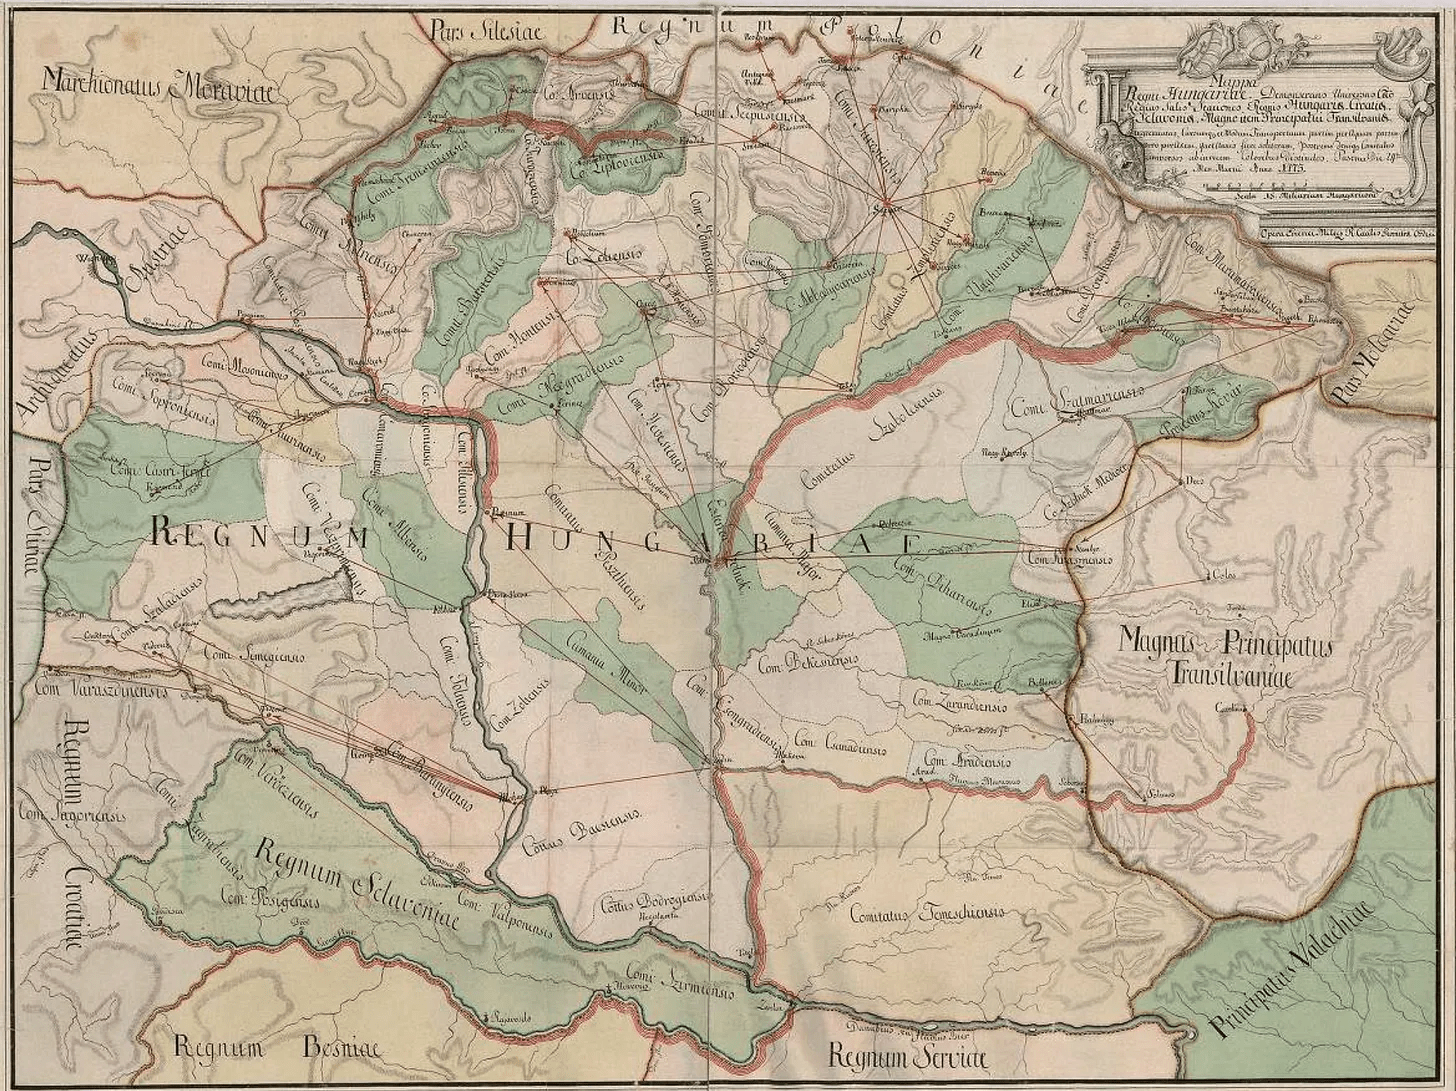
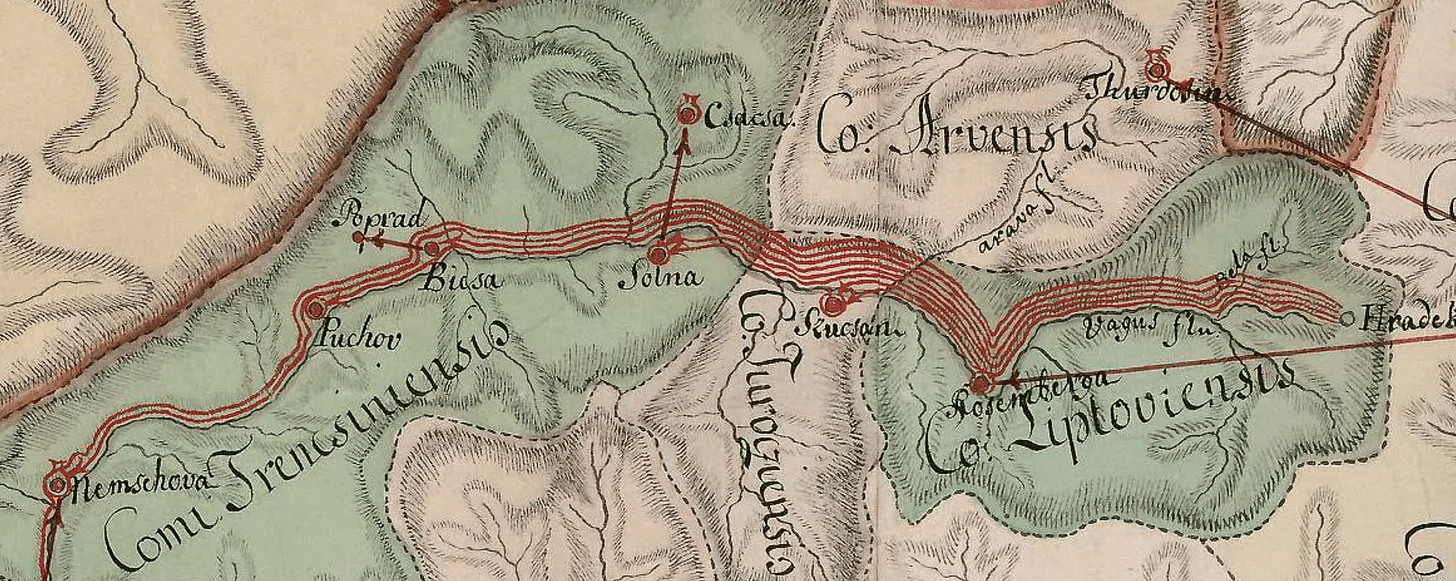
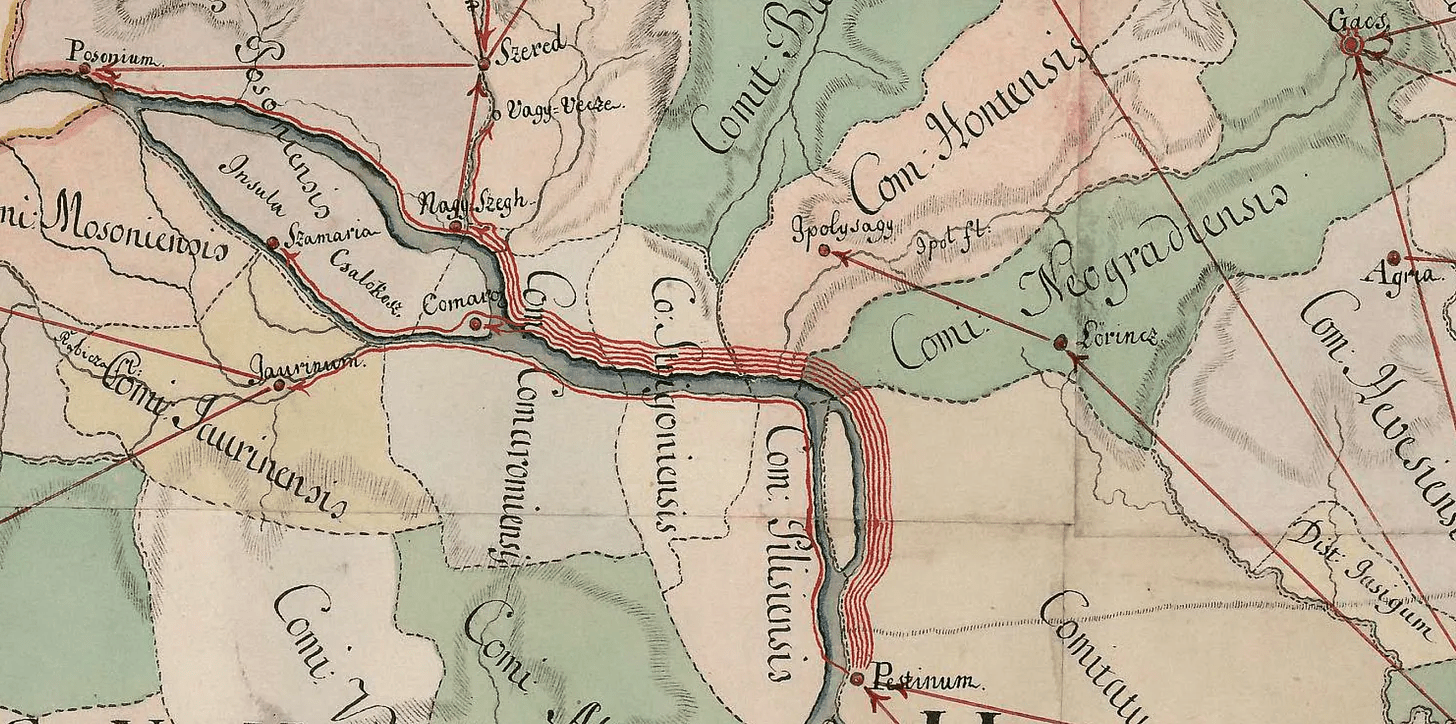
Source: National Széchenyi Library
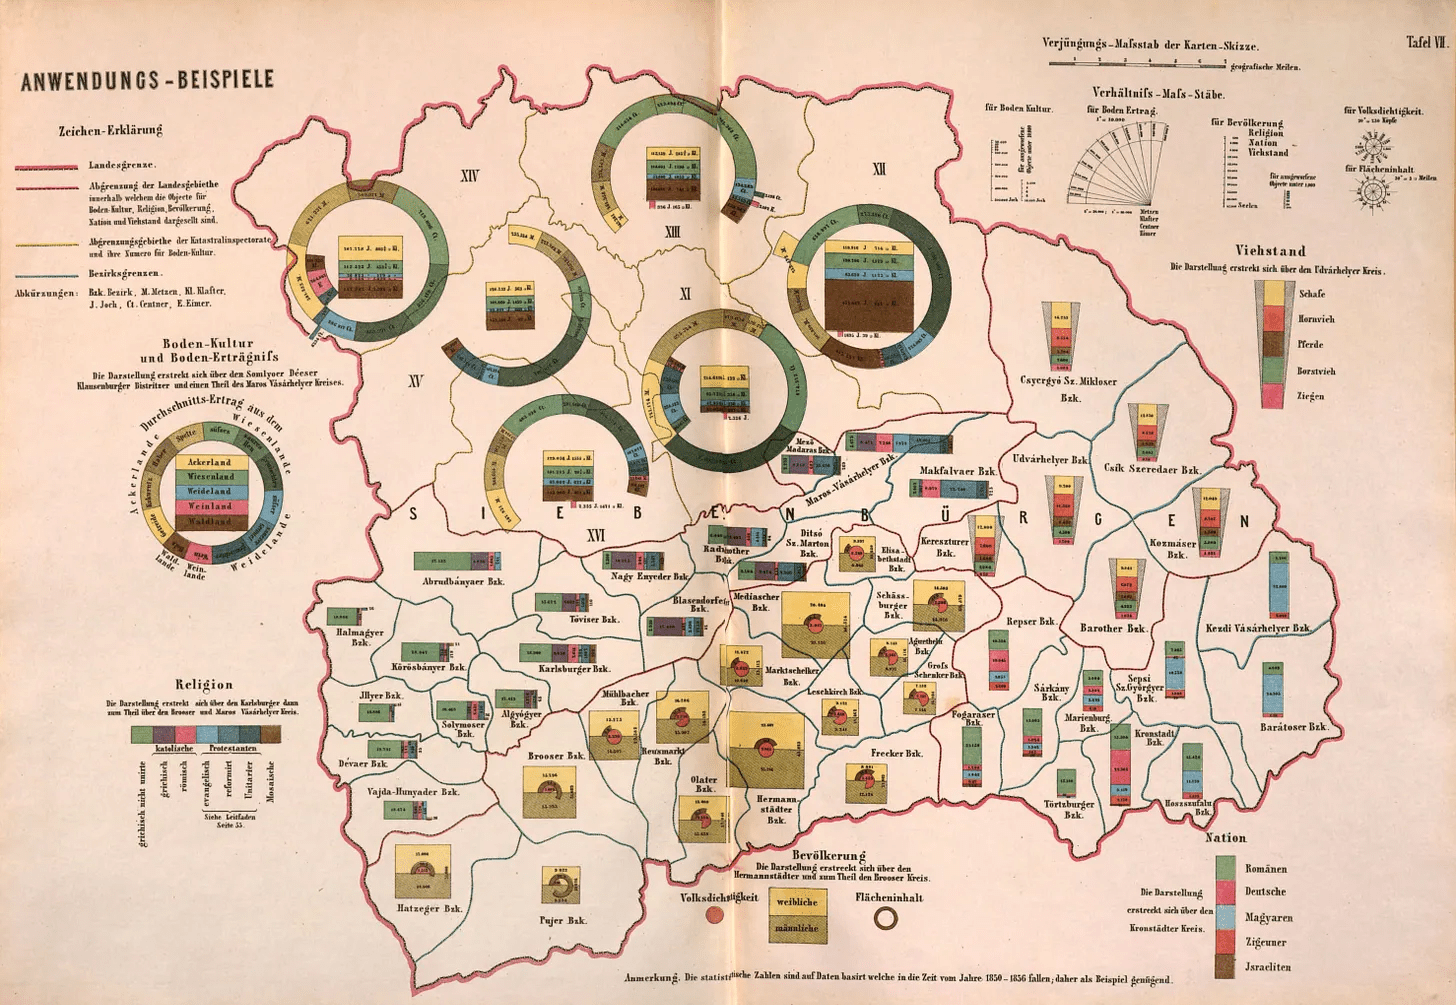
Wenzel Unschuld: Leitfaden zur darstellenden Statistik auf topographischen Karten
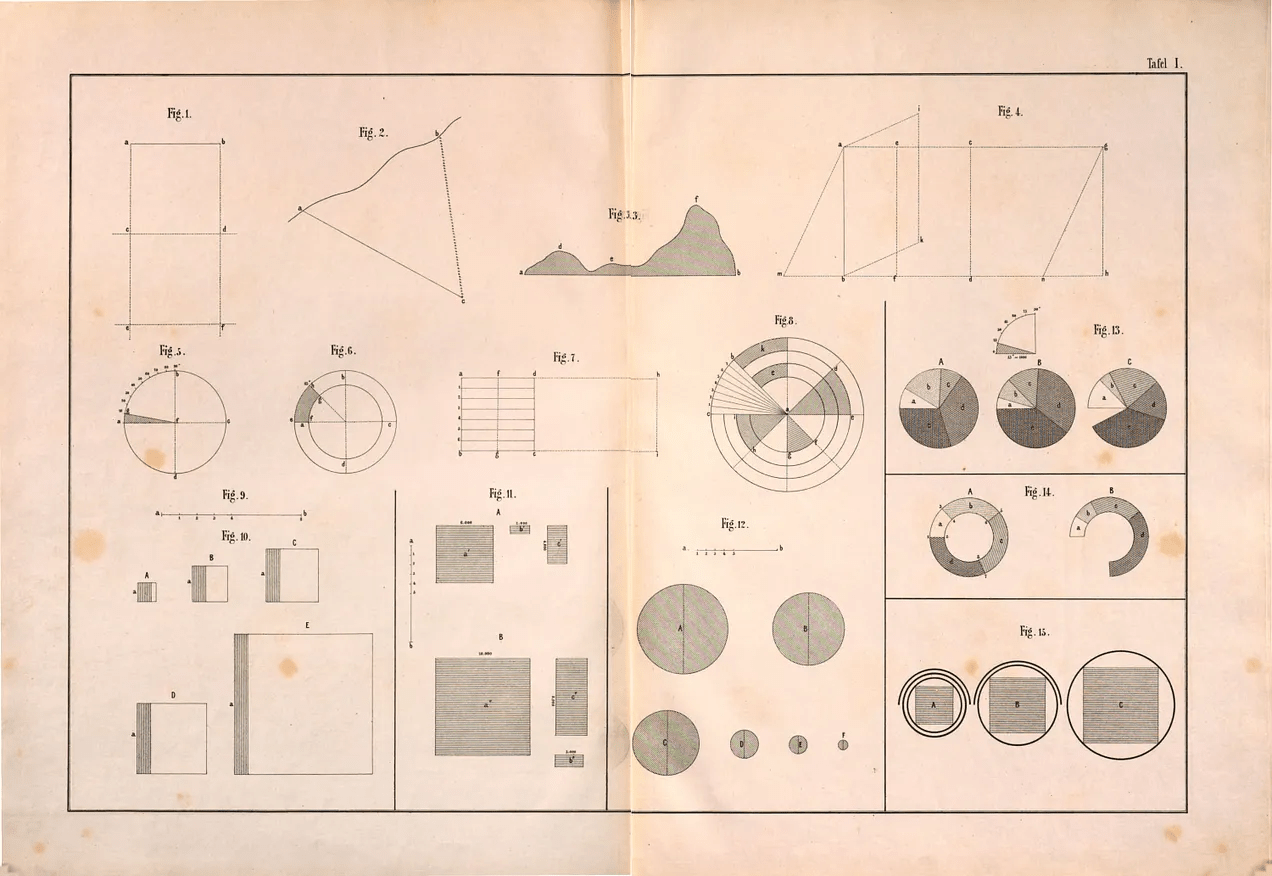
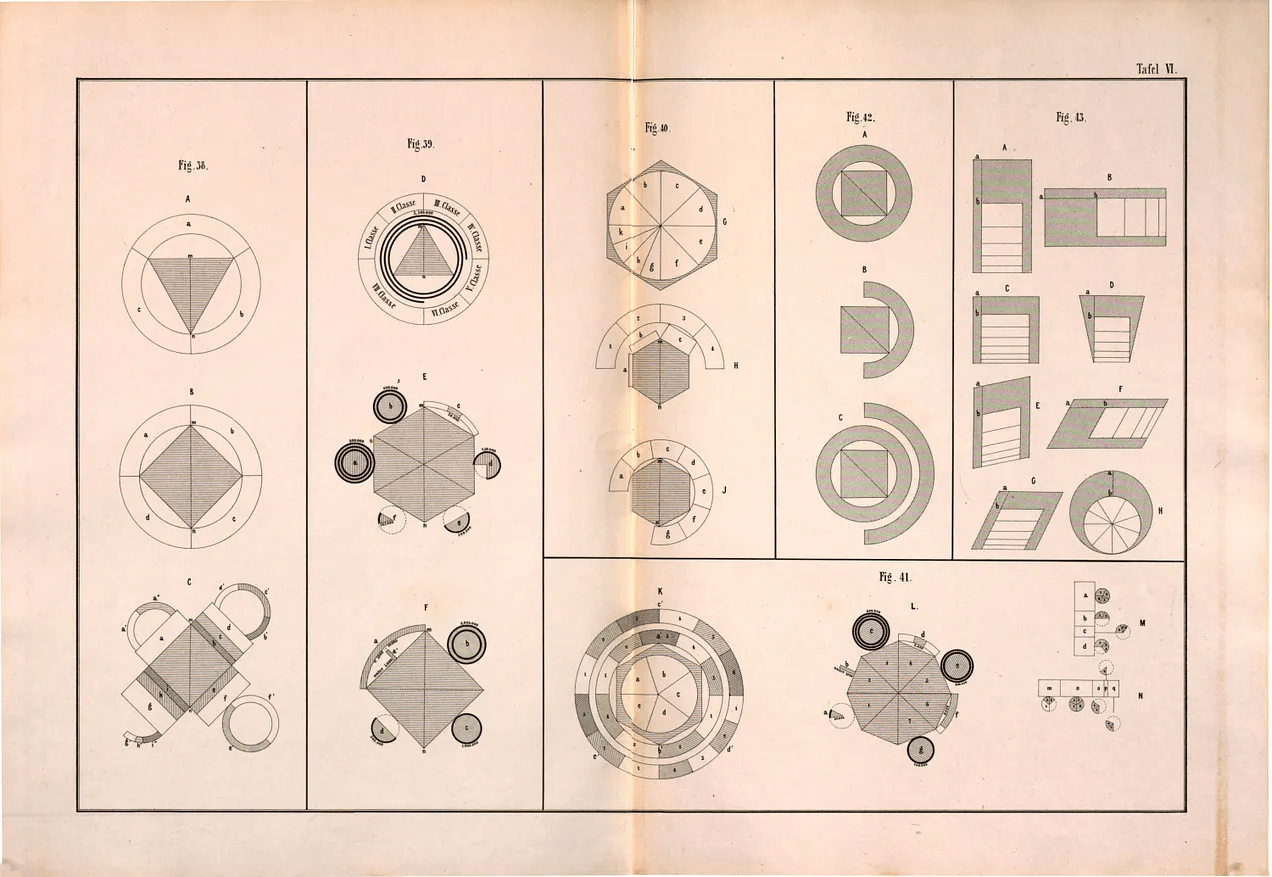
Source: Austrian National Library
Uknown: Marriage statistics, Új Idök, 1899
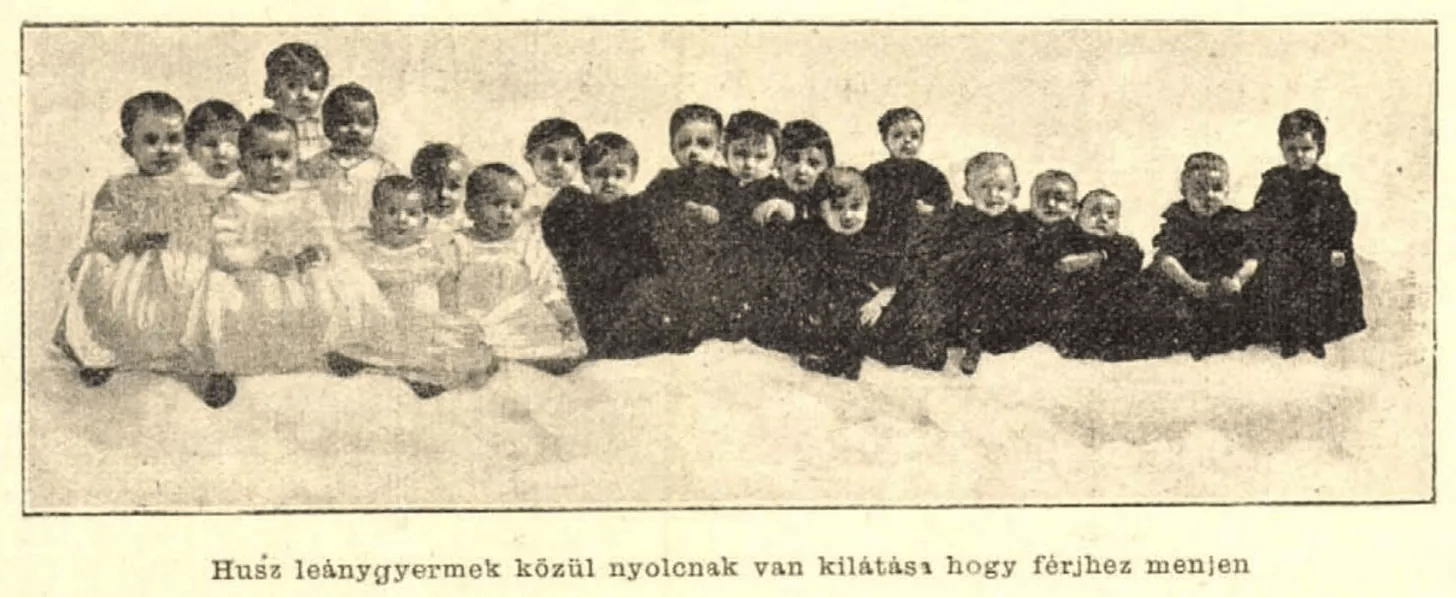
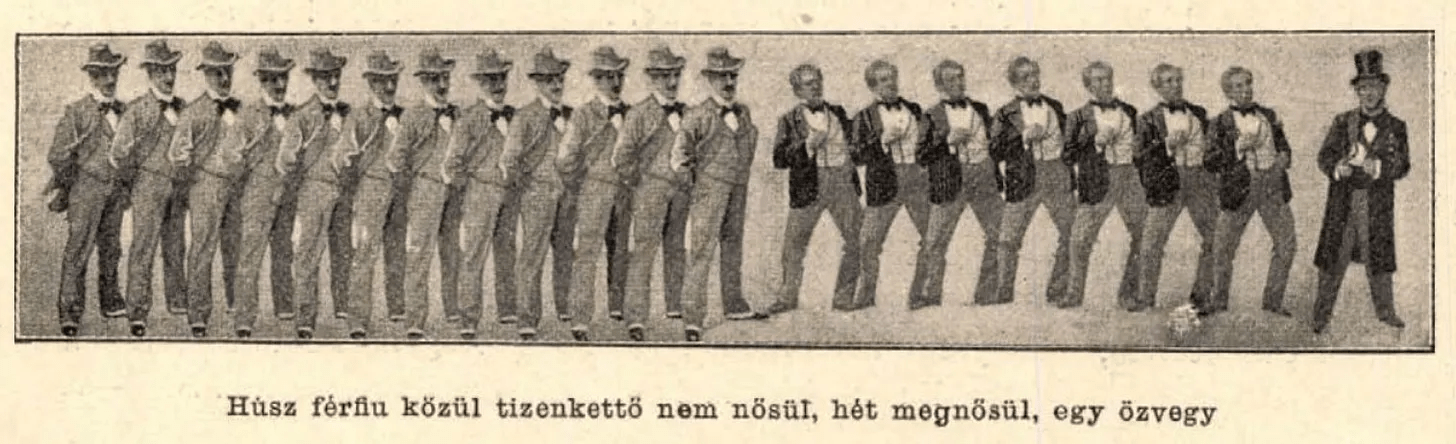
Source: Arcanum Scientific Digital Archive
Source: own collection
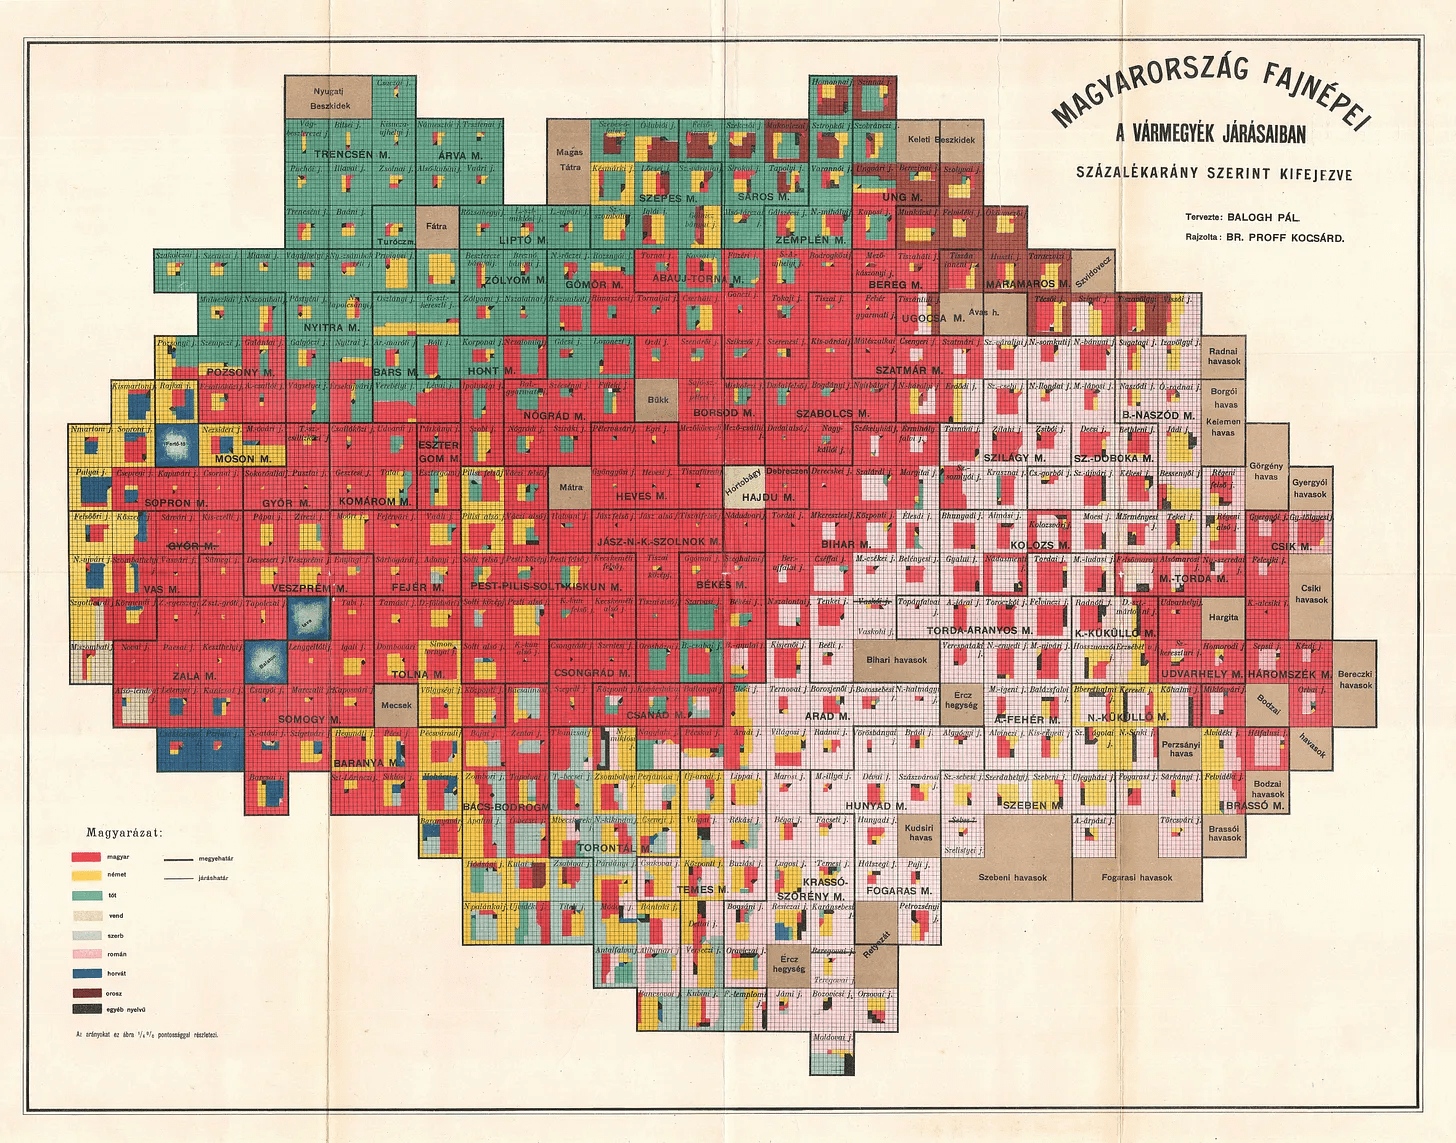
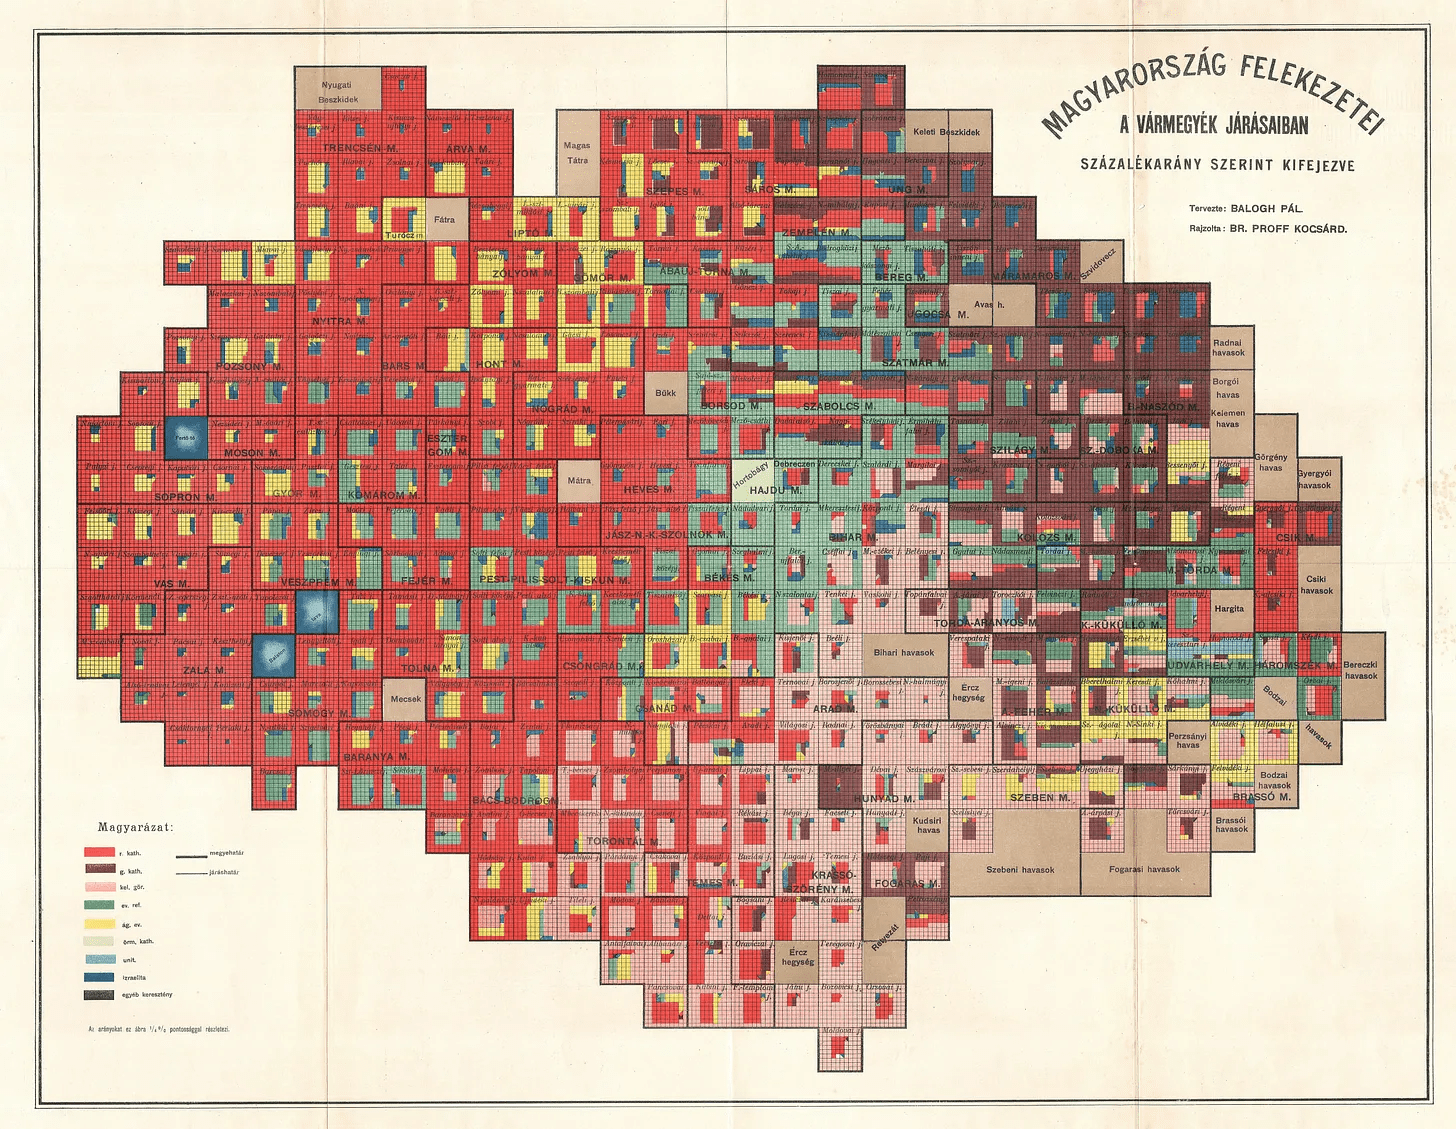
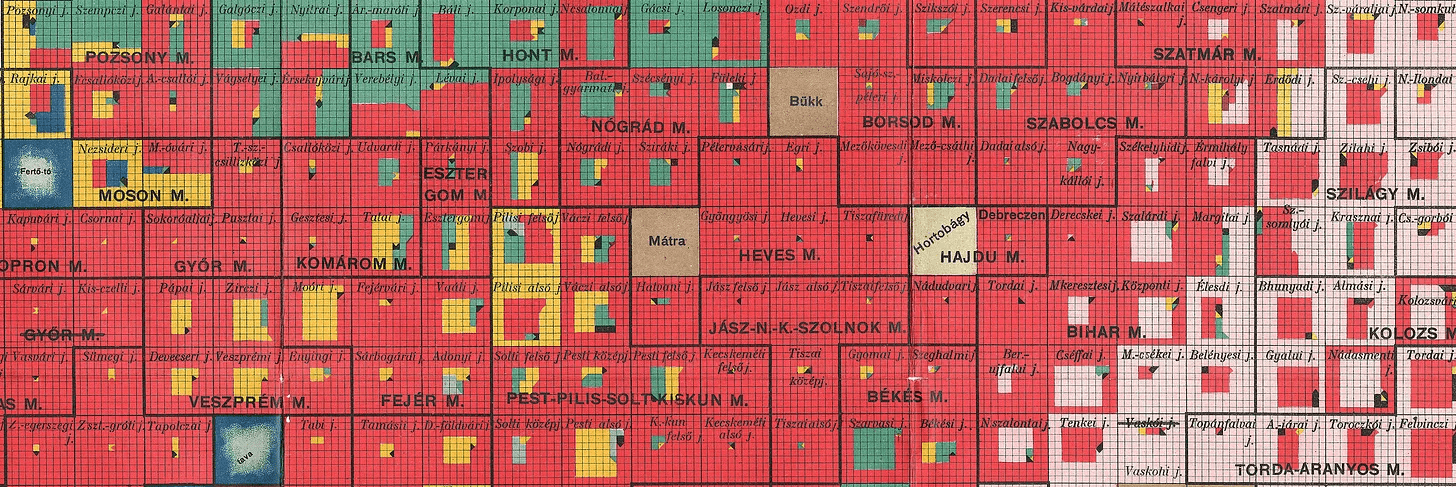
Pál Balogh, Kocsárd Proff: Magyarország fajnépei (The ethnicities of Hungary), 1902
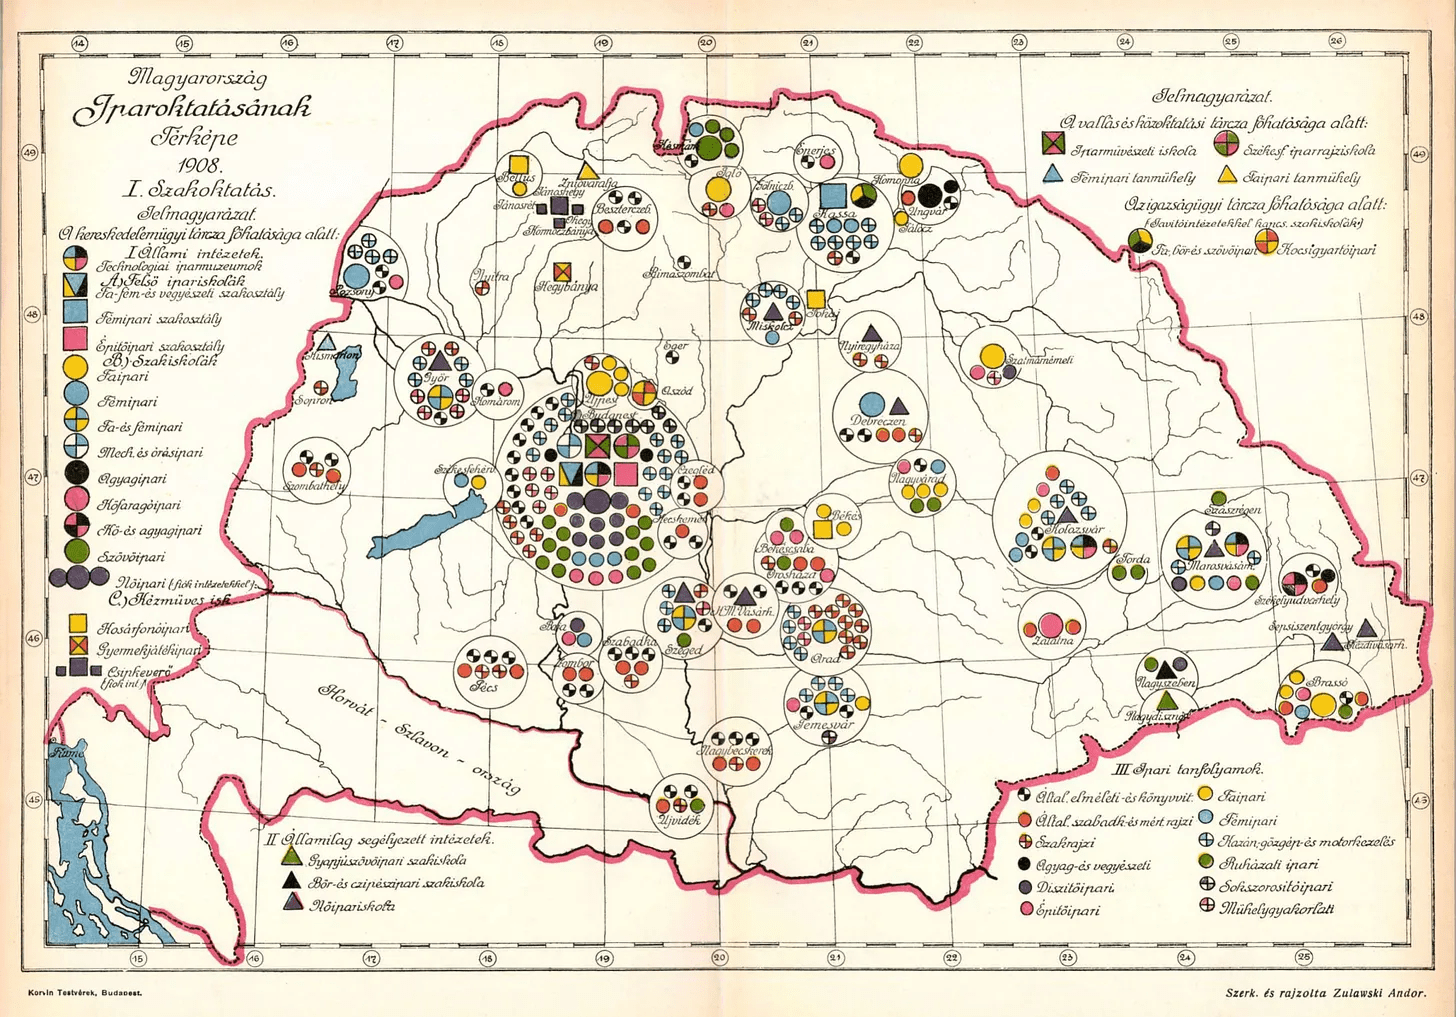
Andor Zulawski: Map of Hungary's industrial education institutions, 1909
Source: Arcanum Digital Library
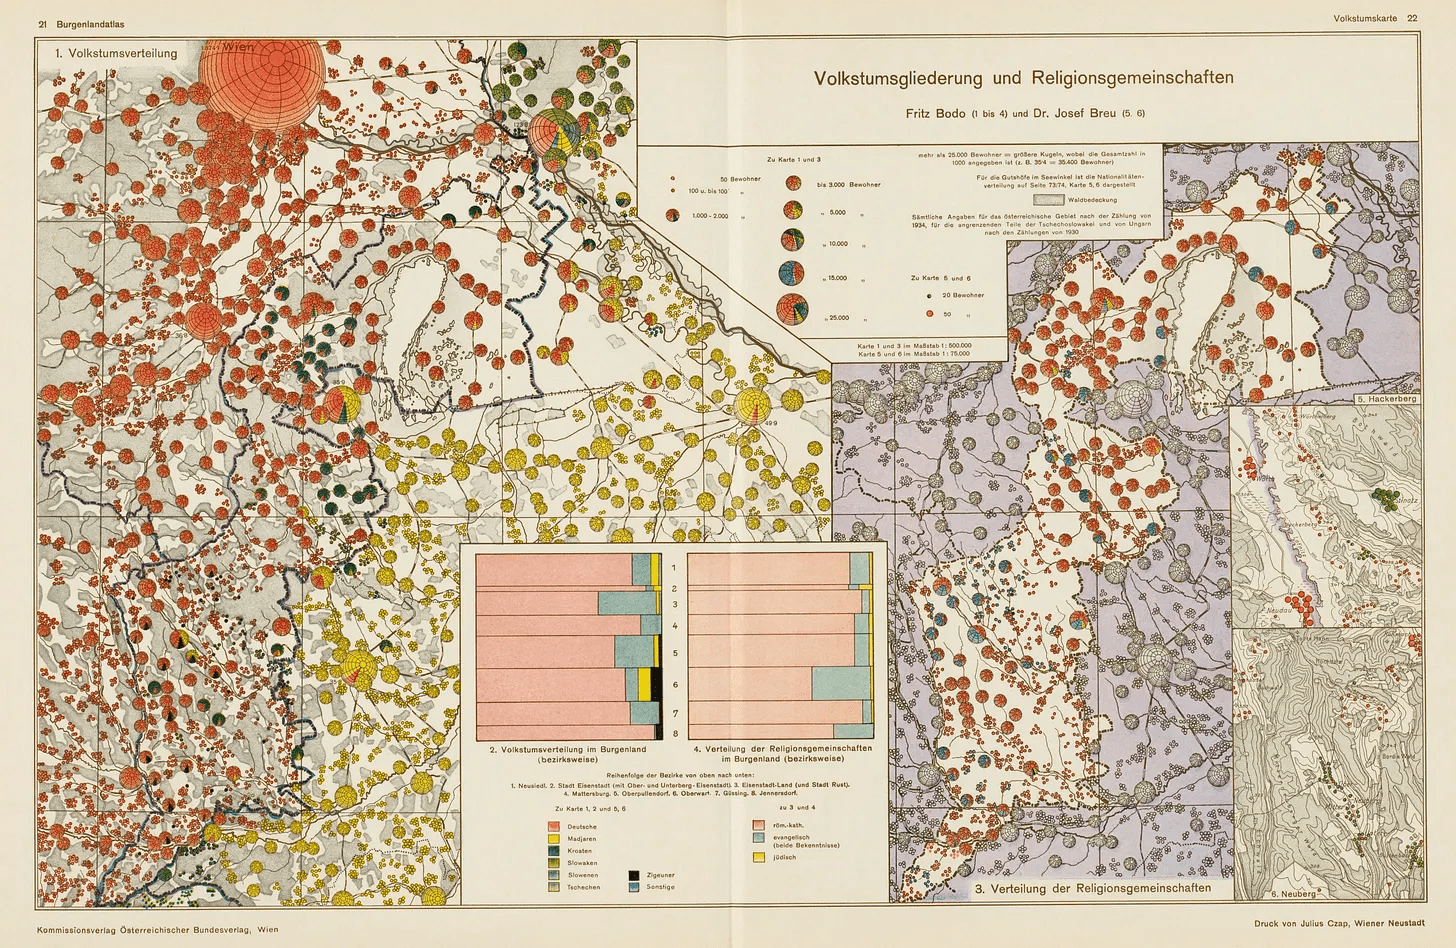
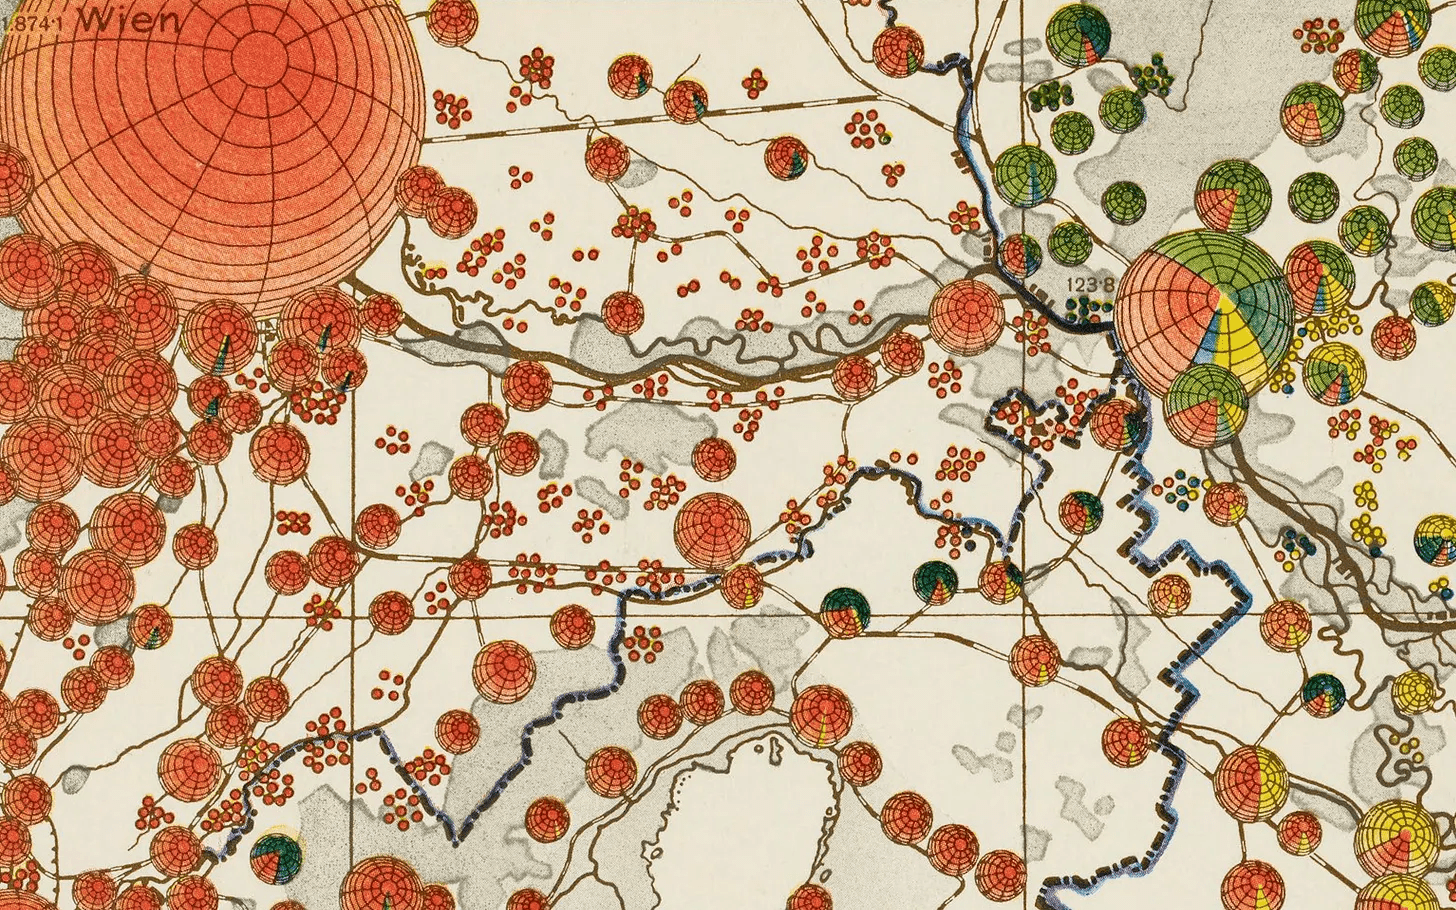
Fritz Bodo, Hugo Hassinger: Burgenlandatlas, 1941
Source: David Rumsey Map Collection
The first area chart, 1720 (unpublished)
Johann Wilhelm Wagner: Gewitter-Anmerkung zu Berlin, März 1720
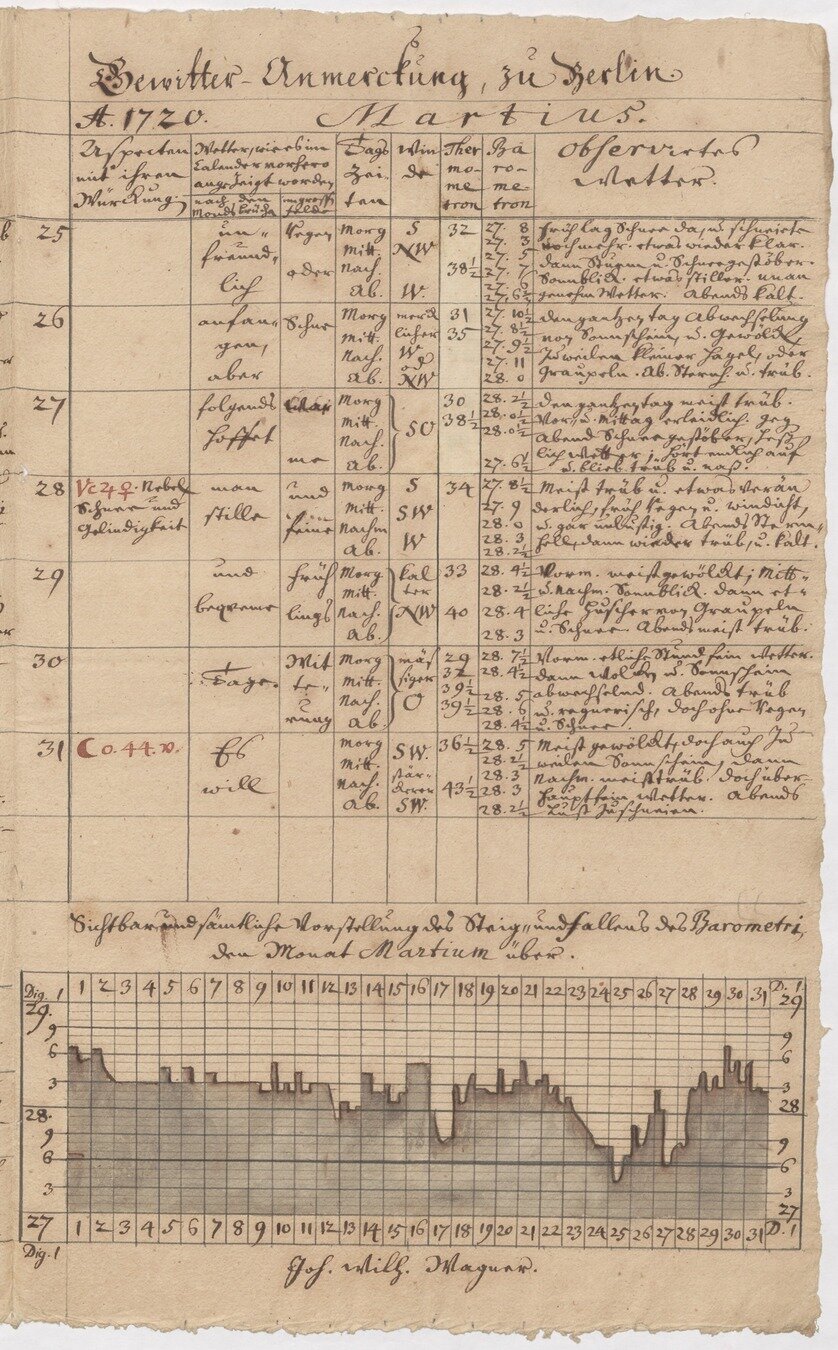
Source: Scientific Academy of Brandenburg
interesting ideas and solutions
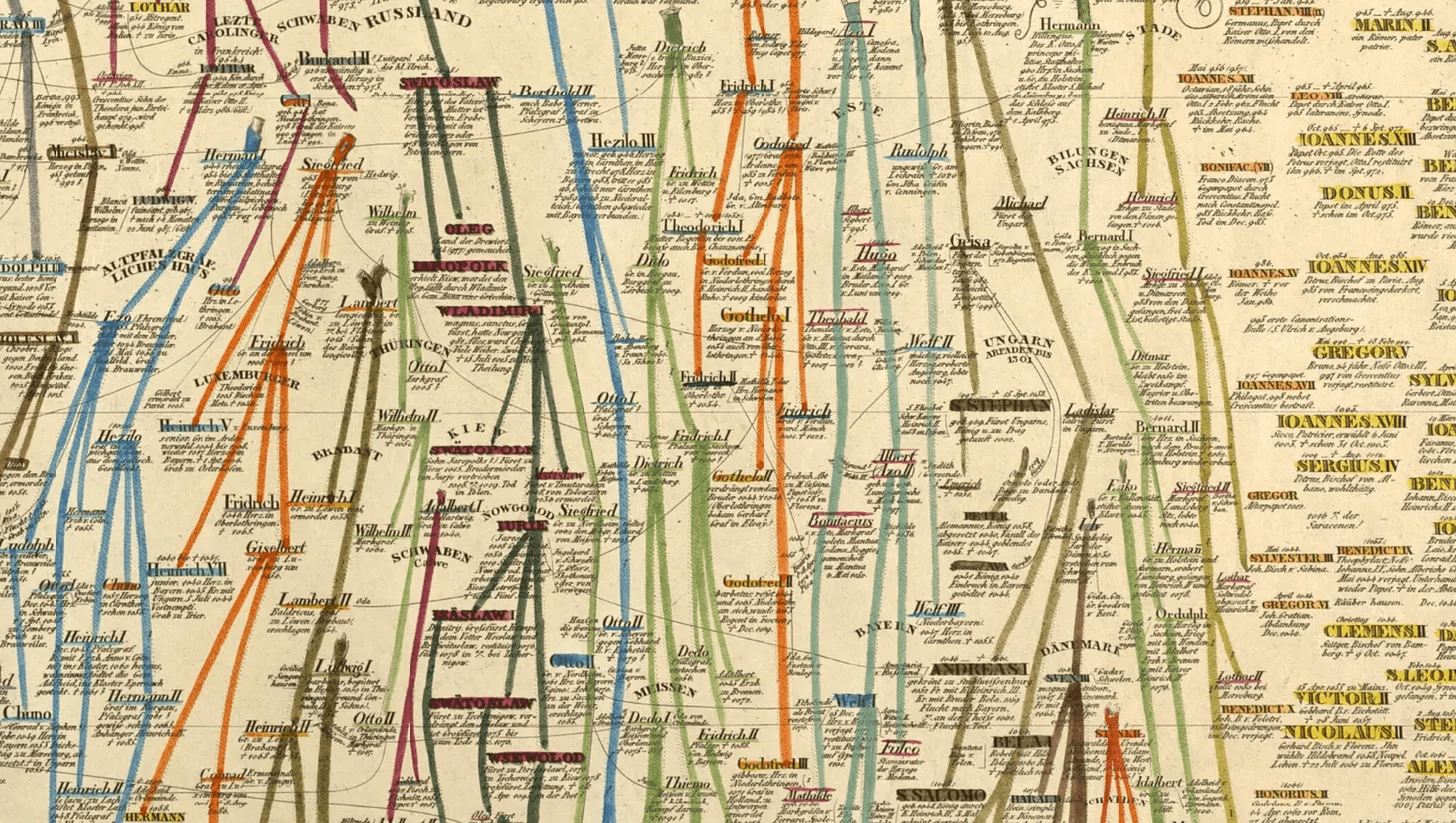
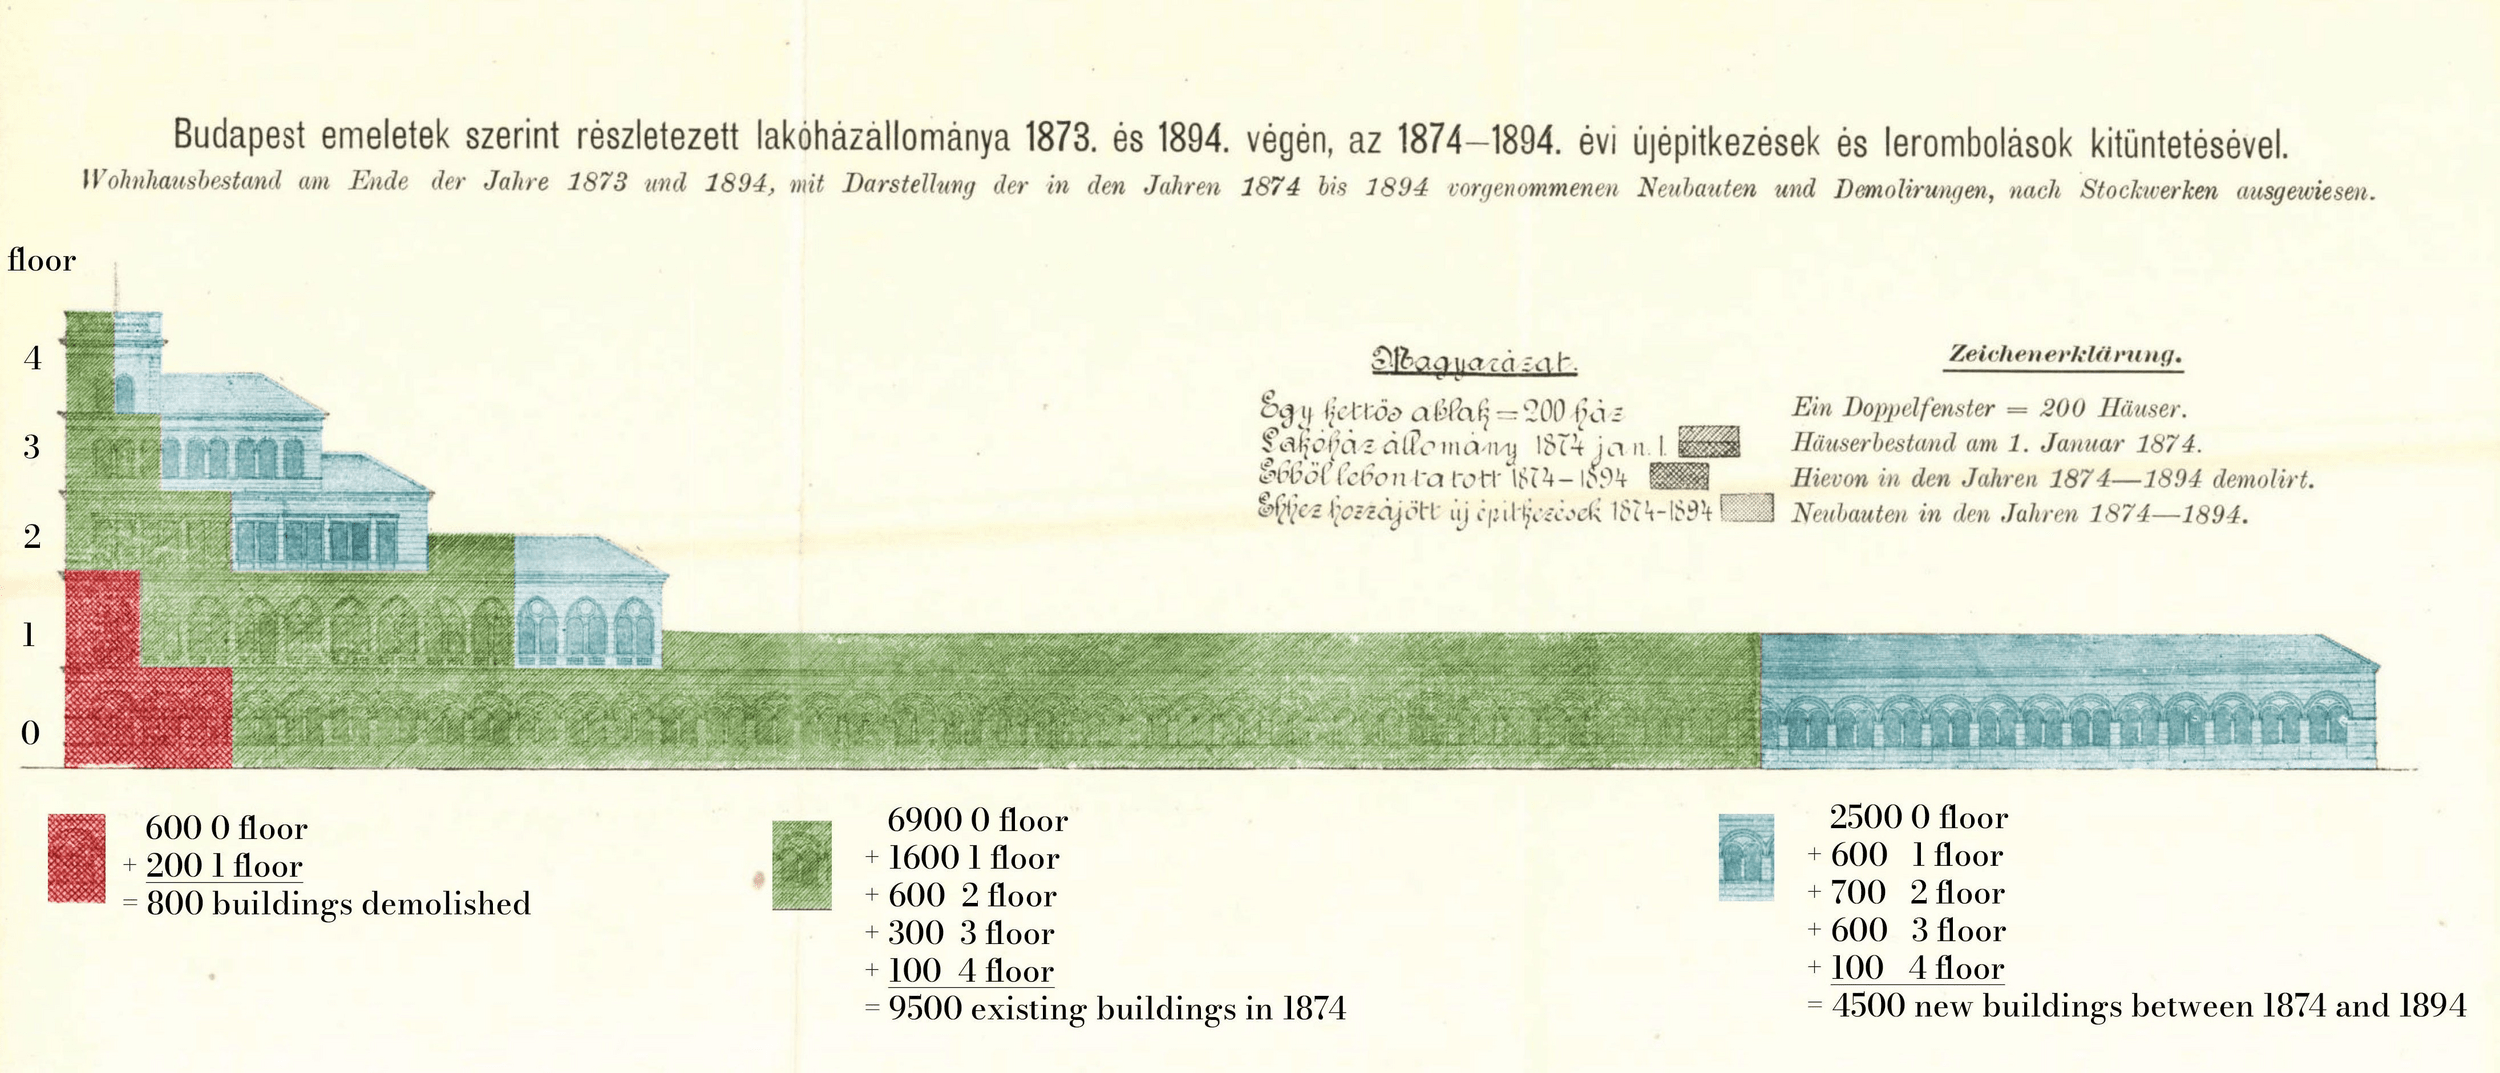
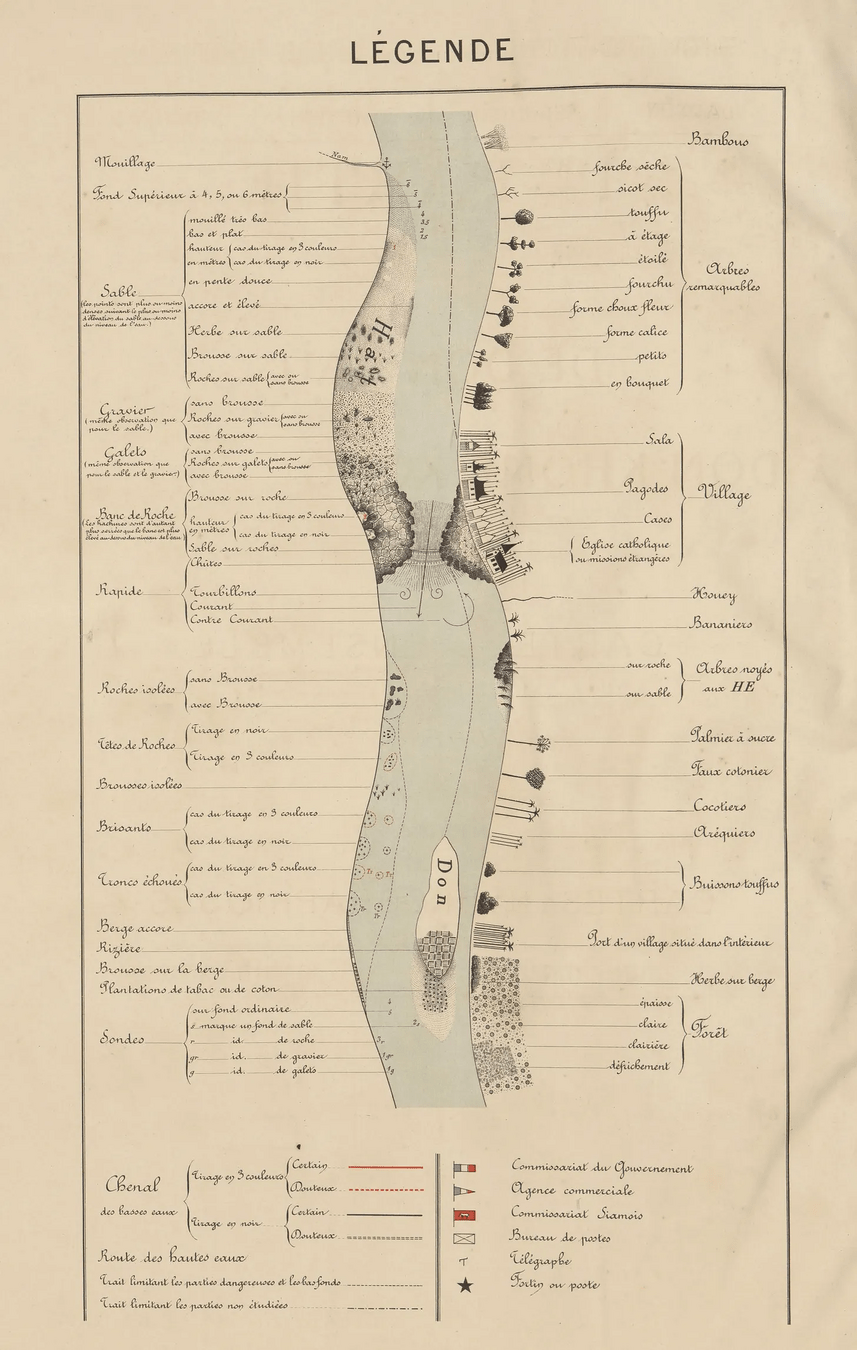
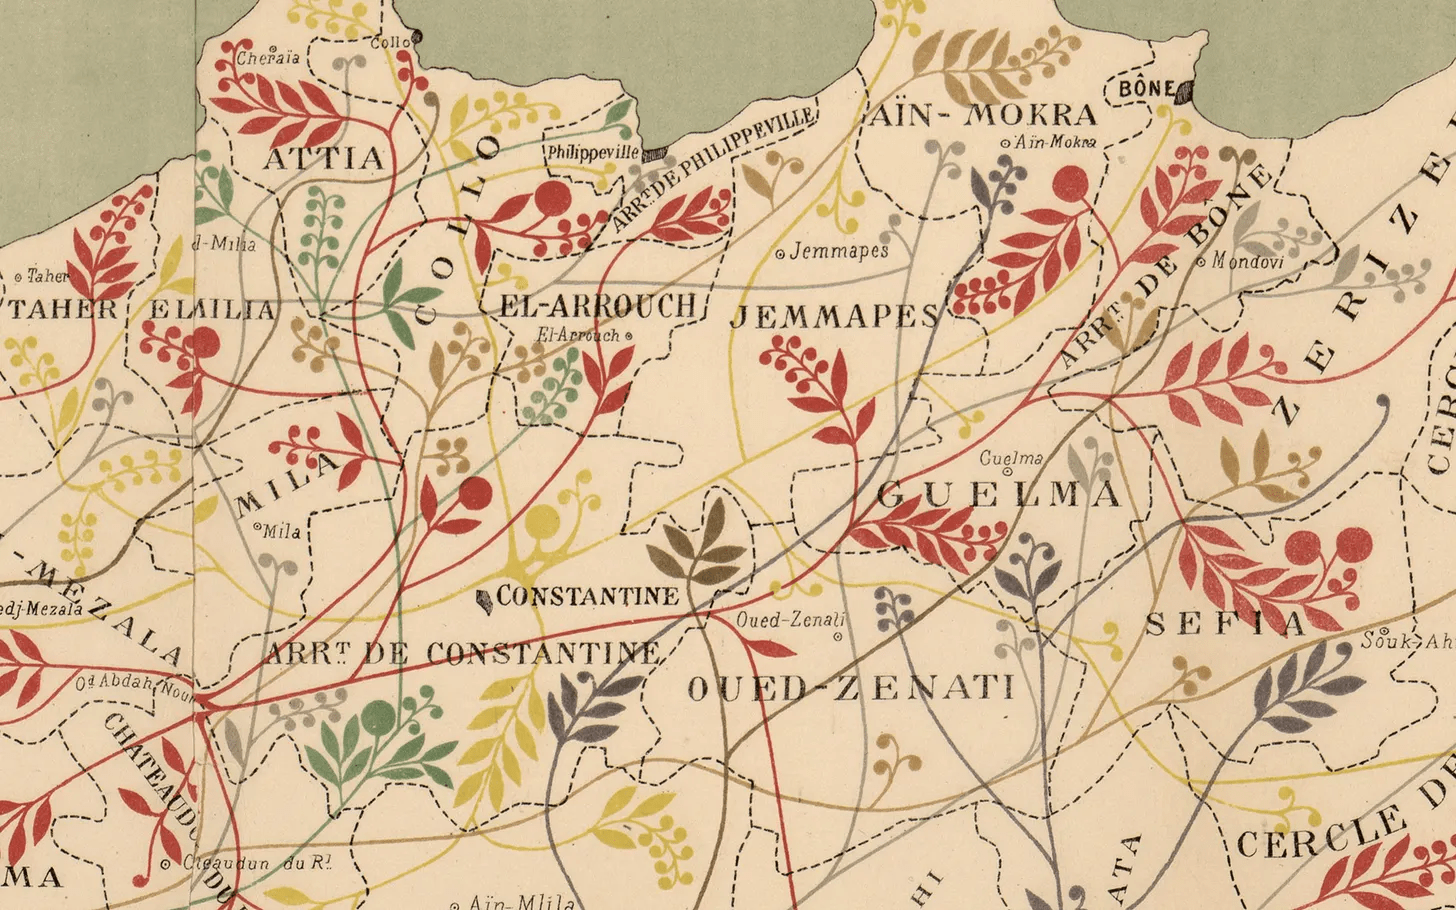
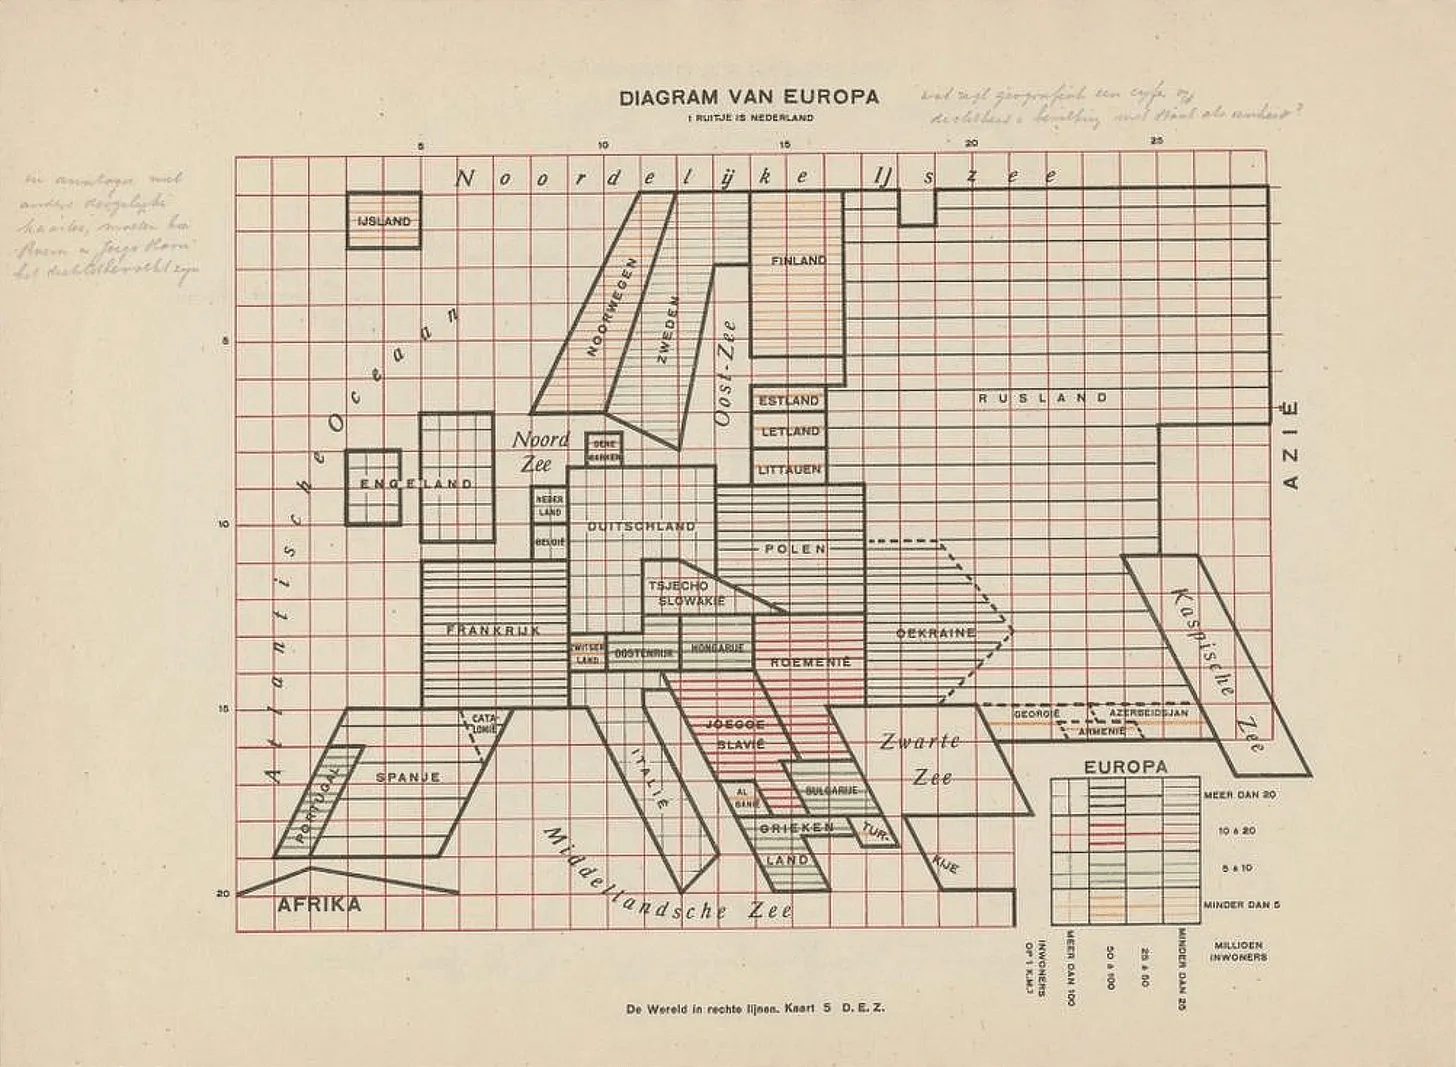
stories
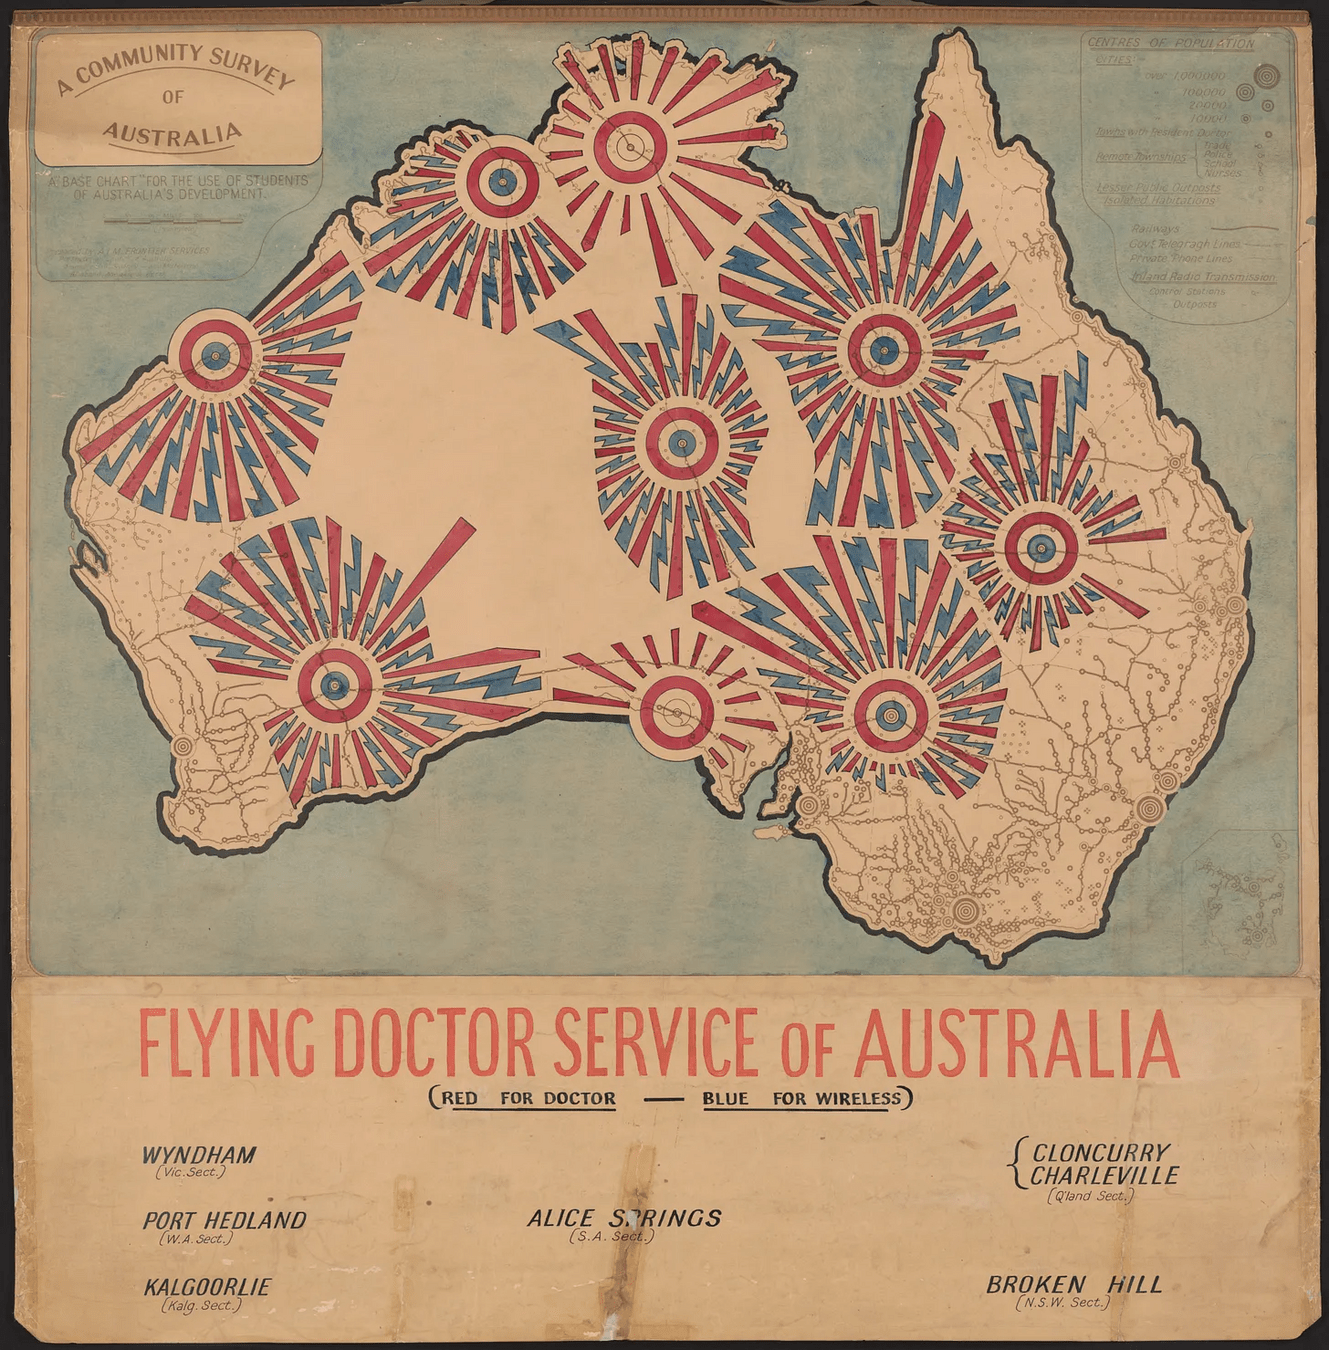
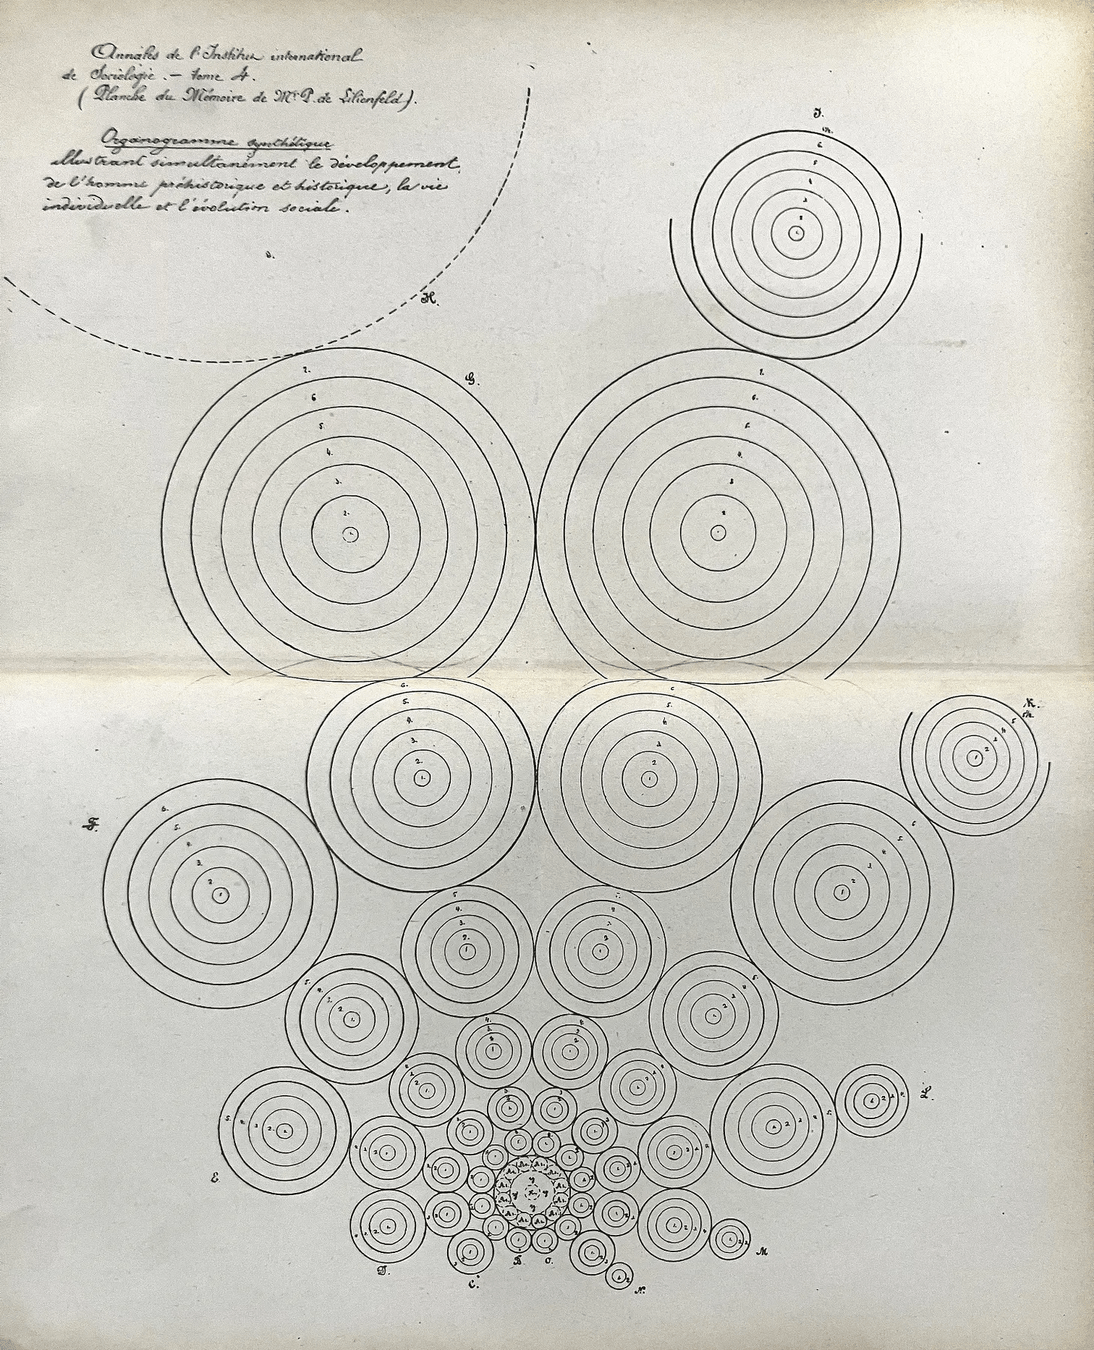
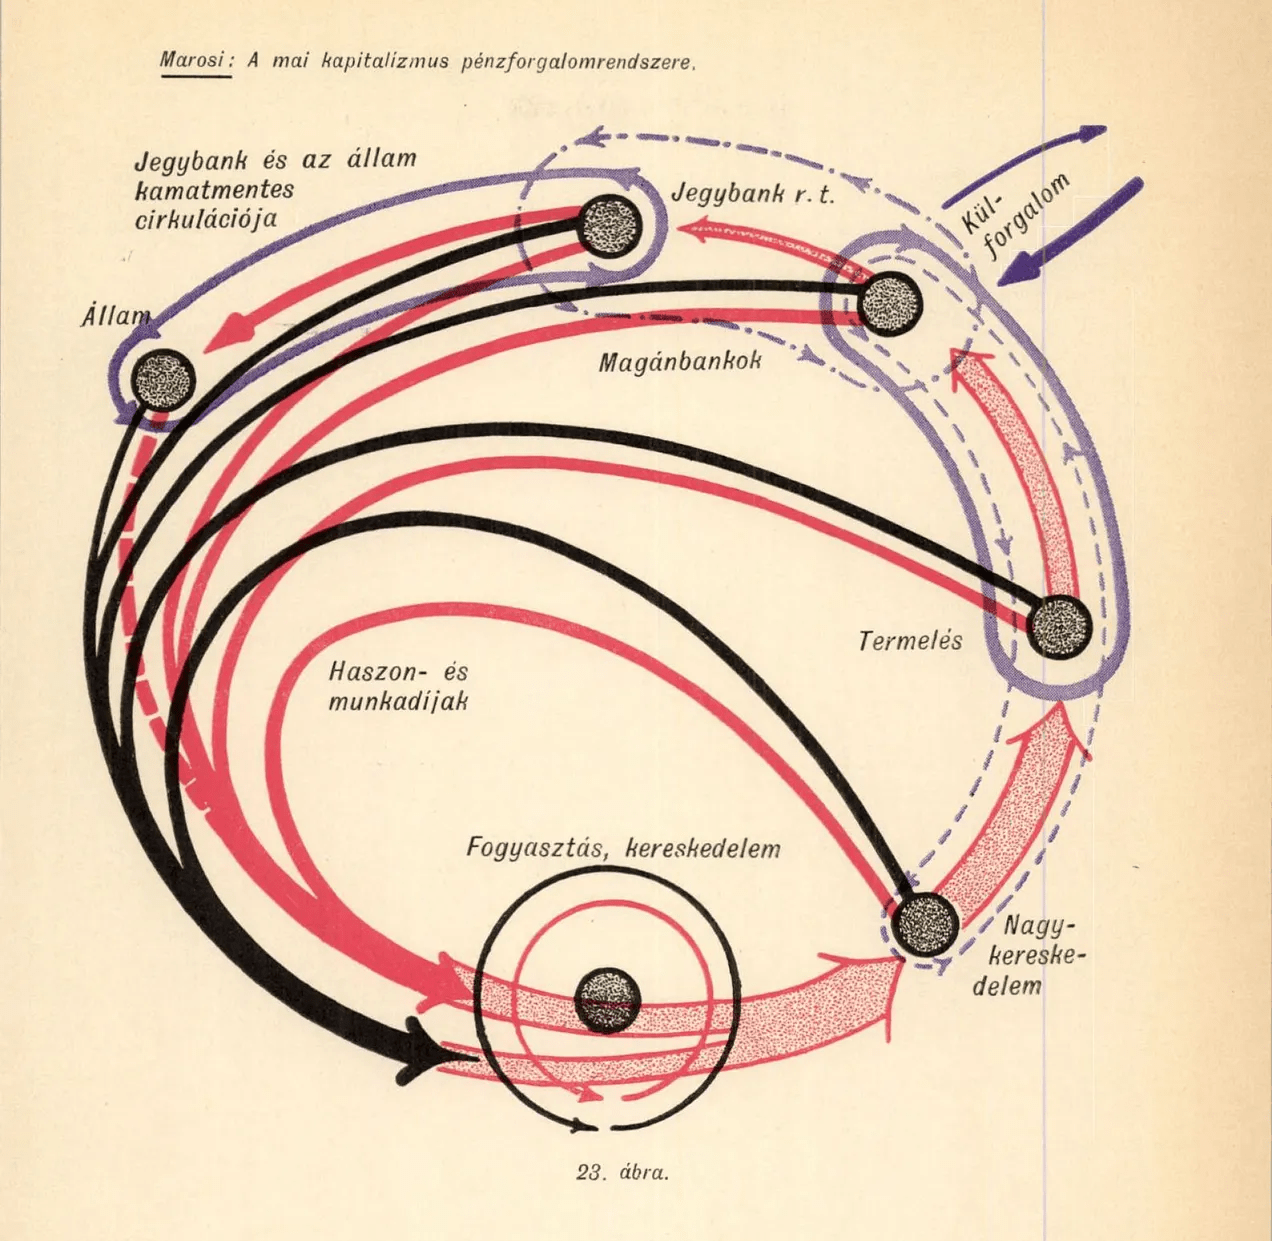
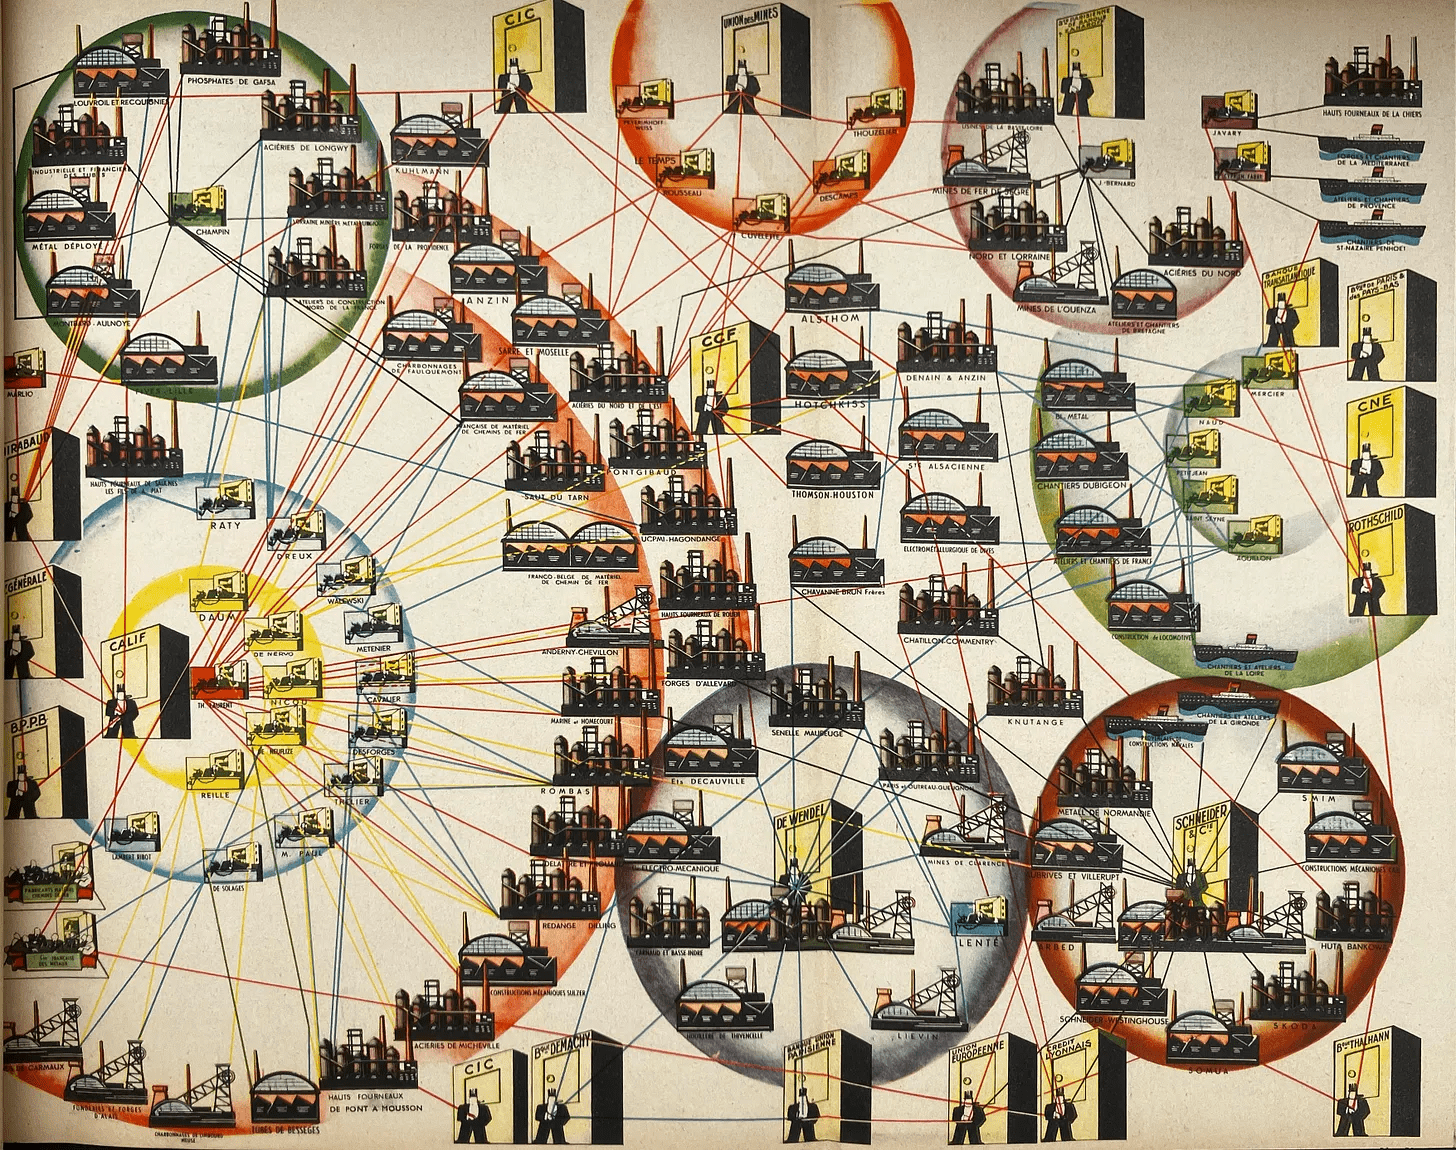
interviews

collections
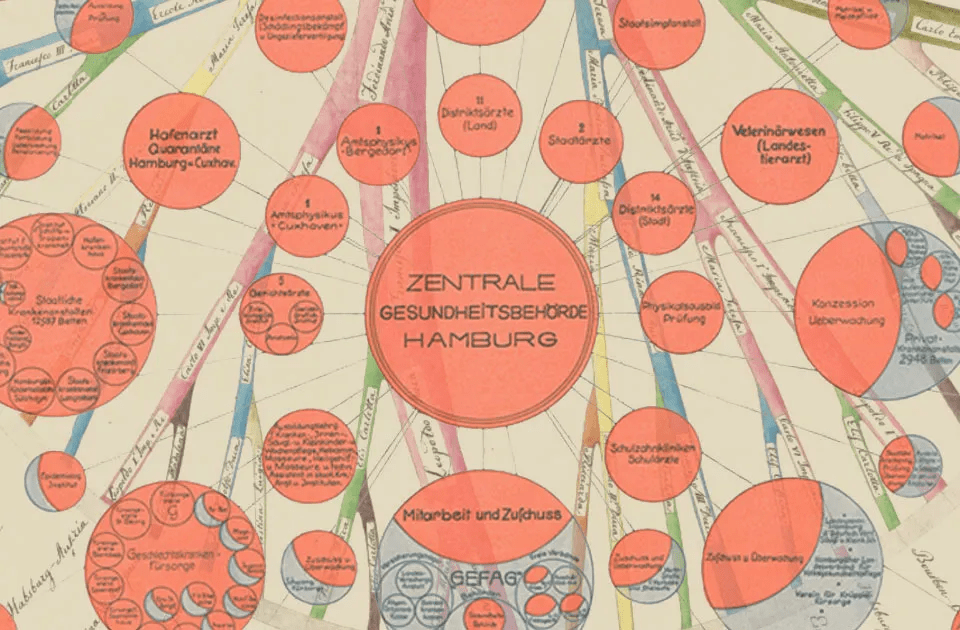
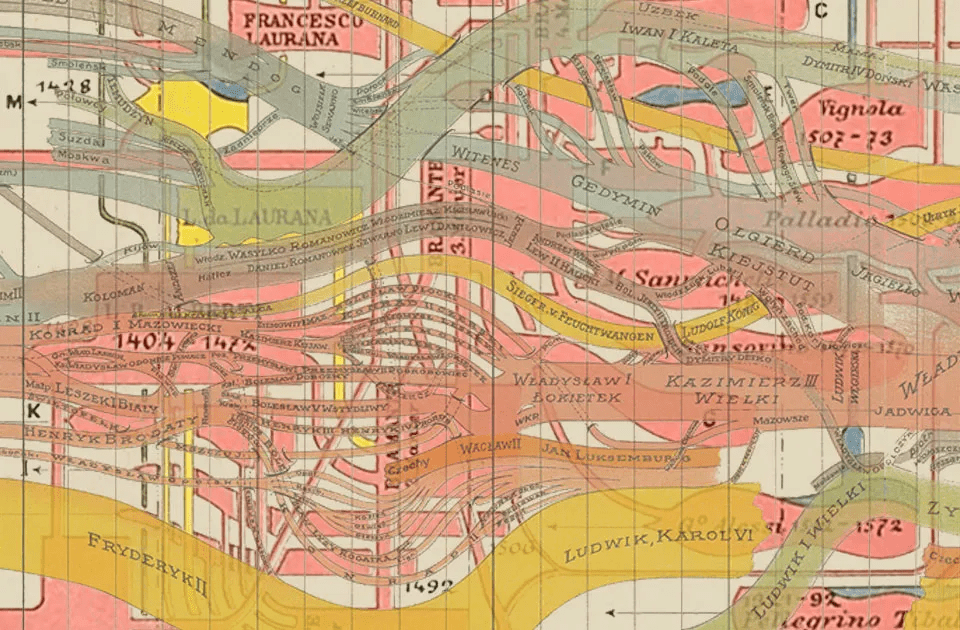
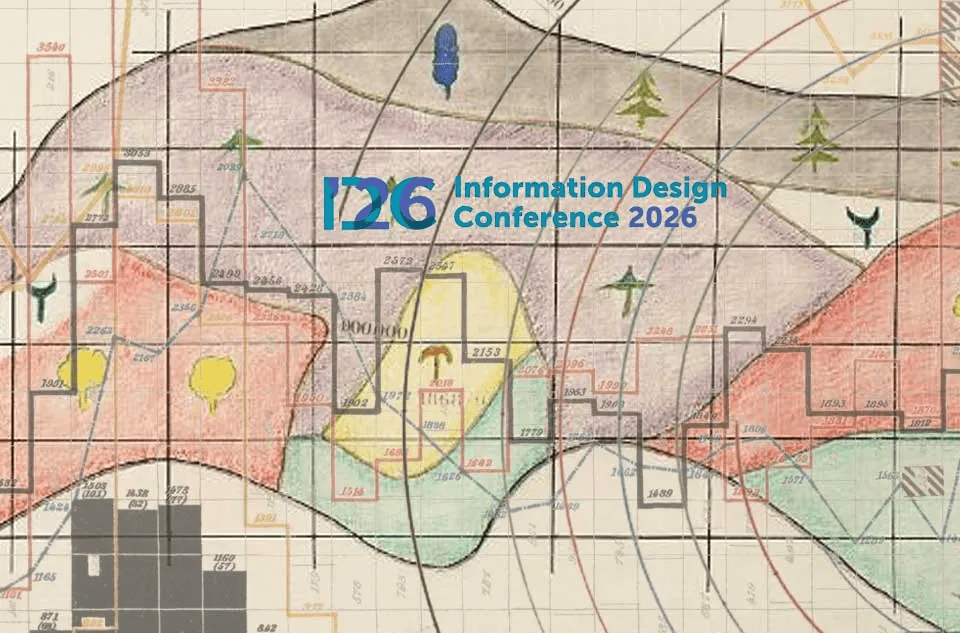
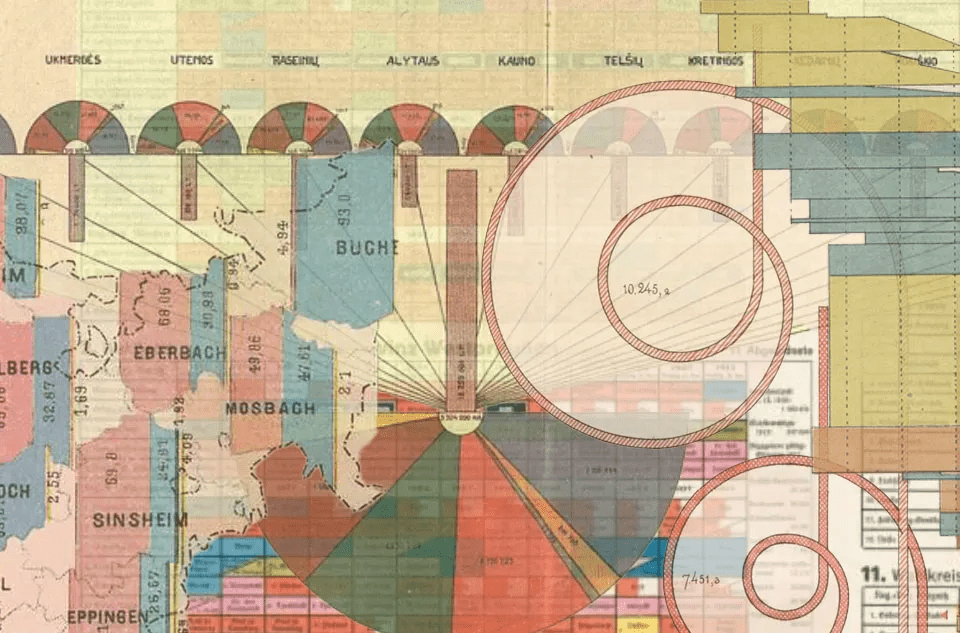
results
- 63 posts
- 1190 subscribers
- 58000 views (900 avg.)
- 45+ countries covered
- 40+ references
- ca. 650 unique images published (according to Gemini)
shortcomings
- the entire Africa is missing
- large parts of Asia and Latin-America are missing
- women are missing
- indigenous practices are missing
- contributors are missing
obstacles
- language barriers
Many times simple mirror translations of English words do not work
Language usage and writing style change over time
- inequalities in digitization
In many countries and regions, the level of digitization is low, primarily due to financial and political
reasons. This leads to inequality in researchability and representation.
- inequalities in accessibility
Many countries—and an increasing number of them—treat even cultural heritage that is in the public domain as
a commodity. Many institutions place their high-quality digitized images behind paywalls, or outsource the sale
to for-profit companies.
- sloppy digitization
In many cases, it is clearly evident that preservation focuses primarily on the textual heritage. The visual content
of publications is either not unfolded, is cut in half, or is simply omitted.
local researchers
and projects
new ways of storytelling
Do we need to rewrite entirely the history of visual communication of data?
No.
We need to make some corrections and adjustments in the narrative.
CENTER
PERIPHERY
West
academia
science
capital
ideal
central admin.
colonizer
Others
media
laymen
countryside
colonized
local
strange
innovation
more rules
standards
traditions
more freedom
less control
innovation
creativity
CENTER
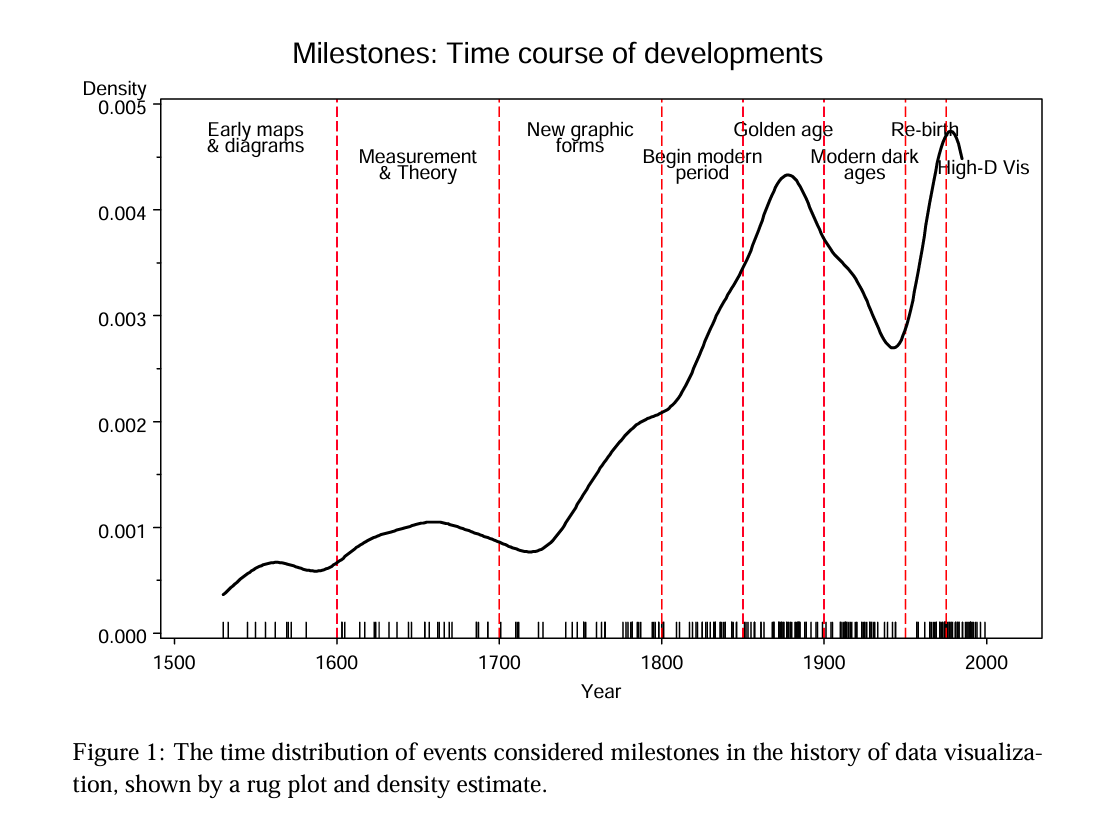
Source: Michael Friendly: A brief history of data visualization. In Chen-Hardle-Unwin eds. : Handbook of Data Visualization. 2008, pp. 15-56.
based on W.E. and US
and the Centers
Thank you!
batorfy.attila@gmail.com
attilabatorfy.bsky.social
www.linkedin.com/attila-bátorfy
attilabatorfy.com
On the shoulders of giants / IDC26
By Attila Bátorfy