Should we restimate
the MAC ploidy ?
Reminder
-
2xMIC nuclei (2n)
- total = 4n
- 1xMAC nucleus (up to 800n)
if we neglict the differences in genome size :
Ratio MIC/MAC ~ 1:200
P(MIC | Paramecium DNA ) = 4 / 804
In theory:
Note:
-
If \(p = 1/200 ^{(*)} \) :
- \(P(MAC retained | IES+) \approx 50\% \)
- \(P(MIC | IES+) \approx 50\% \)
- \(P(MIC | IES+)\) depends on the MIC/MAC ploidy ratio
\(\ ^{(*)} \) Quite low
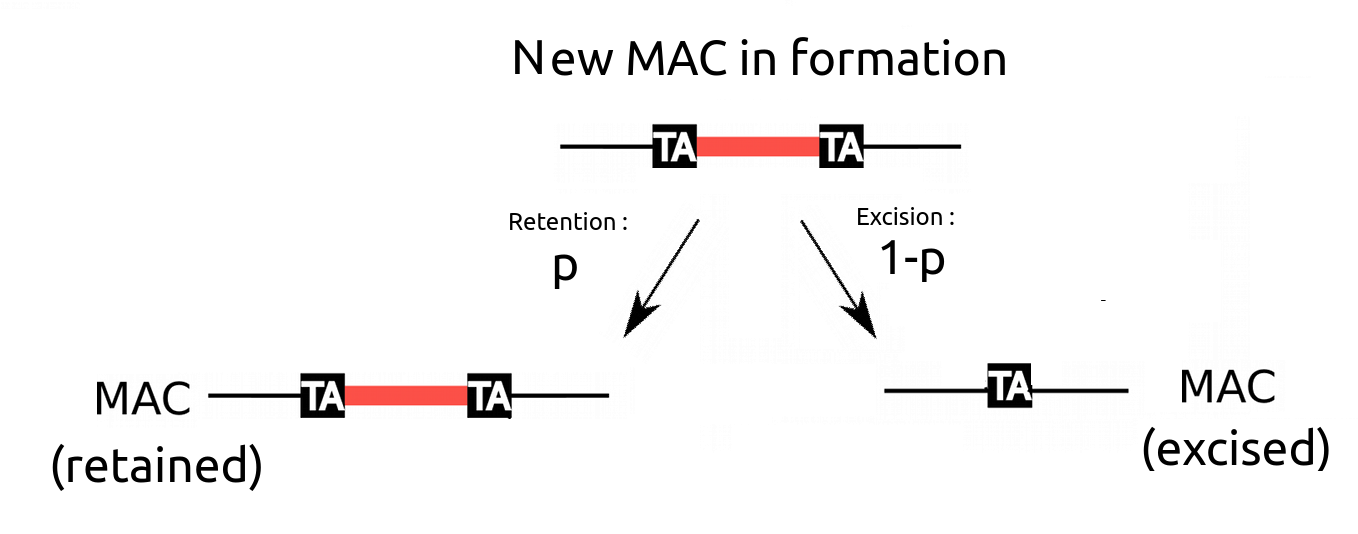
What brought us to the question of MIC/MAC ploidy ratio : The IES retention
MIC/MAC ploidy ratio: Experimental measure with NGS methods

Illumina sequencing
(total DNA)
Count the ratio of IES+ reads over the total for each bondary (left / right) of each IES
Expected 1:200 when there is no retention
Expected > 1:200 if retention
The higher the coverage, the better
Pooling of illumina
Thanks to O. Arnaiz and Eric's archeological efforts :
[ ... ]
+
+
+
+
Pooled together
> 1.000 X coverage
CTL WT
Manip 1
CTL WT
Manip 2
CTL WT
Manip 3
CTL WT
Manip 4
CTL WT
Manip
(Total DNA from WT cells)
Support left, support right, support MAC
by O. Arnaiz
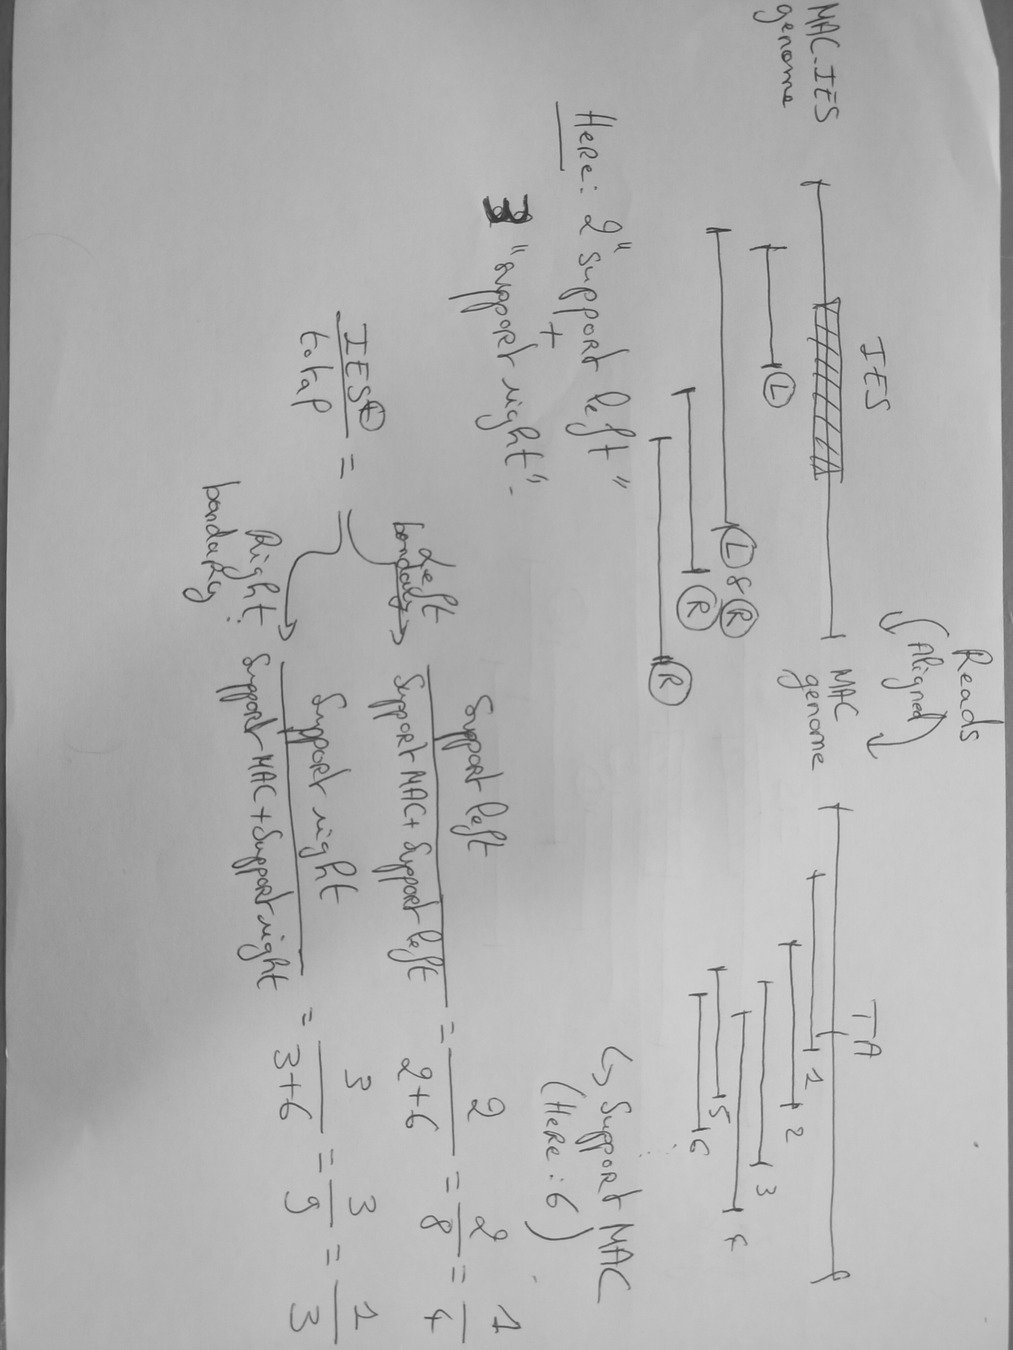
(L)eft and (R)ight bondary are considered separately
the "Support MAC" overlapping a TA are common to L&R

Application issue
- 1 illumina sequencing : Coverage ~ hundreds X
- pMIC = 4/804
- High fluctuation (0, 1, 2 reads...)
- Solution : Pool together several WT samples from total DNA to rise the \(Np\) count
Pooled coverage \(\ ^{(*)} \)
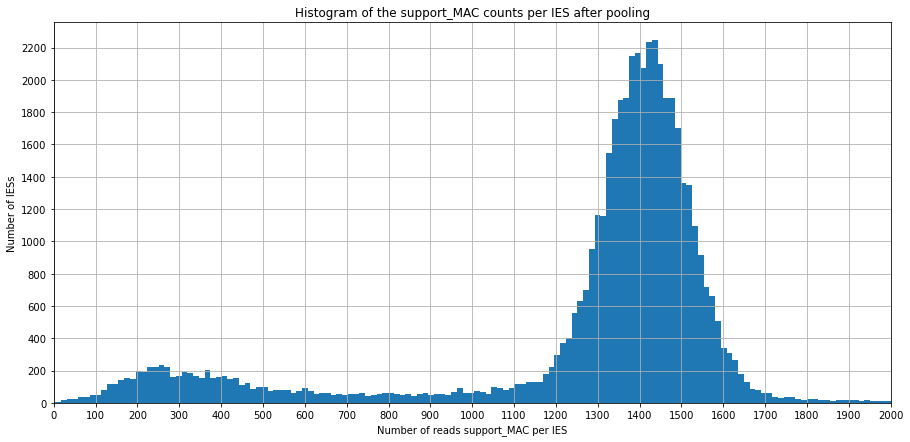
~ Variable MAC
(ploidy ratio unknown)
artifacts
(heavy tail truncated)
\(\ ^{(*)} \) The number of support_MAC reads is used as a proxy to have an approximate coverage, as it represents the vast majority of reads
Area of interest because the MIC/MAC ploidy ratio can be well estimated
A routine checking that went wrong
\(\ ^{(*)} \) The number of support_MAC reads is used as a proxy to have an approximate coverage, as it represents the vast majority of reads
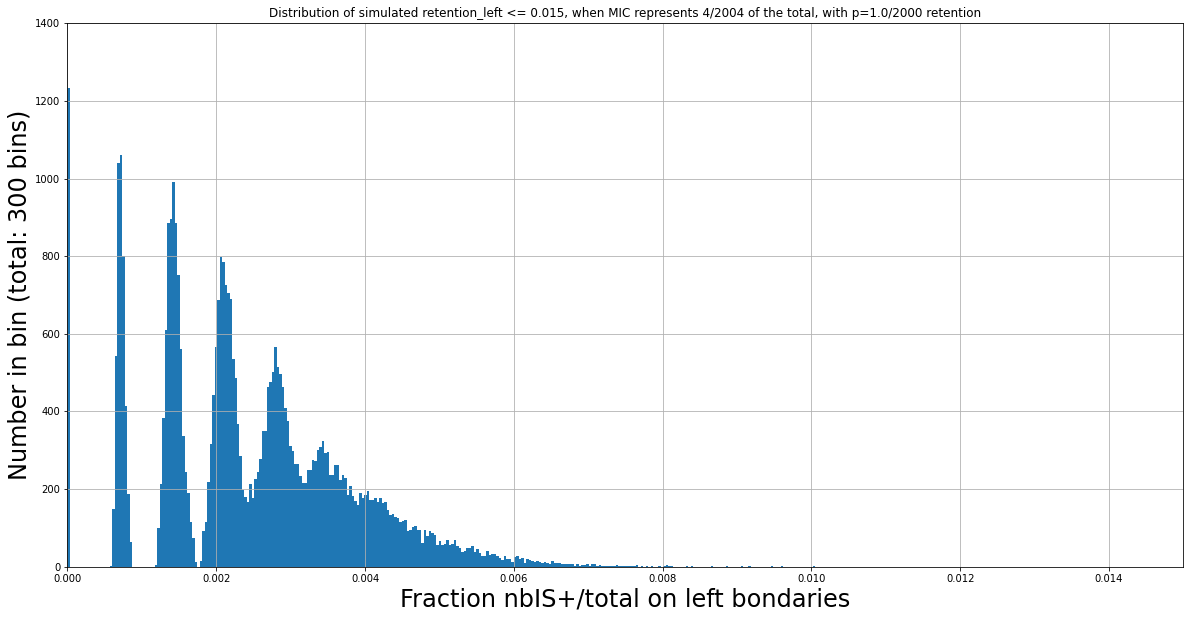
Do we have \( \frac{nbIES+}{total\ reads} > \frac{1}{200}\ ^{(*)} \ (0.005) \) here)?
No : \( \frac{nbIES+}{total\ reads} \approx 0.00368 \)
Reminder: Expected 1:200 when there is no retention
Expected > 1:200 if retention
\( \ ^{(*)} \) 4/804 \( \approx \) 1/200
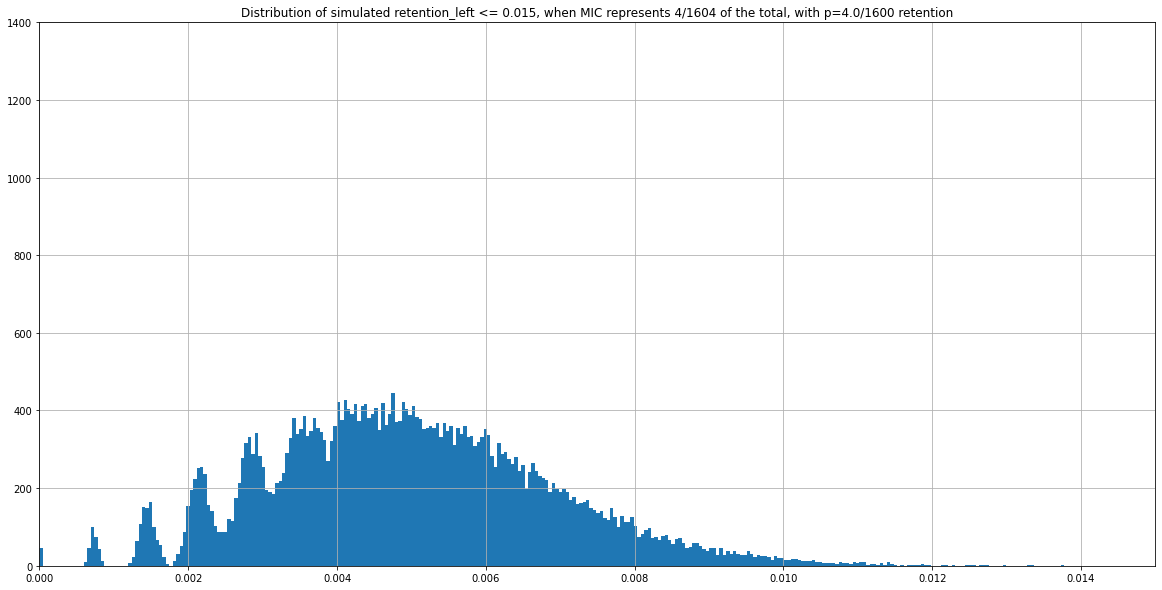
(Zoomed) Expected distribution of \(\frac{nbIES+}{total\ reads} \) with Monte Carlo simulation, when P(MIC) = 4/804
If we consider
- This range of coverage
- p(MIC) = 4/804
- retention = 0%
... Then we should expect :
Theory : 0.005 if no retention, more if retention

(Zoomed) Experimental distribution of \( \frac{nbIES+}{total\ reads} \)
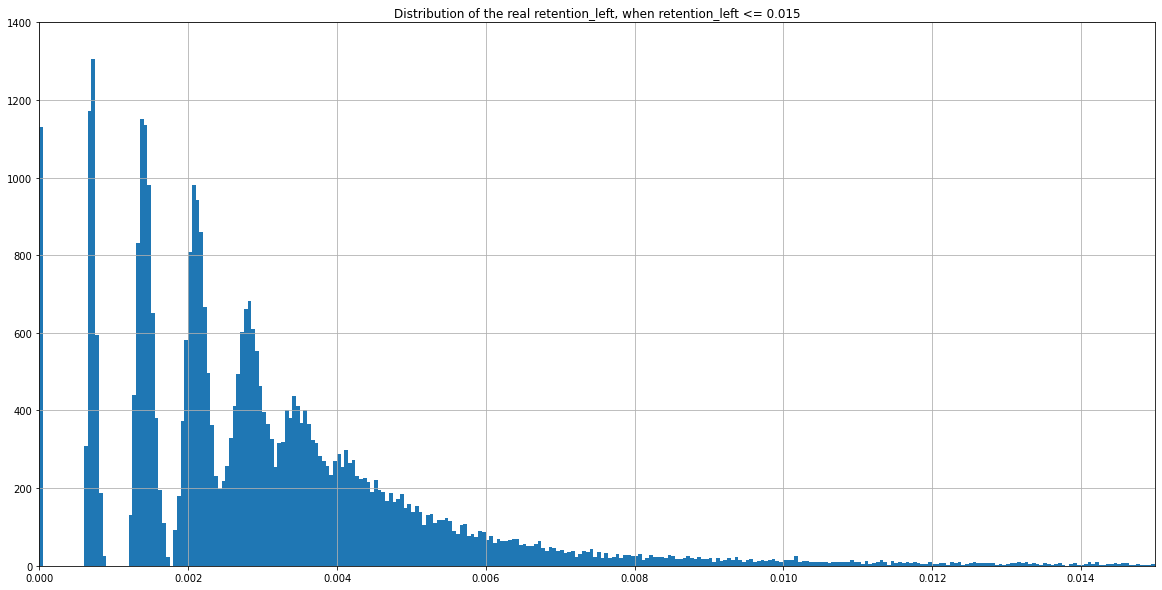
Theory : 0.005 if no retention, more if retention
Experimental distribution of \( \frac{nbIES+}{total\ reads} \)

Need to zoom to see the details...
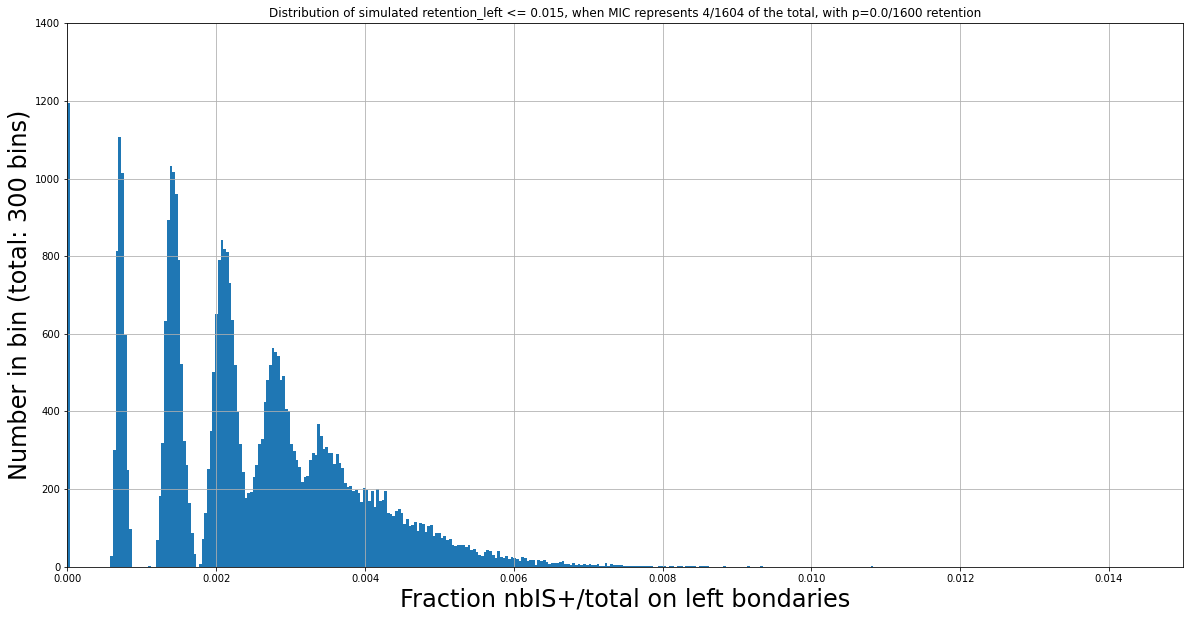
(Zoomed) Expected distribution of \(\frac{nbIES+}{total\ reads} \) with Monte Carlo simulation, when P(MIC) = 4/1604

mean : 0.0025 (4/1604)
Distribution comparison (Zoom)
-
Monte-Carlo (4/1604)
-
No retention
- Monte-Carlo (4/804)
- No retention
Experimental
Predicted
Predicted
Do we really have 4n in the MIC against 800N in the MAC, or rather against 1600N ?
What could be wrong in my approach ?
The distributions of IES+/Total we observe are still function of the retention level, even for very low fractions of IES+/total.
For instance, two expected distributions that are identical despite having different ratios MIC/MAC :
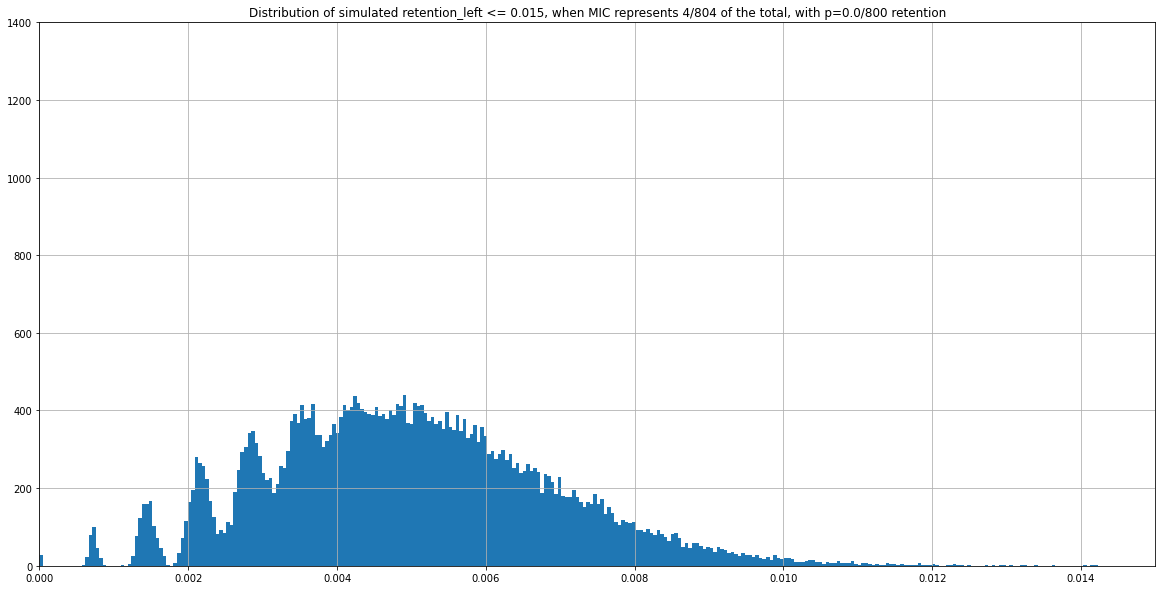
P(MIC) = 4/804
Retention = 0/800
P(MIC) = 4/1604
Retention = 4/1600
Fitness to the expectated distribution is not sufficient

Observed
N Mac = 1600
Retention = 0/1600
N Mac = 2000
Retention = 1/2000
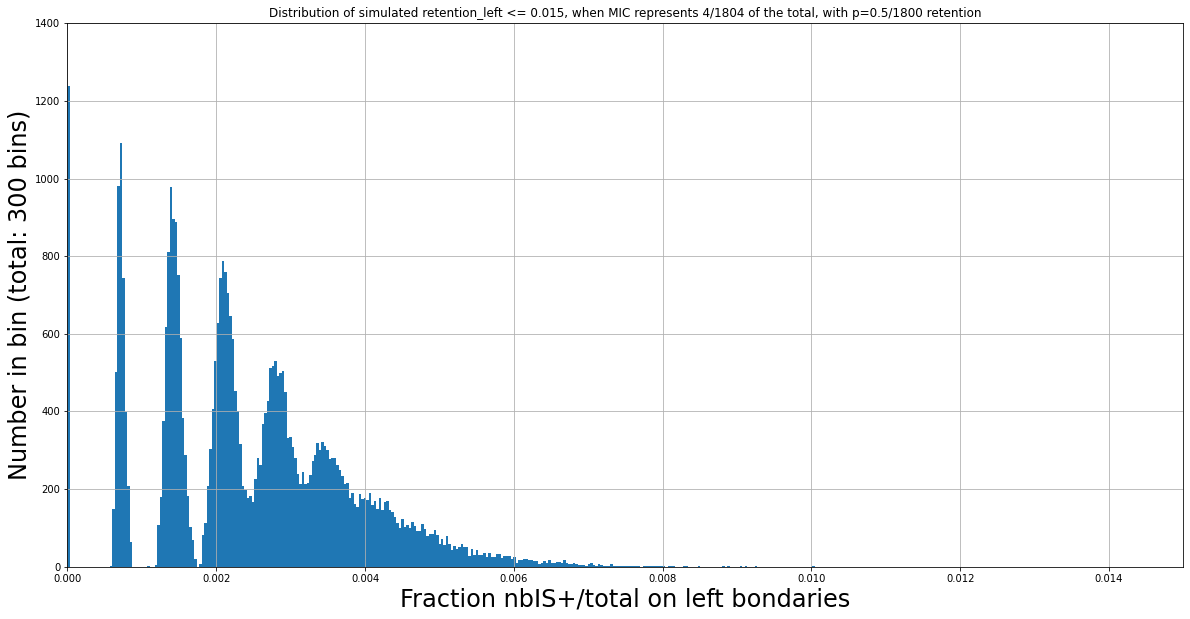
N Mac = 1800
Retention = 0.5/1800

N Mac = 100000
Retention = 245/100000
(absurd)
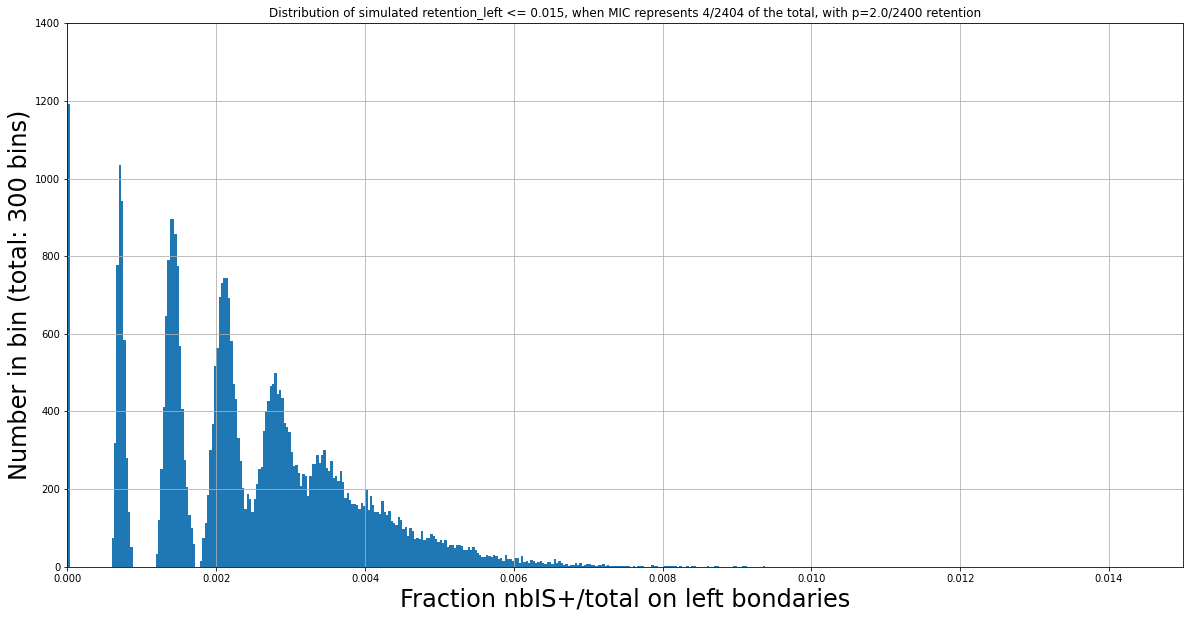
N Mac = 2400
Retention = 2/2400
Why is the ploidy ratio likely not 4:800 ?
Despite the considerations of the previous slide,
No retention level (ranging from 0/800 to 800/800) can possibly lead anywhere close to this figure (obtained from experimental data) while having a MIC/MAC 4:800
Other considerations
- The pipeline to assign the reads at left and right bondary is stringent. What if a few are lost ?
- The MIC and MAC genomes actually don't have the same size, so we already know that 4:800 is not a correct number
- The ploidy could vary from one chr to another
- All IESs don't have the same probability p of being retained, contrary to our model. The reality is likely much more complex
- The possibilities are actually way more diverse than a simple choice between 4:800 or 4:1600. There is an infinity of combinations of couples (ploidy ratio,retentions) that could fit approximately what we observe. None of them is 100% satisfying.
Conclusion

4:800 ? 4:1600 ?
Anything else ?
I am naked in the darkness of ignorance
Score de rétention
\frac{nb\ IES^+}{N} = Retention\ score
Rationnel de base:
- Attendu sans rétention ~ 1/200
- L'observé est-il nettement supérieur à ~1/200 ?
Si N = reads passant sur la jonction TA du MAC + les reads portant l'IES :
A priori: Simple, efficace, pas cher.
Implémentation stat
= Comparaison de proportion: théorique \(p\) VS observée \(p_0\)
$$ H_0 : p = p_0 $$
$$ H_1 : p > p_0 $$ (unilatérale droite)
$$ pvalue = P(p_0 | H_0) $$
Faisable uniquement si:
$$ N \geq 30,\ N\cdotp_0\geq5\ et\ N(1-p_0)\geq5 $$
Très souvent faux pour nous
Option 1 : Approximation loi normale.
Option 2 : Test exact de Fisher
Distribution des p-values
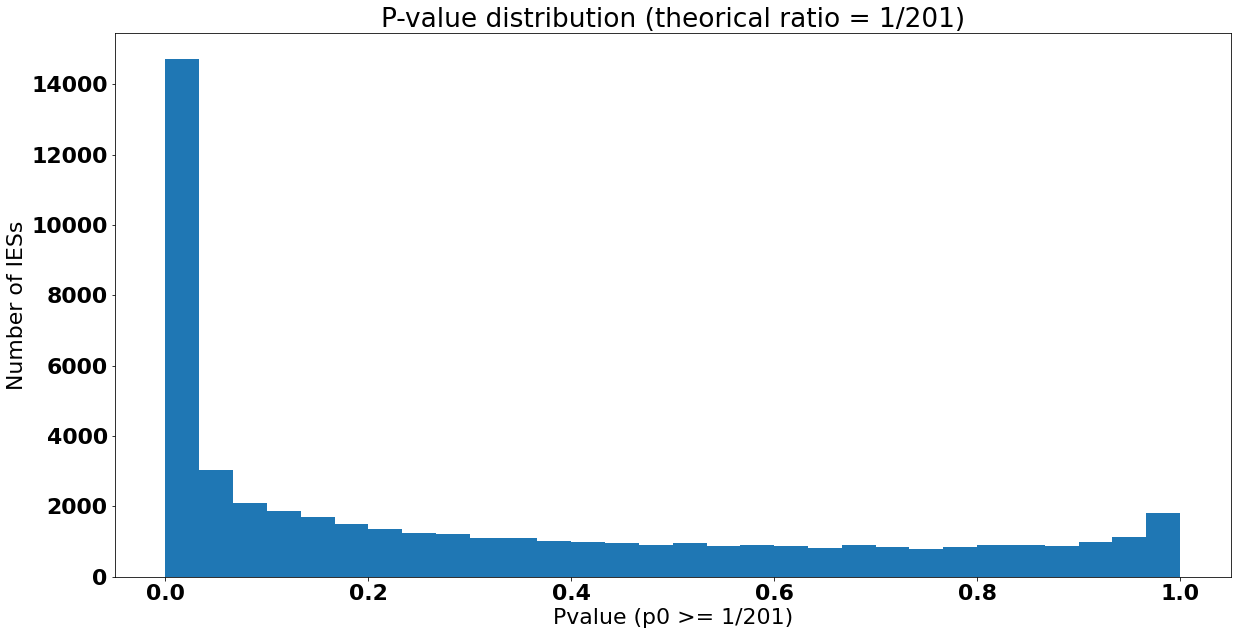
$$ pvalue \leq 5\% \iff Retention \geq 0.00848 $$
Premier non rejet de \(H_0\)
La molécule avec le score de rétention le plus élevé pour laquelle \(H_0\) n'est pas rejetée pour \( \alpha = 5\% \) :
Reads MAC : 70
Reads IES+ : 2
\(p_0= 0.02857... \)
\( Retention = \frac{2}{72} = 0.27..7 \)
> Si on se base hâtivement sur le test, on considérera que ça vient physiquement du MIC
Pourtant...
Reads MAC : 70
Reads IES+ : 2
\(p_0= 0.02857... \)
\( Retention = \frac{2}{72} = 0.27..7 \)
Si la probabilité réelle de rétention de cette IES dans le MAC notée \( P(R|MAC) \) était, par exemple, de 1% :
- Il n'y aurait rien de choquant à n'avoir 0 read IES+ venant du MIC quand on sait que leur probabilité est de ~1/201 du total.
- Il n'y aurait rien de choquant à avoir 2 reads IES+ qui viennent du MAC avec une probabilité de 1/100 par molécule MAC
- Les deux IES+ qu'on aurait piochées ici viendraient très probablement du MAC retenu
- Plus précisément : \( P(MIC|IES^+) = 50\%) \)
- Peut-on considérer que c'est suffisant pour étudier le MIC ? ...
Solution évidente :
> Prendre \( \alpha \) plus grand !
- Quel threshold ?
- Sur quelle base ?
- On va très vite tout éliminer
Soulève d'autres problèmes :
Autre formulation de la situation :
- Si \(pvalue \leq \alpha \) : clairement retenues
- Si \(pvalue > \alpha\), ça peut parfaitement être rempli de séquences retenues quand même.
Or, on veut travailler sur les IES avec \(pvalue > \alpha\)...
Conclusion : Le score de rétention n'est pas une métrique appropriée pour notre problème.
Reformulation
Ce qui nous intéresse est uniquement, pour chaque IES :
- \( P(MIC|IES^+) \) pour chaque IES
- Le score de rétention n'en est qu'un proxy
Idée grossière:
On ne connait pas le pourcentage de molécules MAC qui retiennent l'IES. Mais :
- On connait le nombre d'IES+ obtenu
- On connait le nombre de MIC espéré: \( nb_{MIC} \approx P(MIC) \cdot N \)
- On a donc une idée de l'attendu du nombre de séquences MAC retenant l'IES : \( E( nb_{MACret} ) \approx {nbIES}^+ - E( nbMIC ) \)
De là : On a bien une piste pour estimer la proportion des IES+ qui viennent physiquement du MIC:
Exemple :
- 10.000 reads
-
dont 5000 reads IES+
--> On peut estimer grossièrement \( P(R|MAC) \approx 50\% \)
\( P(MIC |IES⁺) \approx \frac{1}{200} \)
Exemple guide
Exemple guide :
N = 100
\( nb_{IES^+} = 3 \)
\( P(MIC) = \frac{4}{804} \)
P(retention) = ??
\( P(MIC|IES⁺) = ?? \)
Calcul des probabilités :
- On a donc, littéralement, la distribution de probabilité de la variable aléatoire \( \frac{nbMIC}{nbIES+} \) sachant nbIES+.
- \( P(MIC|IES+) \) est approché par la moyenne de cette variable aléatoire.
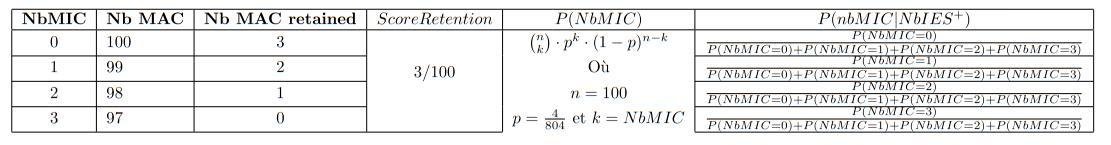
> Pour une IES donnée, on peut donc estimer la probabilité qu'elle vienne du MIC ou du MAC
On peut utiliser cet estimateur en déduire, pour un ensemble de X séquences \(IES^+\), quel sera, en moyenne, la proportion de molécules venant du MIC.
\( \frac{nbMIC}{NbMacRet} \)
0/3
1/3
2/3
3/3
MAC ploidy and retention score
By biocompibens


