Empirically calibrated ABMs with spatial dynamics
1 Example and 1 Perspective


TUD-TBM seminar - 13 February 2024
Clémentine COTTINEAU, CNRS, France / TUD-BK Urbanism, NL
with
Julien PERRET, IGN, LaSTIG
Romain REUILLON, CNRS, Complex Systems Institute / Géographie-cités
Sébastien REY-COYREHOURCQ, Université de Rouen, IDEES
Julie VALLÉE, CNRS, Géographie-cités
with
Bayi Li, TUD-BK Urbanism, NL
The example of the "5-a-day" campaign
in the Paris region (2007)
Example of ABM
Opinion diffusion, Health behaviour and the mediating effect of spatio-temporal segregation
Dietary behaviour is social biased

J Am Diet Assoc. (2008)
J Am Diet Assoc (2010)

A-spatial results on "5-a-day"
Educated, female and elderly people adhere more closely to recommendations
People with similar health outcomes tend to concentrate in space
ex: uneven shares of smokers, obesity rates, etc.
Segregation and health behaviour
Space itself can contribute to generate or increase health inequalities
ex: accessibility to healthcare, importance of local role models, etc.
Argument for 'place-based' policies
Spatial effect
Spatial Sorting
BUT...
Social environments change during the day
Vallée J, 2017. Challenges in targeting areas for public action. Target areas at the right place and at the right time. Journal of Epidemiology and Community Health. Vol 71 No 10, 945-946. {10.1136/jech-2017-209197}.
Daily mobility is not socially neutral and modifies:
> The representation of target population in particular areas
> The characteristics of areas themselves (pollution, service offer, etc.)
> The exposure effect of both mobile and immobile populations (socially biased)
Research question
How does spatio-temporal segregation affect diffusion processes in the field of health behaviour?
Physical separation of social groups in the city
Where people
reside, but also
where they spend their time during the day (work, education, leisure, etc.)
Contextual effects are:
- important in the context of health, education, economic behaviour
- Hard to identify because people (1) adapt, (2) sort themselves ex-ante in terms of residence, (3) live only once!
Interactions between people and places are often considered as static in empirical models
- Daily trajectories of people are not considered, even in multilevel modelling
- Daily trajectories of places are completely ignored
Challenges
ABM to explore joint trajectories of people and places and their impact on behaviour
>Toy models of segregation effects on dietary behaviour
SSM - Population Health (2016)
Am J Prev Med (2011)
Health, diet and ABM literature

> Place effects on health in general
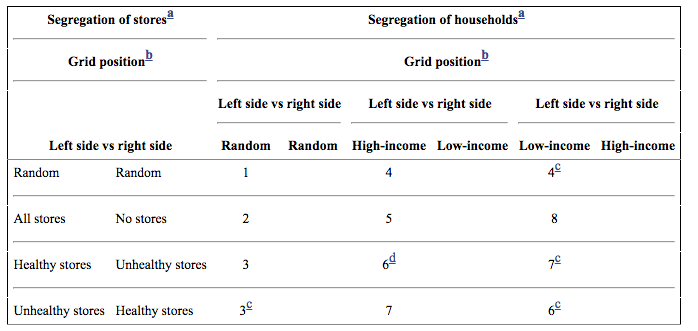
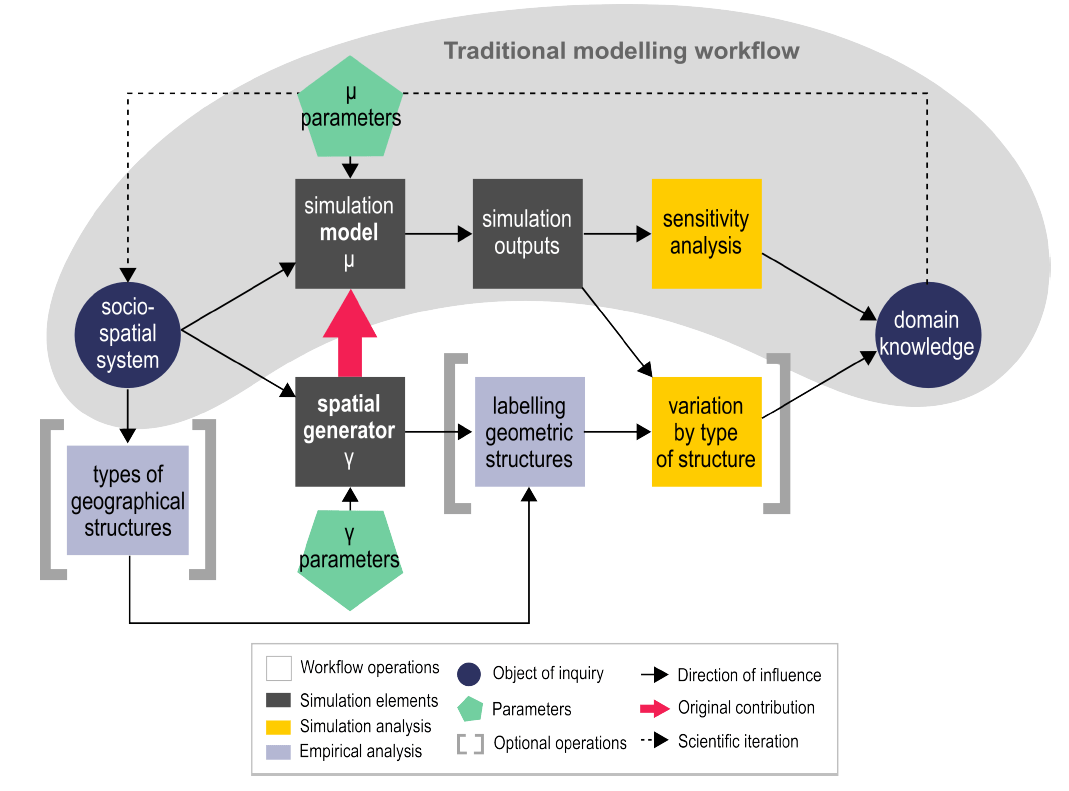
But spatial conditions matter in ABM
> Raimbault, J., Cottineau, C., Le Texier, M., Le Nechet, F., & Reuillon, R. (2019). Space Matters: Extending Sensitivity Analysis to Initial Spatial Conditions in Geosimulation Models. Journal of Artificial Societies and Social Simulation, 22(4).
Explore effect of spatio-temporal segregation on social inequalities of diet (eating ≥5 fruit&veg a day)
Are social inequalities larger...
Objective
When the residence of social groups is spatially segregated (compared to a random distribution)?
When daily mobility and daytime segregation are considered?
| Scenario 1 | Scenario 2 | Scenario 3 | Scenario 4 | Scenario 5 | |
|---|---|---|---|---|---|
| Residence | Random | Random | Empirical | Empirical | Empirical |
| Mobility | / | Random | / | Random | Empirical |
Realistic
Distribution
Usual
Model
Nutrition Data
Mobility data
matched by 18 sociodemographic groups
Residential : 2012 Census
Daily mobility : enquête EGT 2010 (OD)
Baromètres Santé Nutrition
(1996 ; 2002 ; 2008)
Sex (male ; female)
X
Age (15-29 yrs.; 30-59 yrs.; 60 yrs. and +)
X
Education (poor ; middle ; up)
Empirical calibration
Dietary opinions and behaviours are defined at initialisation according to the statistical distribution of their sociodemographic group.
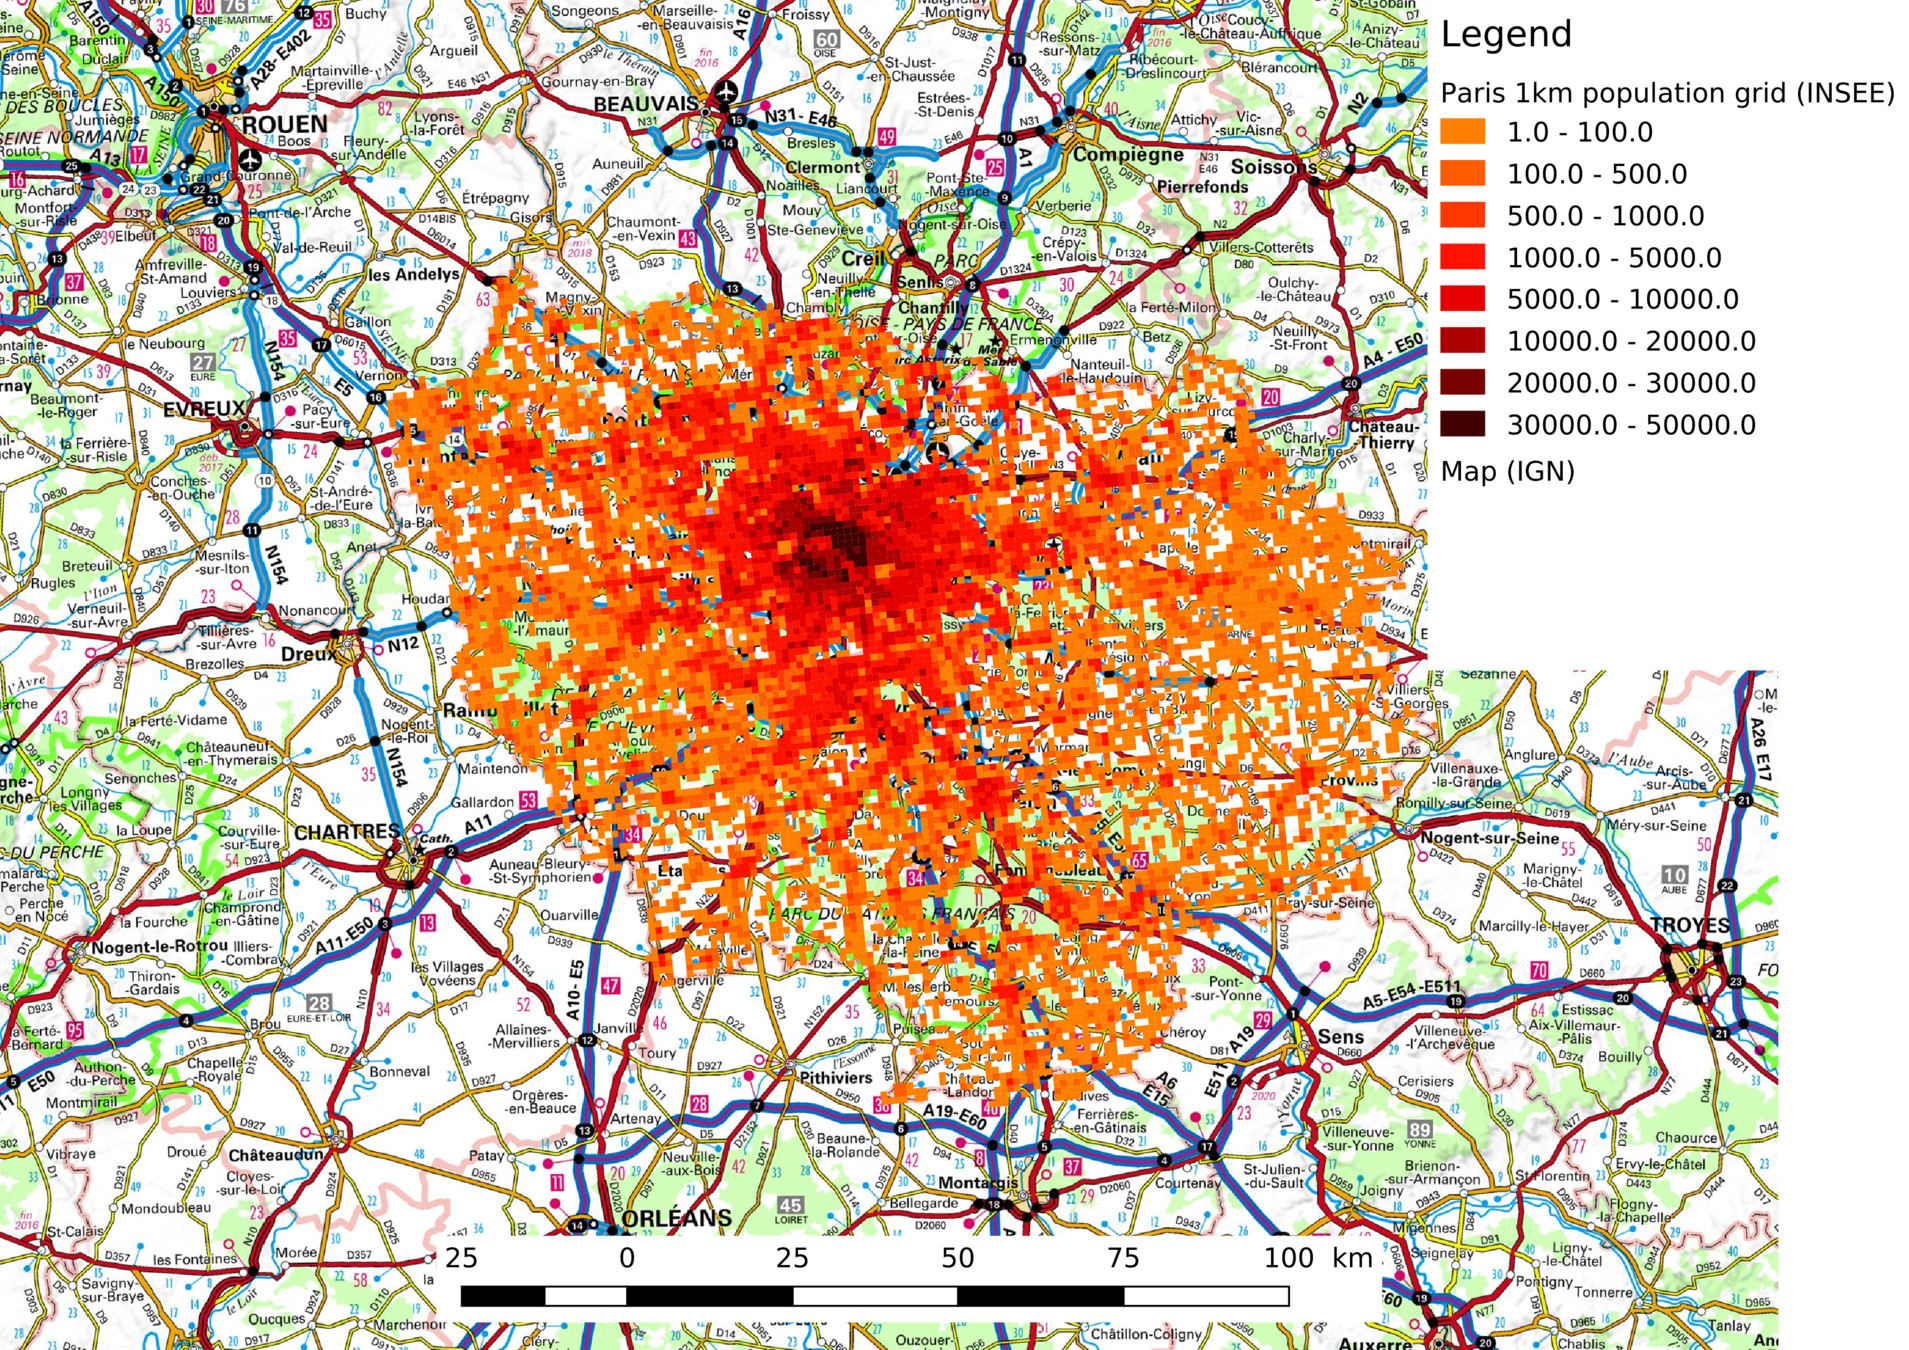
8,16 million
Spatial boundary
8540 inhabited cells (1km X 1km)
Agents
with AM / PM / night locations
> (synthetic OD matrix)
with sociodemographic attributes
Ile-de-France (Paris Region)
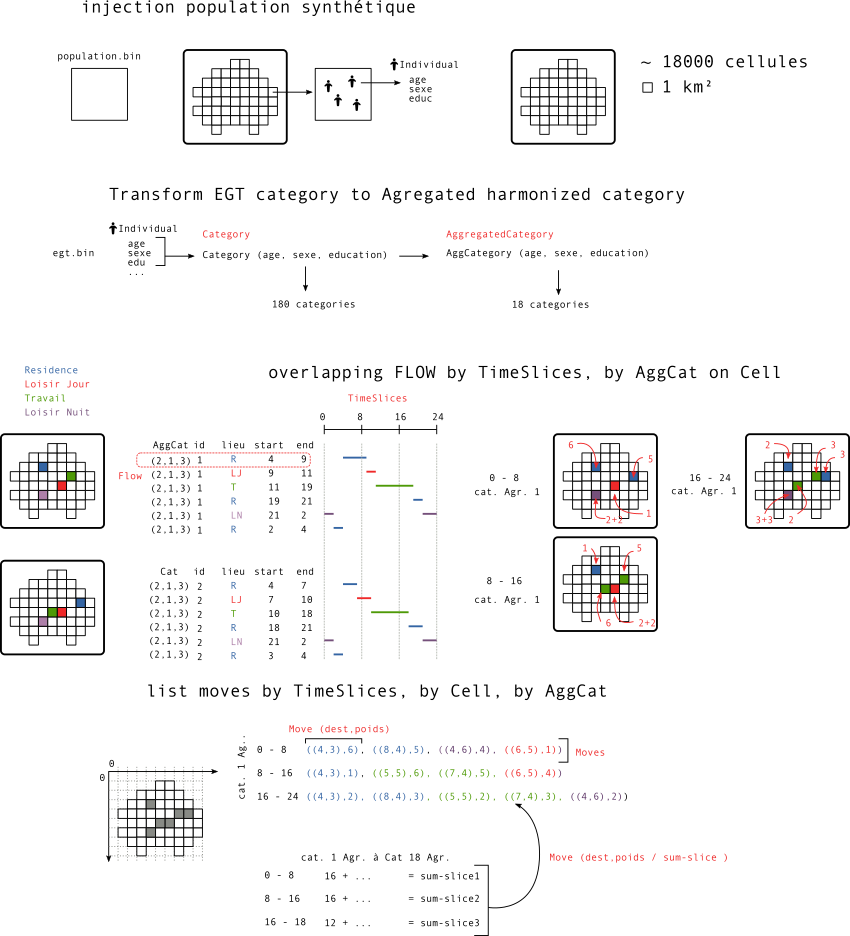
Synthetic Population
More about the generator: https://github.com/eighties-cities/h24
Scenarios 1 & 2:
1 time slice per day
Scenarios 3 & 4:
3 time slices a day
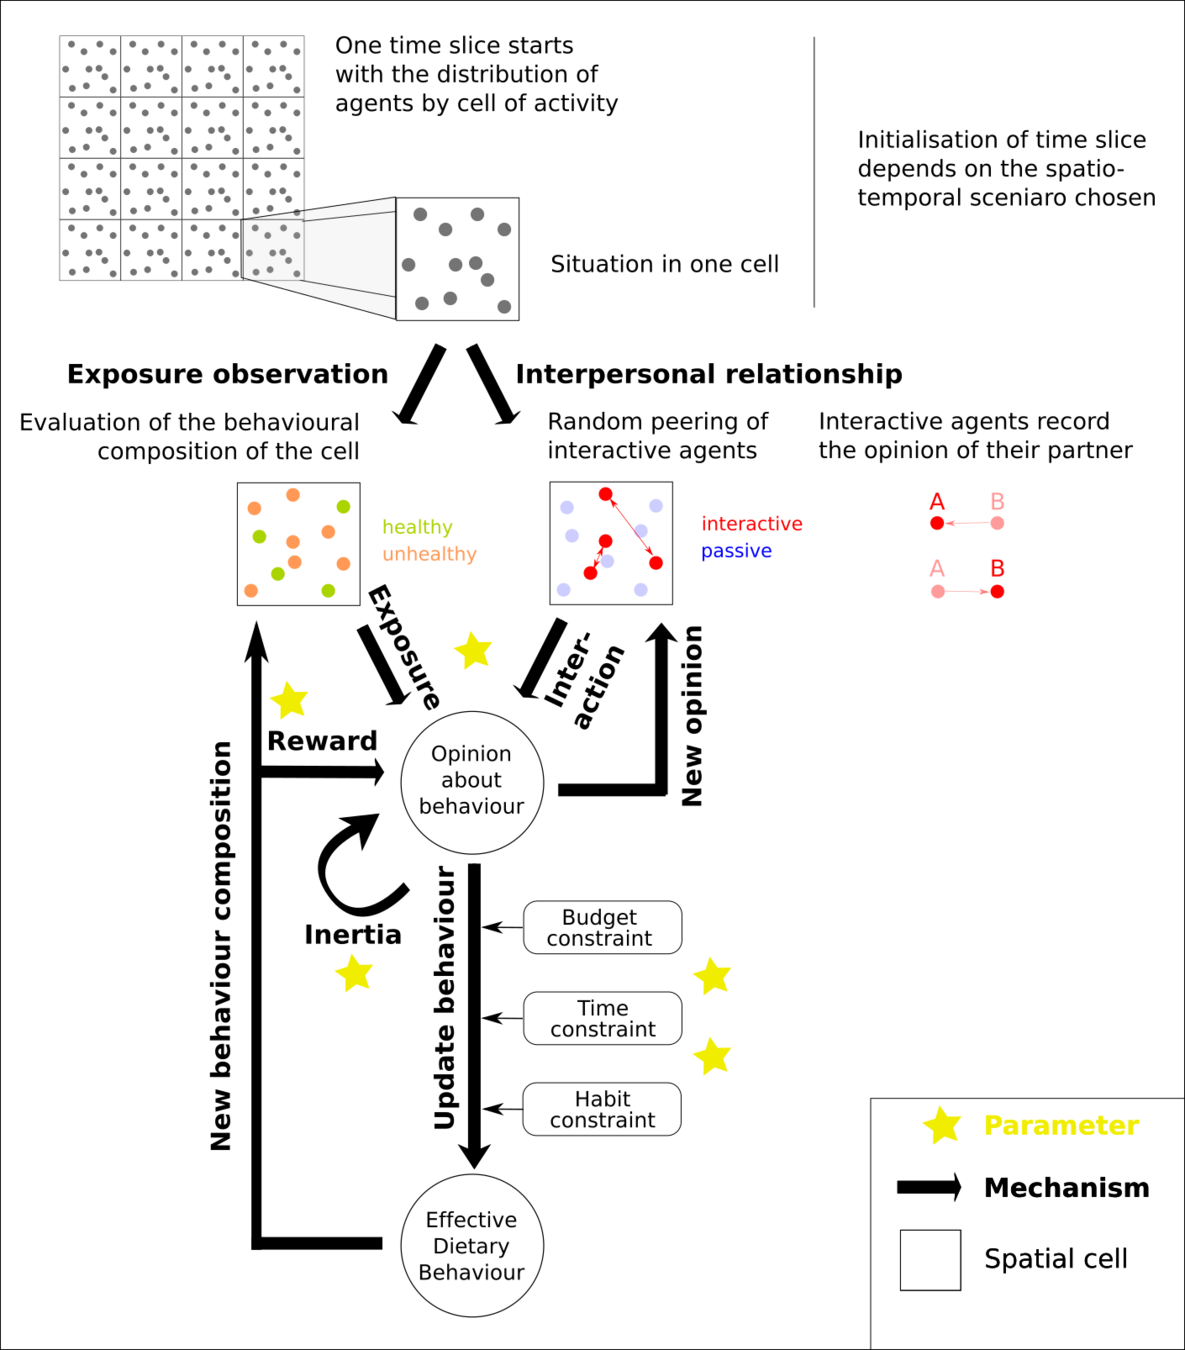
Spatial interactions
Opinion
dynamics model
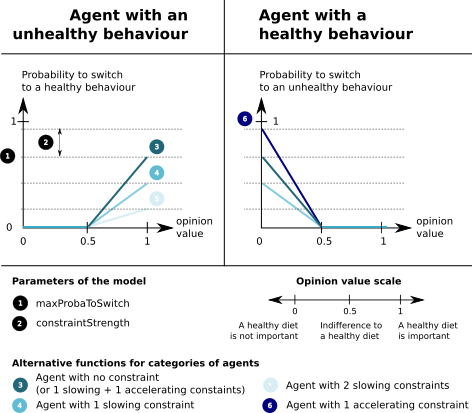
Model of behaviour change under contraints
Dynamics
Formal Model
influence\_partner_{i,j,c} = opinion_{j,c}
influence\_cell_{i,c} = \frac{n\_healthy\_neighbours_c}{n\_all\_neighbours_c}
rewardedOpinion\_o_{i,t}= opinion_{i,t}
min(1, (1 + healthyDietReward) * opinion_{i,t}))
if i is unhealthy at time t
otherwise
newOpinion\_o_{i,t} =
inertiaCoefficient \times rewardedOpinion +
(1 - inertiaCoefficient) \times
( interpersonalInfluence \times influence\_partner_{i,c} +
(1 - interpersonalInfluence) \times influence\_cell_{i,c} )
x_i = f(y_i,o_i)=
max(0, y_i * (2 * newOpinion_i - 1))
max(0, y_i * (-2 * newOpinion_i + 1))
if i is unhealthy at time t
if i is healthy at time t
y_i= maxProbaToSwitch - n_i * constraintStrength
Free parameter
= number of constraints of agent i
n_i
= agent
i
= interacting partner
j
= cell
c
= switch probability
x_i
| Parameter | Mechanism | Range | if min | if max | Expect Influence |
|---|---|---|---|---|---|
| Interaction | Spatial Interaction | [ 0 ; 1 ] | Exposure to the cell | Exposure to individuals | |
| Reward | Behaviour-Opinion | [ 0 ; 1 ] | Need feedback of behaviour on opinion | A healthy diet reinforces opinion | |
| Inertia | Opinion-Behaviour | [ 0 ; 1 ] | Opinion sensitive to others | Stable opinion | |
| Switch Proba | Opinion-Behaviour | [ 0 ; 1 ] | Behaviour insensitive to opinion changes | Behaviour sensitive to opinion changes | |
| Constraint | Opinion-Behaviour | [ 0 ; 1 ] | No constraint on behaviour changes | Behaviour changes constrained |
+
+
+
?
?
Free parameters
Observables
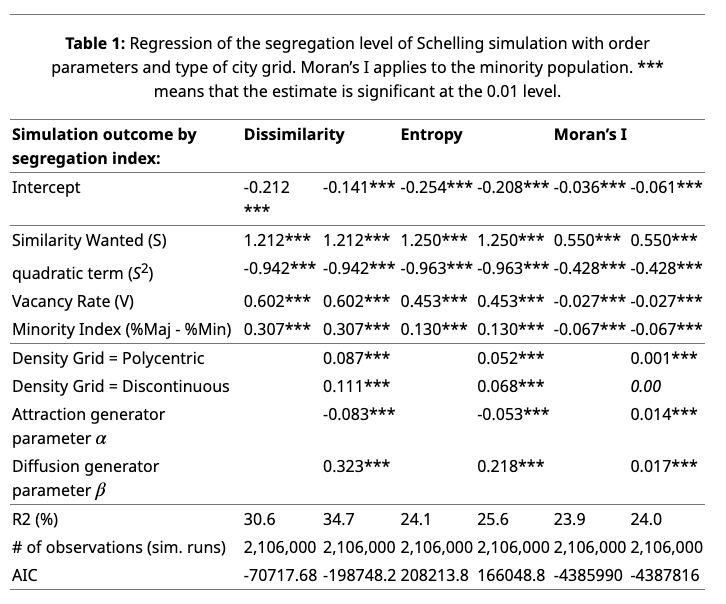
Obs. 1 : distance to data
SI = \sum_{sex=1}^2{\sum_{age=1}^3{ \frac{ShareHealthy_{sex,age,edu=3}}{ShareHealthy_{sex,age,edu=1}} \times \frac{N_{sex, age}}{N}}}
2002
2008
steps
years
3 slices
simulation
data
\Delta_{health} = \sum_{sex=1}^2{\sum_{age=1}^3{\sum_{edu=1}^3{ | NHealthy_{sex, age, edu, simulated} - NHealthy_{sex, age, edu, observed} | }}}
Obs. 2 : social inequality
of dietary behaviour
for each category
of age ( i ) & sex ( j )
ratio between more (3) &
less (1) educated
weighted
by sex & age category
mesure inequality between extreme education groups at equal age and sex category
2008
Characterisation of a simulation

Calibration
Calibration

Results

scenario 5
scenario 1
3
2
4
Residential segregation is the most important factor of social inequality in dietary behaviour
Daily mobility tends to reduce the effects of residential segregation
Distribution of SocialInequality values per scenario
~17 million residents
of the Netherlands
between 2003 and 2023
Prospective work
Economic inequality,
economic segregation
and residential mobility
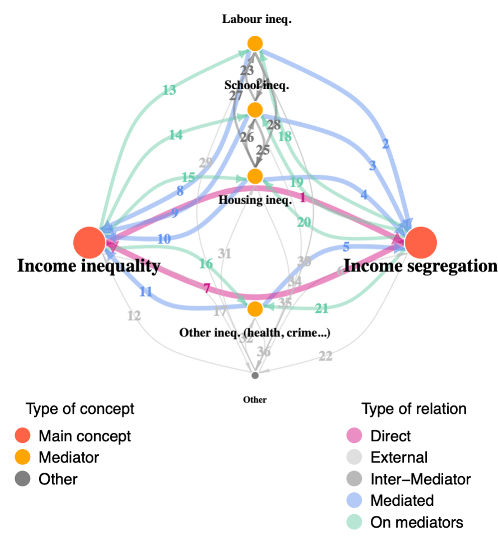
Research question
Through which channels does economic inequality affect the evolution of economic segregation?
ABM to integrate theories and simulate policies
Why empirically calibrated
- To select plausible mechanistic explanations
- To guide the incremental complexification of the model
- To compare “optimal” mechanistic combinations (between cities / between countries)
- To build trust in model for policy evaluation
Using CBS Microdata
Using SURF Supercomputer
Cottineau, C., Chapron, P., Le Texier, M., & Rey‐Coyrehourcq, S. (2019). Incremental Territorial Modeling. Geographical Modeling: Cities and Territories, 2, 95-123
Cottineau, C., Reuillon, R., Chapron, P., Rey-Coyrehourcq, S., & Pumain, D. (2015). A modular modelling framework for hypotheses testing in the simulation of urbanisation. Systems, 3(4), 348-377
Work in progress but some advances...
- thematic : the role of space and time on social dynamics
- technical : crossing large datasets and surveys
- Software engineering : ~ 10 millions mobile agents!
- Model exploration : High Performance Computing with genetic algorithm
- Epistemological : how to evaluate a generic yet realistic model?
Conclusion
Challenges remain:
Perspectives
- thematic : inclusion of dynamic processes between scales (individuals, households, neighbourhood, city, country)
- technical : more precise longitudinal data to process
- Model exploration : longer time series
- Epistemological : Modular modelling
Thank you
SEGUE Project: https://www.erc-segue.nl/
Model repository: https://github.com/eighties-cities/5aday
Synthetic Population generator repository : https://github.com/eighties-cities/h24
Bonus 1: Synthetic Population Generation
Bonus 2: Formal Model
influence\_partner_{i,j,c} = opinion_{j,c}
influence\_cell_{i,c} = \frac{n\_healthy\_neighbours_c}{n\_all\_neighbours_c}
rewardedOpinion\_o_{i,t}= opinion_{i,t}
min(1, (1 + healthyDietReward) * opinion_{i,t}))
if i is unhealthy at time t
otherwise
newOpinion\_o_{i,t} =
inertiaCoefficient \times rewardedOpinion +
(1 - inertiaCoefficient) \times
( interpersonalInfluence \times influence\_partner_{i,c} +
(1 - interpersonalInfluence) \times influence\_cell_{i,c} )
x_i = f(y_i,o_i)=
max(0, y_i * (2 * newOpinion_i - 1))
max(0, y_i * (-2 * newOpinion_i + 1))
if i is unhealthy at time t
if i is healthy at time t
y_i= maxProbaToSwitch - n_i * constraintStrength
Free parameter
= number of constraints of agent i
n_i
= agent
i
= interacting partner
j
= cell
c
= switch probability
x_i
Bonus 3: Switching mechanism
TUD-TBM Seminar 2024
By Clémentine Cottineau


