


Content ITV PRO
This is Itvedant Content department
Explore reliance F&O on NSE
Business Scenario
You are working as a Risk Analyst at a brokerage firm. A new investor has recently opened a trading account and wants to begin trading in the Futures and Options (F&O) market. Although the investor has heard about stock futures and options, they are unaware that derivative contracts are also available on stock indices, currencies, and commodities.
Your manager asks you to guide the investor through the official National Stock Exchange (NSE) website and explain the different types of derivative contracts available. You must also demonstrate how to explore Reliance Industries Ltd. Futures and Options, identify
Pre-Lab Preparation
important contract information, and understand how traders analyse these contracts before placing trades.
By completing this activity, you will become familiar with the NSE derivatives platform and learn how to locate and interpret essential information required for derivative trading.
Topic : Derivatives fundamentals
1) Hedging vs speculation
2) Exchange-traded vs OTC derivatives
3) Contract specifications
4) Margin concepts
Task 1: Explore Futures and Options on the NSE Website
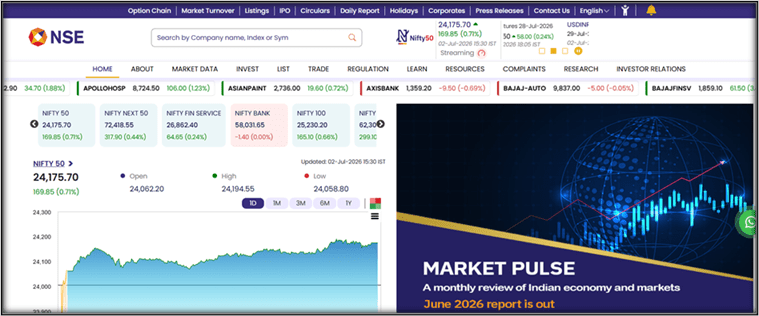
Open the Official NSE Website
1
Open any web browser.
Type https://www.nseindia.com in the address bar and press Enter.
Wait for the NSE homepage to load completely.
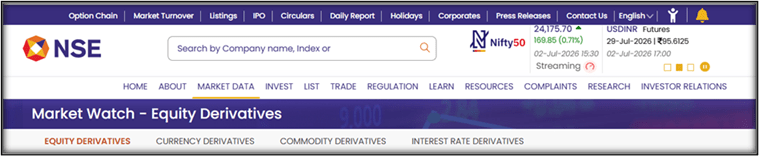
Notice the different menus available such as:
Explore the Derivatives Section
2
To find where all the derivative action happens:
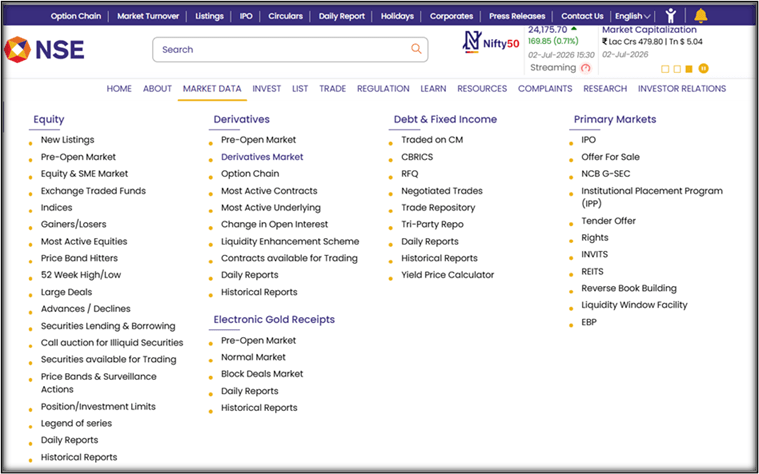
Take your mouse over the Market Data tab.
Locate and click on the Derivatives Market.
This opens up the comprehensive derivatives dashboard where you can see all classes of contracts traded on the exchange.
Understand Different Types of Futures Contracts (Real-Life Examples)
3
Before we look at specific numbers, let us understand the four major categories of Futures contracts available on the NSE using everyday examples.
A. Stock Futures
What it is: Contracts based on the shares of individual companies (e.g., RELIANCE, TCS, HDFC Bank).
Real-Life Example: Imagine you want to buy 250 smartphones from a manufacturer in three months. Instead of paying the full price today, you sign a contract locking in the price at ₹50,000 per phone. Stock Futures allow traders to lock in the future price of company shares without paying the full contract value upfront.
B. Index Futures
What it is: Contracts based on stock market indices (a basket of stocks) rather than one single company (e.g., NIFTY 50, BANK NIFTY).
Real-Life Example: Instead of buying a single apple, orange, and banana individually, you buy a pre-packaged "mixed fruit basket." Index Futures allow you to speculate on the movement of the entire market (the basket) rather than picking just one company.
C. Currency Futures
What it is: Contracts that allow traders to trade foreign exchange rates (e.g., USD/INR, EUR/INR).
Real-Life Example: An Indian electronics importer knows they have to pay $10,000 to a US supplier next month. They are worried the US Dollar will become more expensive. They use Currency Futures to "lock in" today's exchange rate, protecting themselves from currency price jumps.
D. Commodity Future
What it is: Contracts to buy or sell physical goods at a future date (e.g., Gold, Silver, Crude Oil).
Real-Life Example: A jewelry maker is planning to launch a new collection in six months but is terrified that Gold prices will skyrocket by then. They buy Gold Futures today to guarantee their purchase price for the future, ensuring their business stays profitable.
Understanding Futures vs Options
4
Before exploring Reliance contracts, it is important to understand the fundamental difference between a Future and an Option.
The Real-Life Analogy:
Futures Contract (The Strict Agreement): You sign a contract to buy a house in 3 months for ₹50 Lakhs. You must buy it, and the seller must sell it, no matter what happens to the housing market.
Options Contract (The Token Money): You pay the house seller a ₹50,000 non-refundable "Token" (Premium) to hold the house for 3 months at ₹50 Lakhs. If
If housing prices crash, you can simply walk away!
You lose your ₹50,000 token, but you are not forced to buy the house. You have the right, but not the obligation.
| Feature | Futures Contract | Options Contract |
|---|---|---|
| Obligation | Buyer and seller are obligated to complete the contract at expiry. | The buyer has the right, but not the obligation, to exercise the contract. |
| Payment (Margin) | Margin is paid by both buyer and seller.0 | The buyer pays a premium, while the seller maintains margin. |
| Risk / Reward | Profit and loss are theoretically unlimited for both. | Option buyers have limited loss (only the premium paid). |
Search for RELIANCE and Select an Expiry Date
5
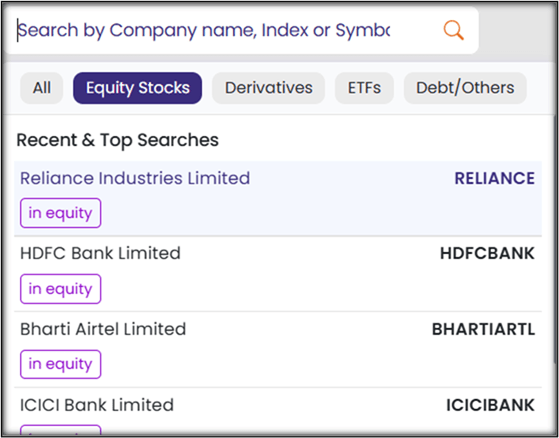
Go to the main search box at the top of the NSE website.
2. Type RELIANCE and select Reliance Industries Ltd. from the drop-down list.
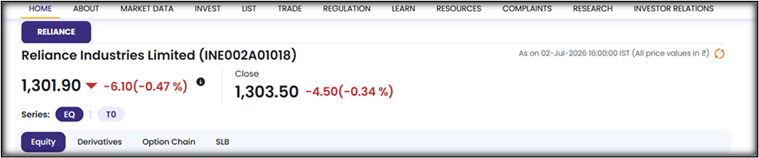
Once the company summary page loads, navigate to its Derivatives or click directly on Option Chain if you are looking at the options table.
4. To see the expiry dates and contracts, you must actively click on either:
The Derivatives Tab: To see the active Futures contracts and basic option metrics.
The Option Chain Tab: To open the full side-by-side view of Call and Put options for that stock.
Explore the Derivatives Dashboard and Reliance Futures
6
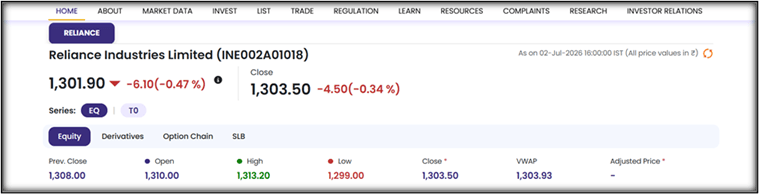
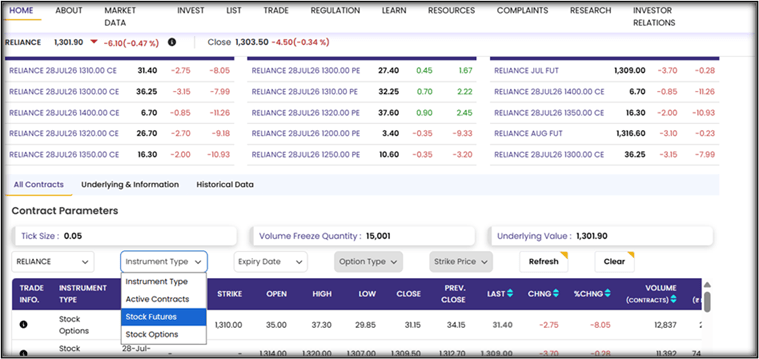
1. Click on the Derivatives located just below the Reliance stock price.
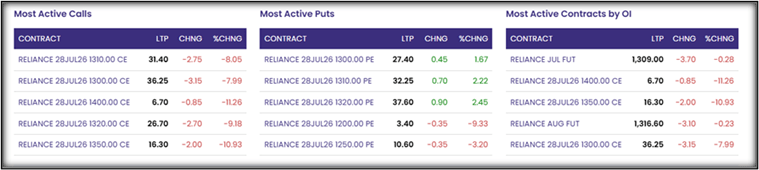
2. Observe the three summary tables:
Most Active Calls: Displays the Call options currently experiencing the highest trading activity.
Most Active Puts: Displays the Put options with the highest trading activity.
Most Active Contracts by OI: Shows the specific contracts (including both futures and options, like the RELIANCE JUL FUT) that hold the highest Open Interest.
3. Scroll down slightly past these summary tables to ensure the All Contracts tab is selected. Here, you will find the Contract Parameters section. Note the key figures:
Tick Size: The minimum allowable price movement (e.g., 0.05 like in case of reliance next possible prices must be ₹1,309.05, ₹1,309.10, ₹1,309.15).
Volume Freeze Quantity: The maximum contract quantity allowed in a single order (e.g., 15,001, If a large institutional trader (or someone who made a typing mistake) tries to execute a single order for 15,001 or more shares of Reliance in one click, the NSE system will instantly block the trade.)
Underlying Value: The live cash market price of the Reliance stock (e.g., 1,301.90).
4. To view the specific details for Futures, locate the filter drop-down menus right below the Contract Parameters. Click the Instrument Type drop-down and select Stock Futures.
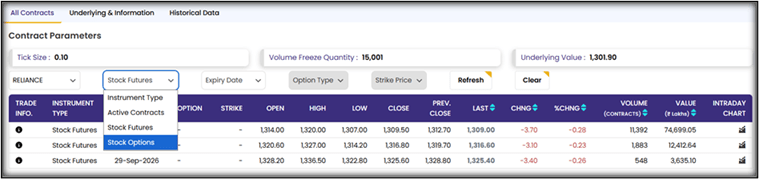
5. Observe the data table at the very bottom. You can track the active futures contracts by looking at these essential columns:
TRADE INFO.: Contains an 'i' information icon that can be clicked for deeper, contract-specific disclosures.
INSTRUMENT TYPE: Confirms the specific asset class you are viewing.
Displays Stock Futures for all rows
EXPIRY DATE: The final business day the contract remains active before mandatory financial settlement.
The near-month contract displays an expiry of 28-Jul-2026
OPTION: Displays a hyphen (-) because you are looking at futures, not call or put options.
STRIKE: Displays a hyphen (-) because futures strictly track the underlying stock price and do not use predetermined strike prices.
OPEN / HIGH / LOW / CLOSE: The precise milestone price points reached by the contract over the current trading day.
For the July contract, it opened at 1,314.00, hit a peak high of 1,320.00, touched a low of 1,307.00, and closed out at 1,309.50.
PREV. CLOSE: The final, officially settled price of the contract from the previous trading day.
The previous day's close was 1,312.70.
LAST: The absolute Last Traded Price (LTP) or current market value of the contract.
The final traded value for the July contract stands at 1,309.00.
CHNG: The absolute Rupee difference between the Last Traded Price (LTP) and the Previous Close.
The price dropped by -3.70 Rupees.
%CHNG: The percentage difference between the Last Traded Price (LTP) and the
Previous Close.
Represents a drop of -0.28%.
VOLUME (CONTRACTS): The cumulative number of contracts successfully exchanged between buyers and sellers throughout the session.
A massive 11,392 contracts have changed hands today for the near month.
VALUE (₹ Lakhs): The total monetary turnover (cash value) of all the contracts traded during the day, expressed in Lakhs.
The traded value is 74,699.05 Lakhs.
INTRADAY CHART: A clickable graph icon that opens a visual chart showing the minute-by-minute price movement for the day.
The Option Chain View:
7
To switch your analysis from Futures to Options contracts, return to the filter dropdown Contract Parameters section.
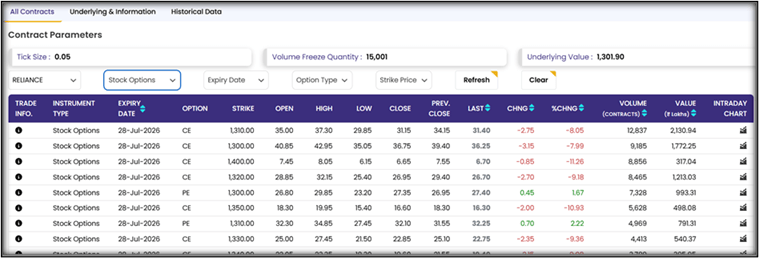
Click on the Instrument Type dropdown menu and select Stock Options.
Explore individual Stock Options Contracts
8
TRADE INFO.: Contains the standard 'i' icon for additional technical contract specifications.
INSTRUMENT TYPE: Confirms your selection by displaying Stock Options for every row.
EXPIRY DATE: The date on which the option contract expires.
Contracts shown default to the near-month expiry of 28-Jul-2026.
OPTION : Identifies the type of option contract.
CE (Call Option): For buyers expecting the underlying stock to go up.
PE (Put Option): For buyers expecting the underlying stock to go down.
STRIKE : The predetermined, fixed target price at which the option buyer has the right to buy or sell the underlying stock.
Rows show specific target strikes like 1,310.00, 1,300.00, and 1,400.00).
OPEN / HIGH / LOW / CLOSE: The highest, lowest, starting, and final premium (price) levels recorded for that specific option contract during the trading session.
PREV. CLOSE: The closing premium price of the option contract from the previous business day.
LAST: The Last Traded Price (LTP), which represents the current market premium value required to buy that specific option right now.
The premium for the 28JUL26 1310.00 CE contract stands at 31.40.
CHNG & %CHNG: The absolute Rupee value and percentage change of the premium compared to yesterday's close.
VOLUME (CONTRACTS): The cumulative number of option contracts traded today, showing how liquid this specific strike price is.
The 1310.00 CE contract has high active participation with 12,837 contracts traded.
VALUE (₹ Lakhs): The total financial turnover or premium cash volume generated by this contract throughout the session.
INTRADAY CHART: A graph icon that plots the premium's price fluctuations over the course of the day.
Compare Two Expiry Months for a Specific Strike Price
9
Locate the filter drop-down bars right below the Contract Parameters section.
Click the Strike Price drop-down filter and select 1,300.00 to focus your analysis on this specific target price level.
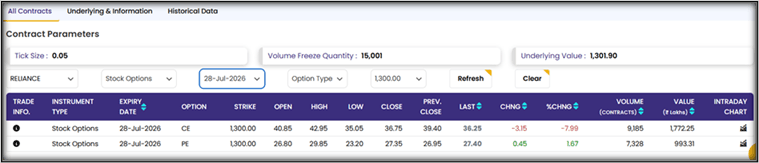
First, set the Expiry Date filter to the near-month expiry of 28-Jul-2026 and
Call Option (CE) at 1,300.00 Strike: Has a Last Traded Price (LTP) premium of 36.25 and a high trading volume of 9,185 contracts.
Put Option (PE) at 1,300.00 Strike: Has an LTP premium of 27.40 and a trading volume of 7,328 contracts.
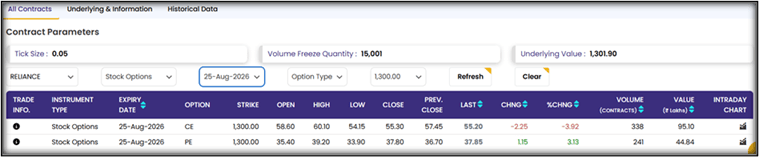
Next, change the Expiry Date drop-down to the next month's expiry of 25-Aug-2026 and click Refresh, as shown in the below image. Observe how time alters the pricing and volume metrics for the exact same 1,300.00 strike price:
Call Option (CE) at 1,300.00 Strike: The premium (LAST) has increased significantly to 55.20, while its trading VOLUME has plummeted to just 338 contracts.
Put Option (PE) at 1,300.00 Strike: The premium (LAST) has increased to 37.85, while its trading VOLUME has dropped sharply to 241 contracts.
Key Takeaways for Risk Analysis
Time Value Inflation (Premium Expansion): Notice that when moving from July to August, the Call premium jumps from 36.25 to 55.20 and the Put premium jumps from 27.40 to 37.85. This occurs because contracts with more time until expiration give the underlying stock a greater opportunity to move, making them inherently more expensive to purchase.
The Liquidity Concentration: Notice how the trading activity completely dries up in the further expiry month. The July Call option has a volume of 9,185, while the August Call option drops to 338. This shows students that retail and algorithmic traders heavily concentrate their trading positions in the immediate near-month contract due to superior liquidity.
Student Task: Multi-Asset Exploration
Now it is your turn to act as the Risk Analyst! The derivatives market extends far beyond individual stocks. Use the main NSE search bar to look up different types of assets, navigate to their Derivatives sub-tab, and use the filtering console to pull real-time data for each asset category.
Explore the live NSE platform to find your data and complete the following table based on the current near-month contracts:
| Asset Category | Search Symbol | Selected Expiry Date | Volume Freeze Quantity | Target Strike Price Selected | Option Type (CE or PE) | Last Traded Price (LTP / LAST) | Trading Volume Today (Contracts) |
|---|---|---|---|---|---|---|---|
| Stock | RELIANCE | 1,300 | CE | ||||
| Stock | RELIANCE | 1,300 | PE | ||||
| Index | NIFTY | CE | |||||
| Currency | USDINR | CE | |||||
| Commodity | GOLD | CE |
Next-Lab Preparation
Topic : Futures & Options
1) Long and short positions
2) Payoff Chart
3) Contract life cycle
4) Mark-to-market mechanism
Congratulations on completing this lab!
You explored the NSE derivatives platform and learned about different types of derivative contracts, including stock, index, currency, and commodity derivatives. You also analyzed Reliance Futures and Options contracts, interpreted key contract parameters, and compared option premiums across different expiry dates. These concepts provide a strong foundation for understanding derivative trading and market analysis
Checkpoint
By Content ITV