Farid Qamar
Data Science || Machine Learning || Remote Sensing || Astrophysics || Public Policy
MLPP
MLPP
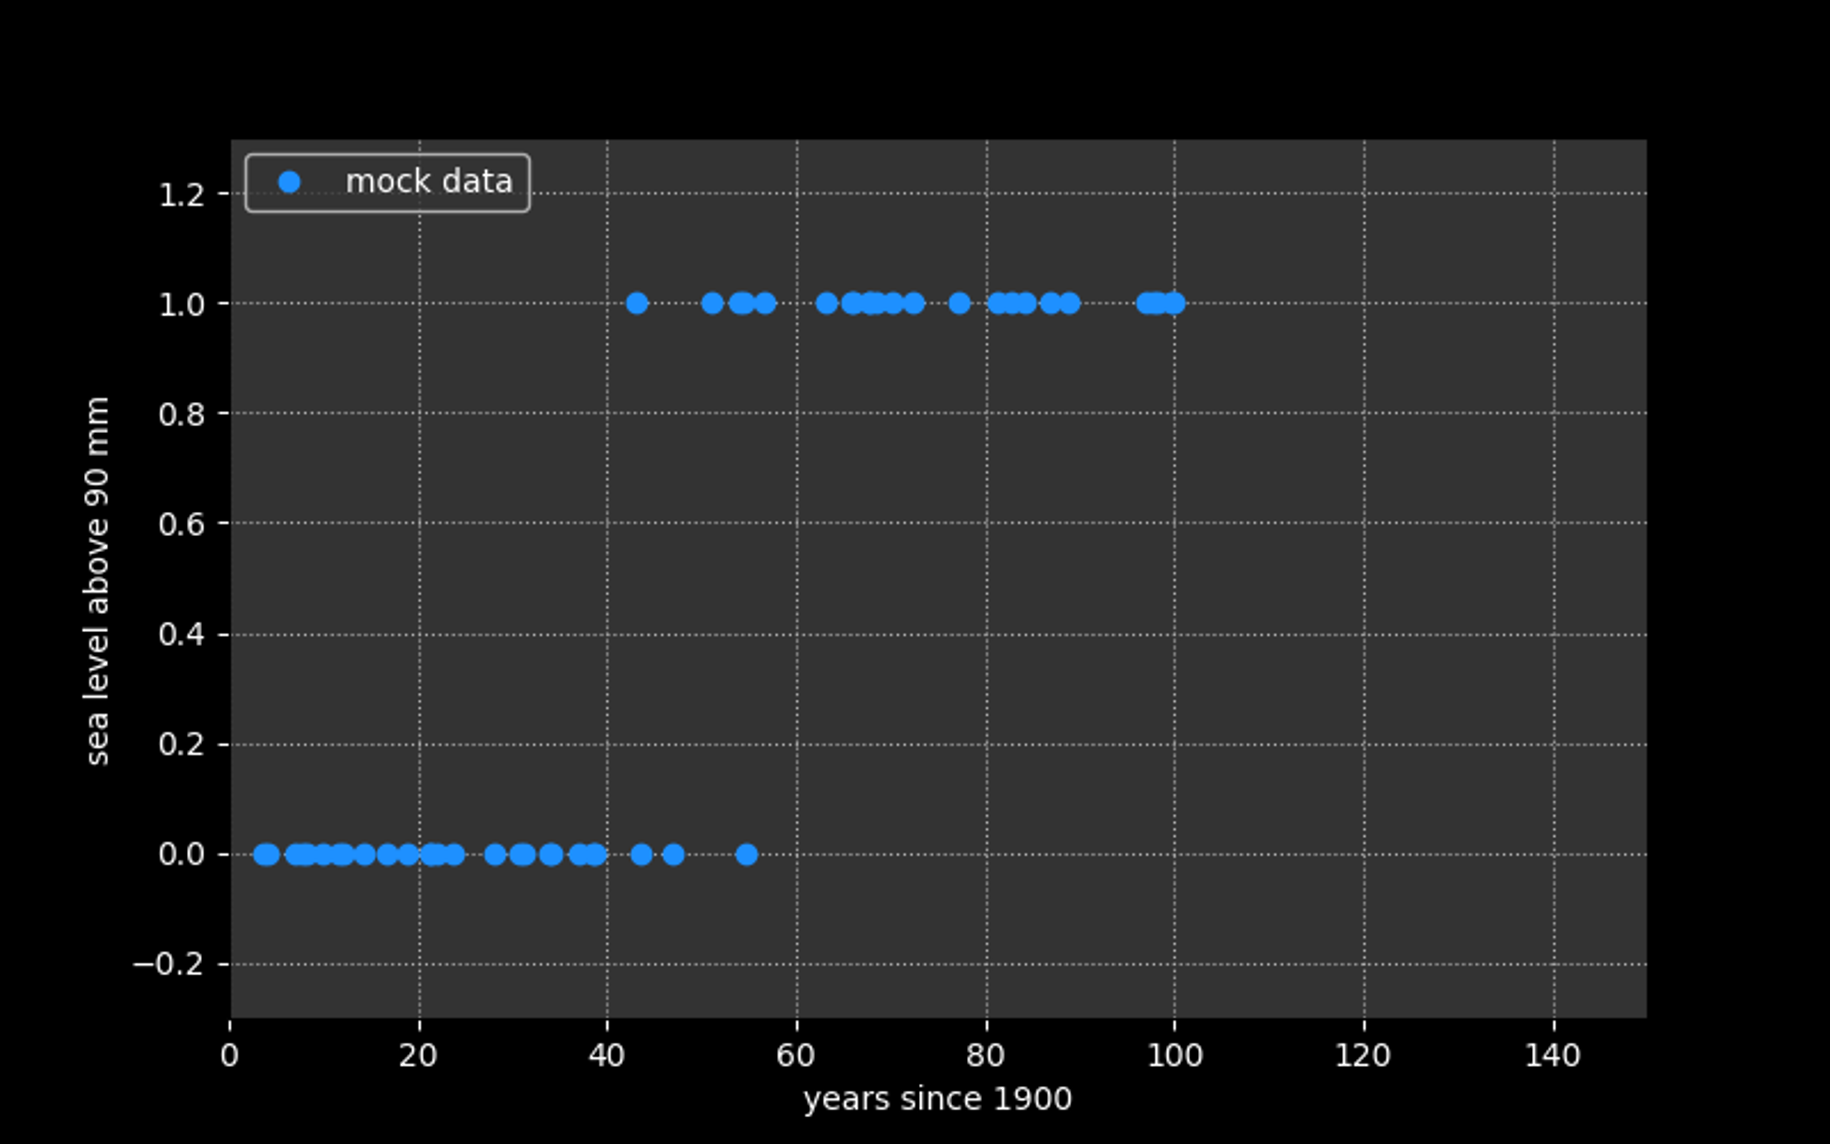
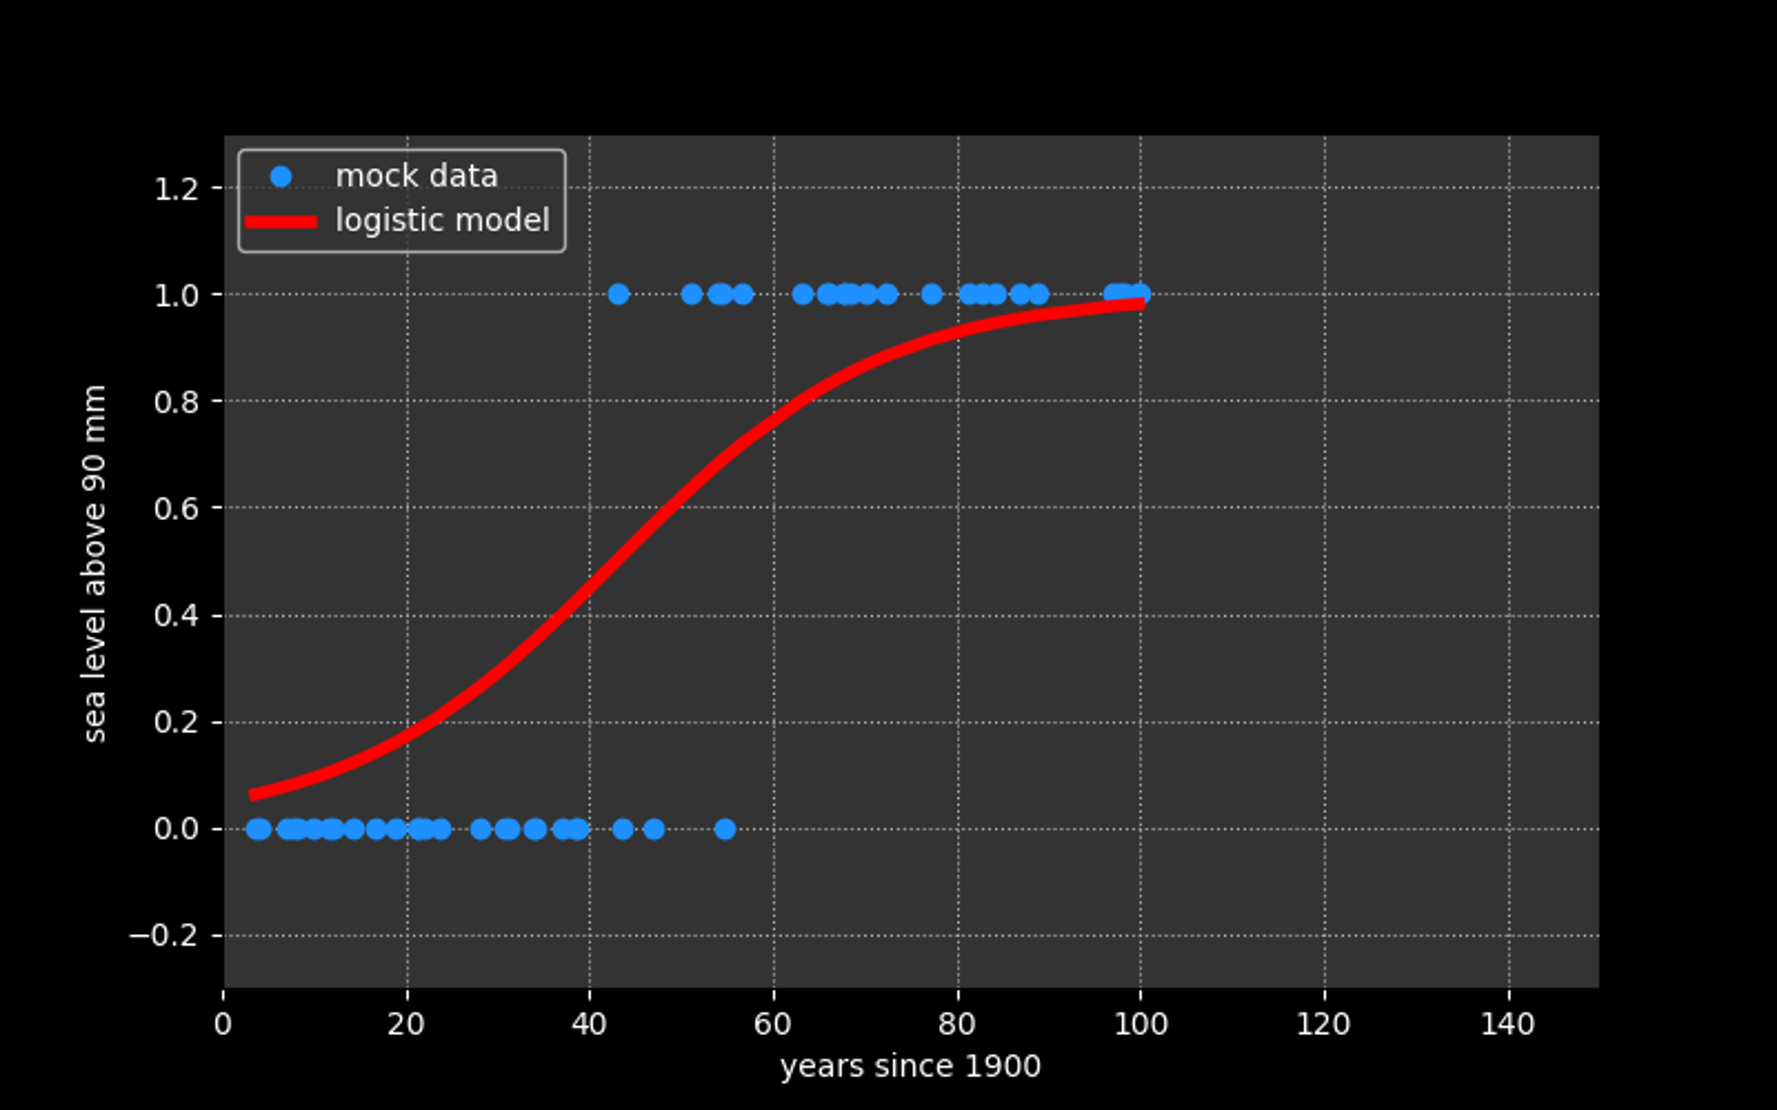
Modeling data for which the target consists of
binary values
MLPP
Modeling data for which the target consists of
binary values
In these cases we can model our data using the logistic function*:
* to be interpreted as a probability that the target is True (=1)
MLPP
Modeling data for which the target consists of
binary values
In these cases we can model our data using the logistic function*:
ML PARADIGM
parameter: m and b
metric:
algorithm: SGD (or similar)
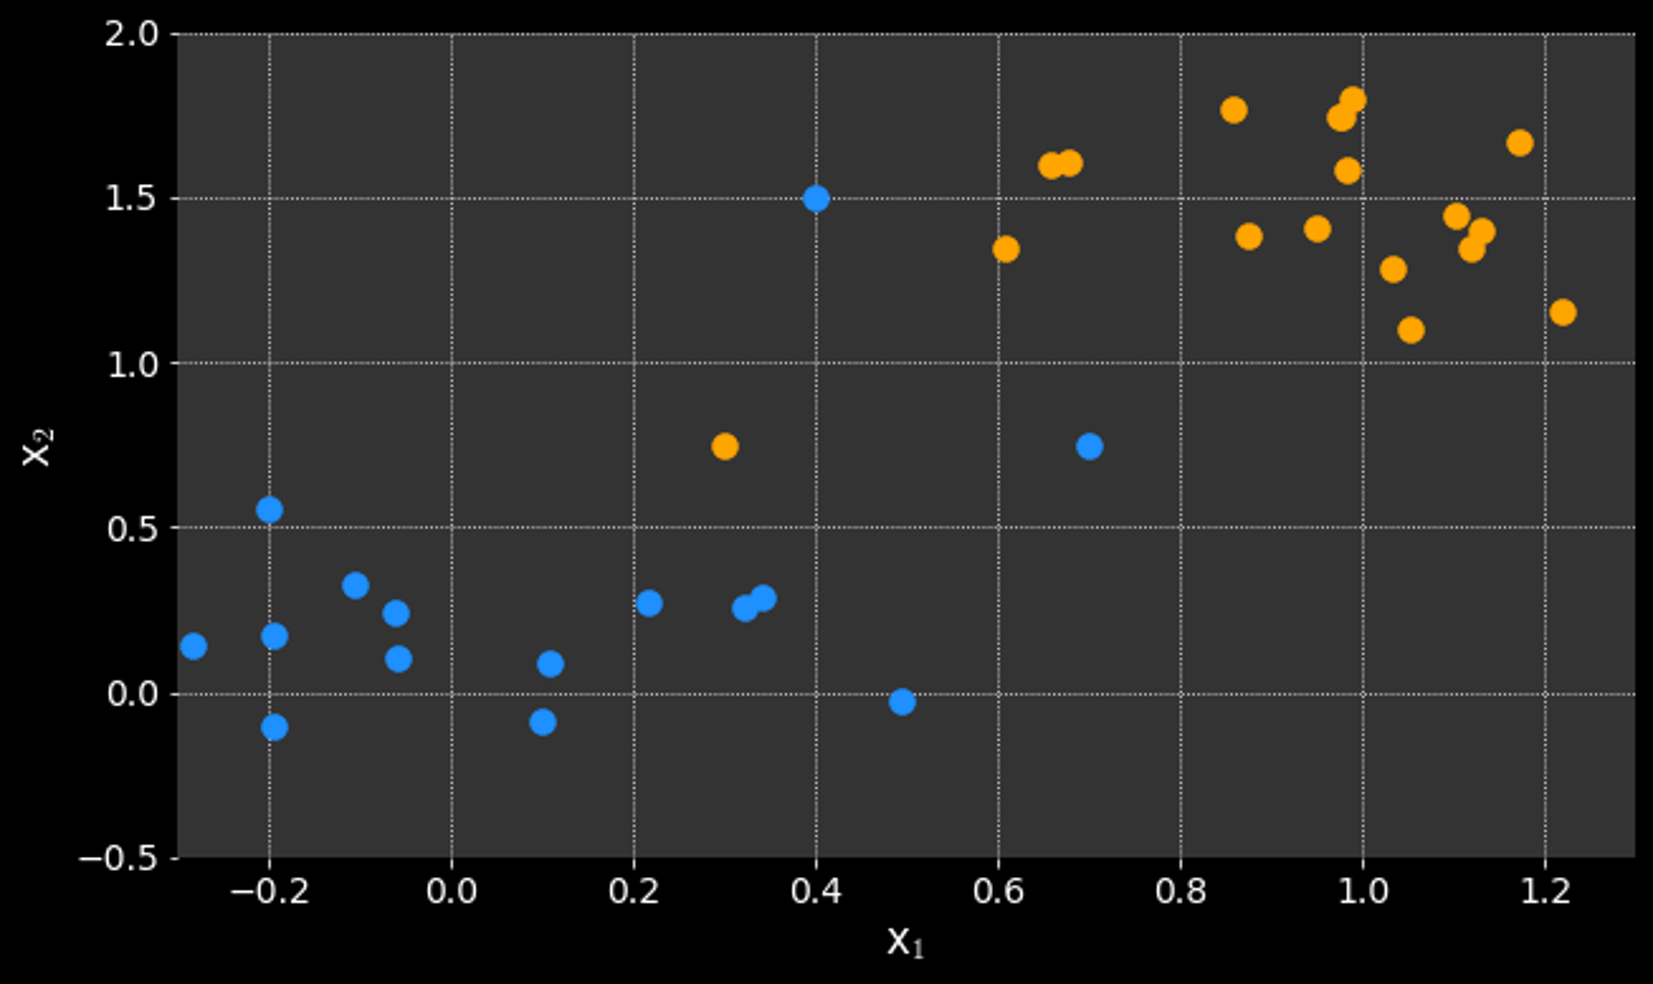
MLPP
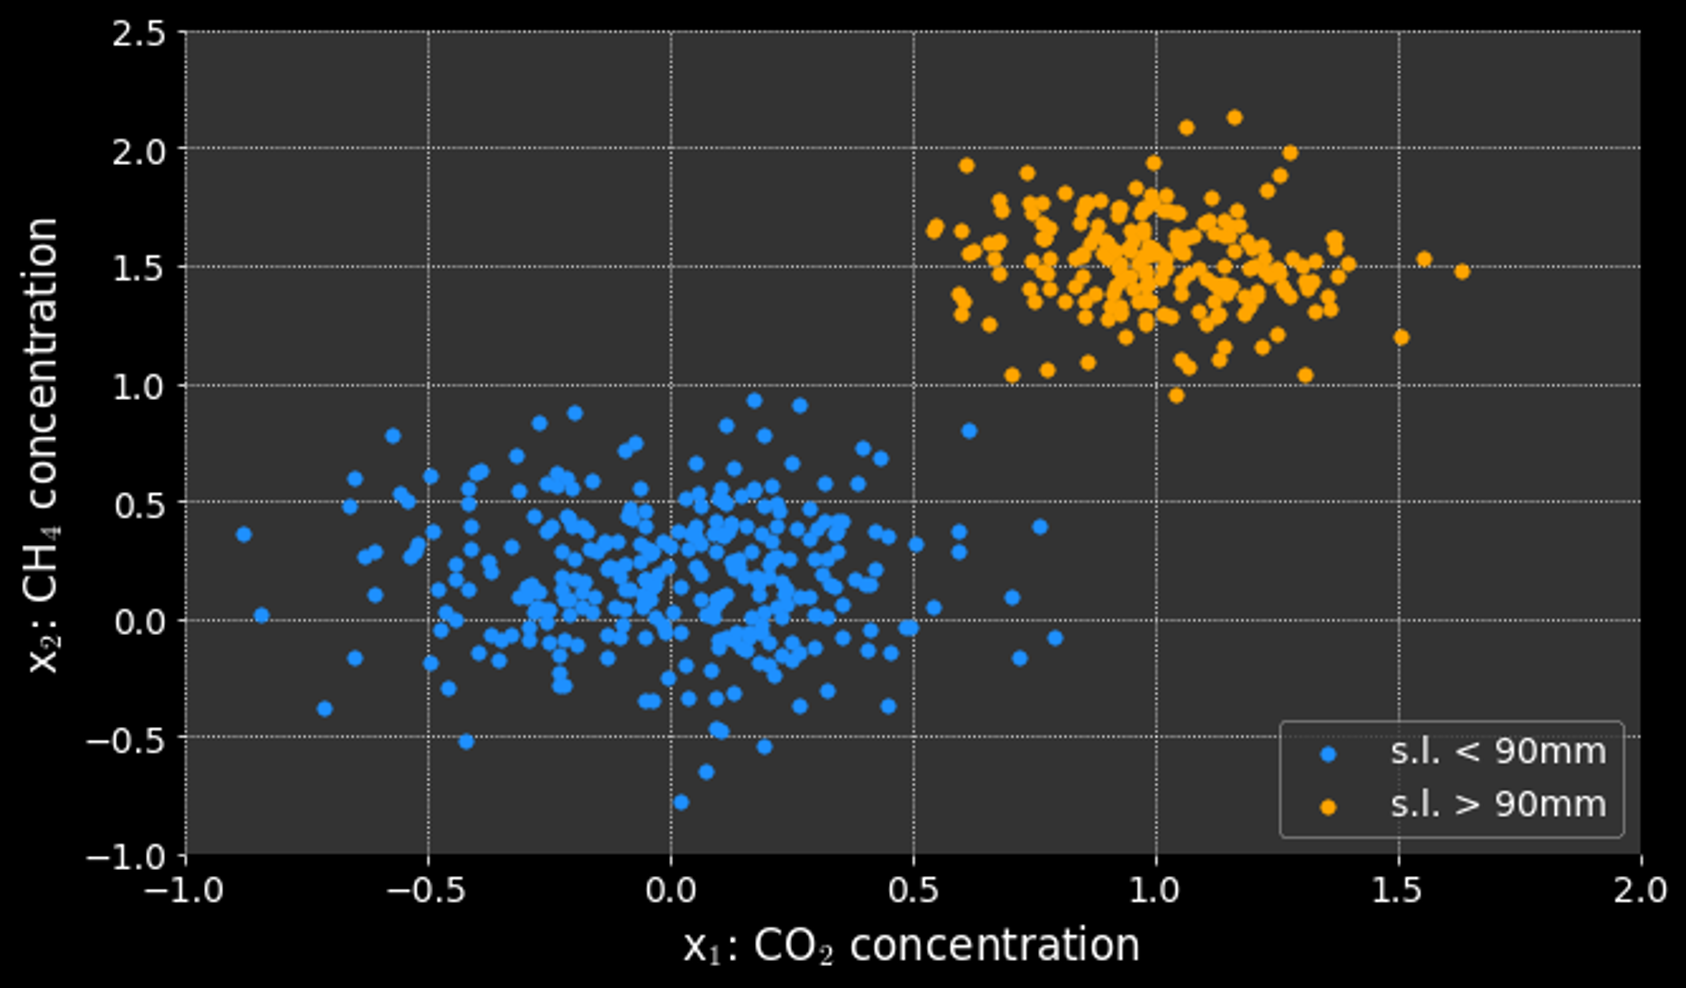
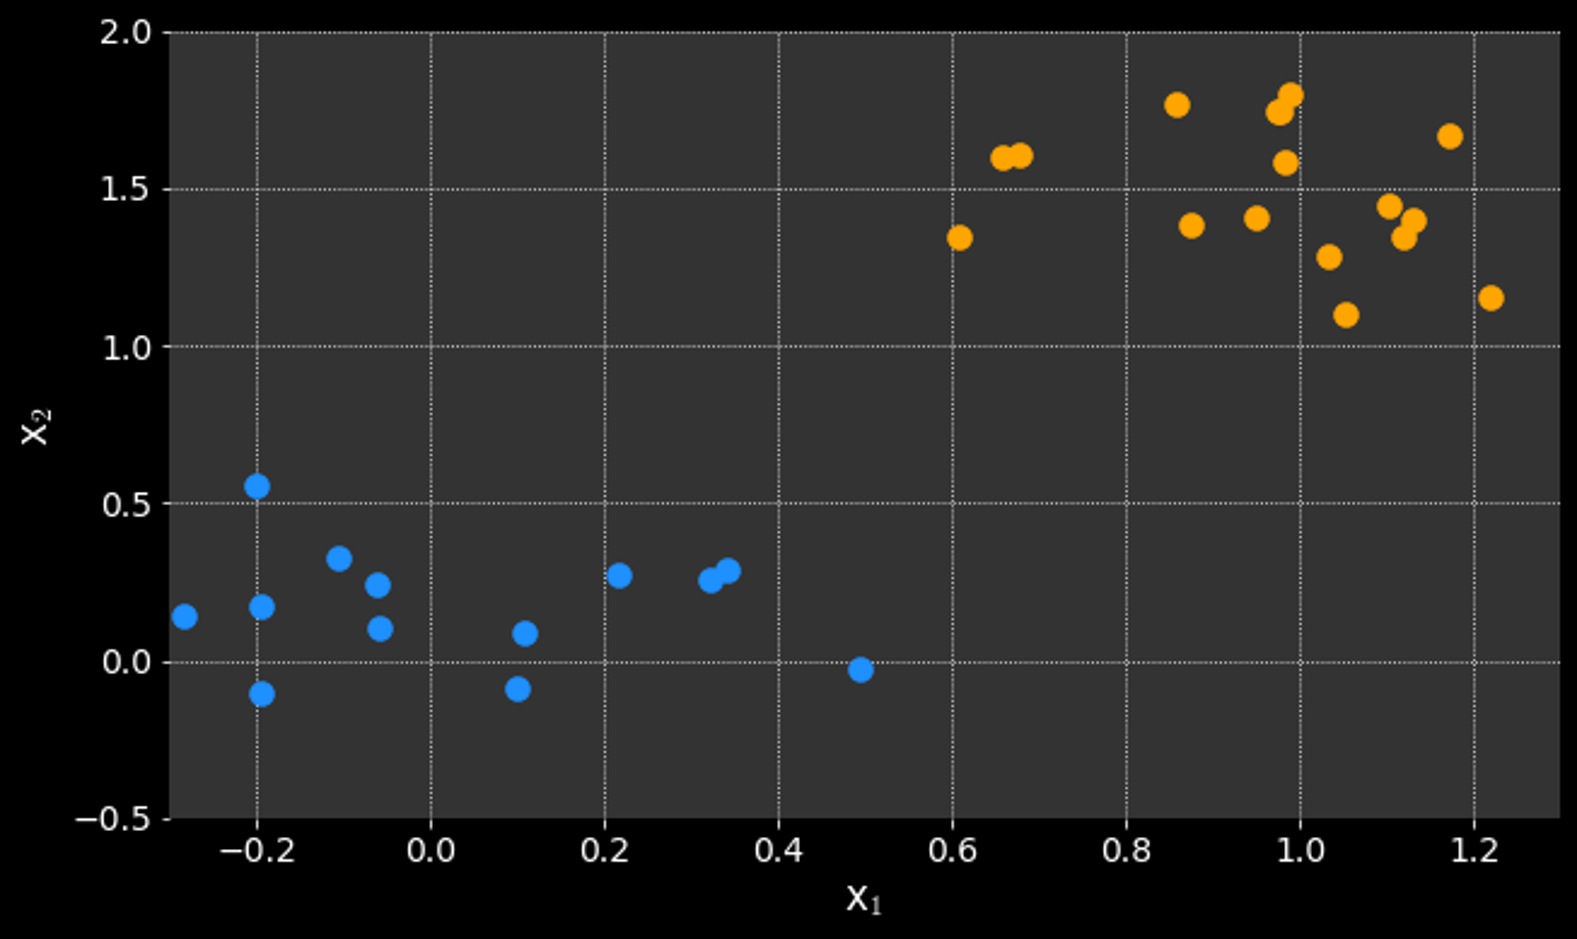
Thinking about the classification problem differently:
Can't we just draw a line that separates the classes?
Logistic regression is a probabilistic approach:
- finds the probability a data point falls in a class
MLPP
Thinking about the classification problem differently:
Can't we just draw a line that separates the classes?
But...which line is "best"?
Logistic regression is a probabilistic approach:
- finds the probability a data point falls in a class
MLPP
Thinking about the classification problem differently:
Can't we just draw a line that separates the classes?
But...which line is "best"?
Logistic regression is a probabilistic approach:
- finds the probability a data point falls in a class
MLPP
Thinking about the classification problem differently:
Can't we just draw a line that separates the classes?
But...which line is "best"?
Logistic regression is a probabilistic approach:
- finds the probability a data point falls in a class
MLPP
Thinking about the classification problem differently:
Can't we just draw a line that separates the classes?
But...which line is "best"?
Logistic regression is a probabilistic approach:
- finds the probability a data point falls in a class
MLPP
Thinking about the classification problem differently:
recall:
To find the "best" line we need a metric to optimize
Can't we just draw a line that separates the classes?
But...which line is "best"?
Logistic regression is a probabilistic approach:
- finds the probability a data point falls in a class
In Support Vector Machines (SVM):
Metric: maximize the gap (aka. "margin") between the classes)
margin
MLPP
Thinking about the classification problem differently:
recall:
To find the "best" line we need a metric to optimize
Can't we just draw a line that separates the classes?
But...which line is "best"?
Logistic regression is a probabilistic approach:
- finds the probability a data point falls in a class
In Support Vector Machines (SVM):
Metric: maximize the gap (aka. "margin") between the classes)
max margin
separating hyperplane
MLPP
Which points should influence the decision?
MLPP
Which points should influence the decision?
Logistic regression:
All points
MLPP
Which points should influence the decision?
Logistic regression:
All points
SVM:
Only the "difficult points" on the decision boundary
MLPP
Which points should influence the decision?
Logistic regression:
All points
SVM:
Only the "difficult points" on the decision boundary
Support Vectors:
Points (vectors from origin) that would influence the decision if moved
Points that only touch the boundary of the margin
support vectors
MLPP
Which points should influence the decision?
Logistic regression:
All points
SVM:
Only the "difficult points" on the decision boundary
Support Vectors:
Points (vectors from origin) that would influence the decision if moved
Points that only touch the boundary of the margin
Separating hyperplane:
or
support vectors
MLPP
Which points should influence the decision?
Objective:
Maximize the margin by minimizing:
Separating hyperplane:
or
support vectors
Constraints:
such that
MLPP
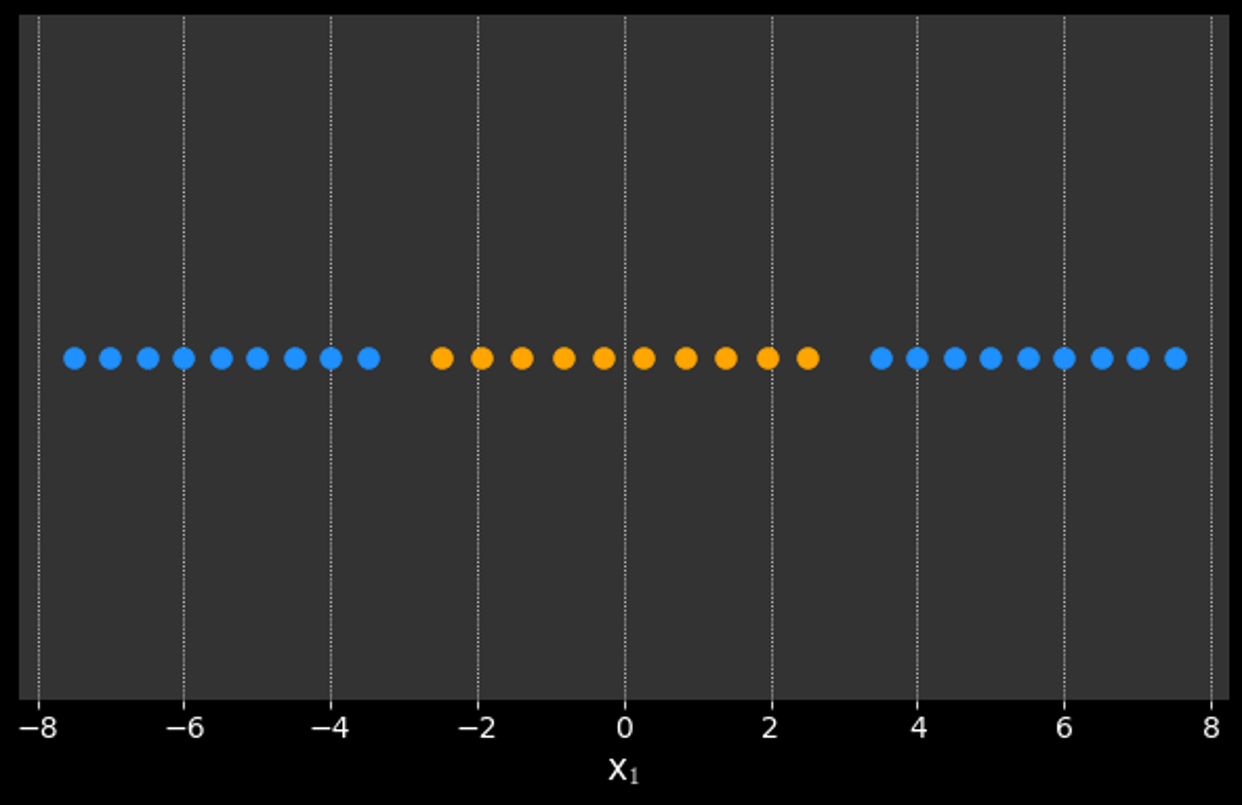
What if it is not possible to cleanly separate the data?
MLPP
What if it is not possible to cleanly separate the data?
MLPP
What if it is not possible to cleanly separate the data?
Minimizing
is known as Hard Margin SVM
MLPP
What if it is not possible to cleanly separate the data?
Minimizing
is known as Hard Margin SVM
Allow for some errors using Soft Margin SVM:
modify the objective and minimize:
where:
for all correctly classified points
and:
distance to boundary for all incorrectly classified points
max margin
MLPP
What if it is not possible to cleanly separate the data?
Minimizing
is known as Hard Margin SVM
Allow for some errors using Soft Margin SVM:
modify the objective and minimize:
where:
for all correctly classified points
and:
distance to boundary for all incorrectly classified points
is the penalty term:
Large c penalizes mistakes - creates hard margin
small c lowers the penalty, allows errors - creates soft margin
max margin
d3
d2
d1
MLPP
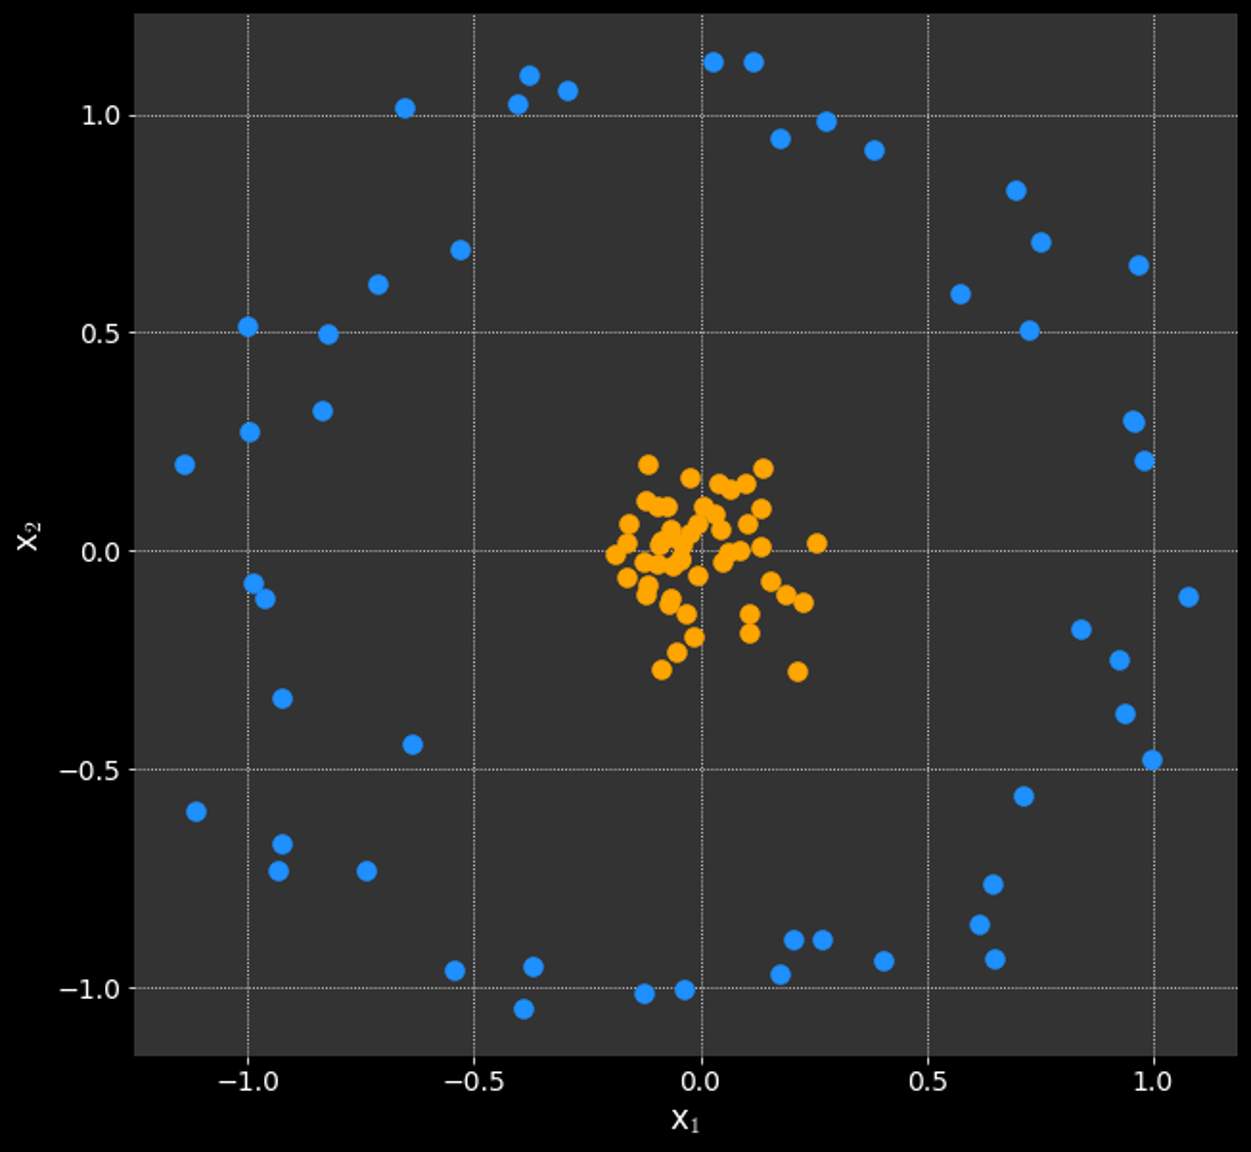
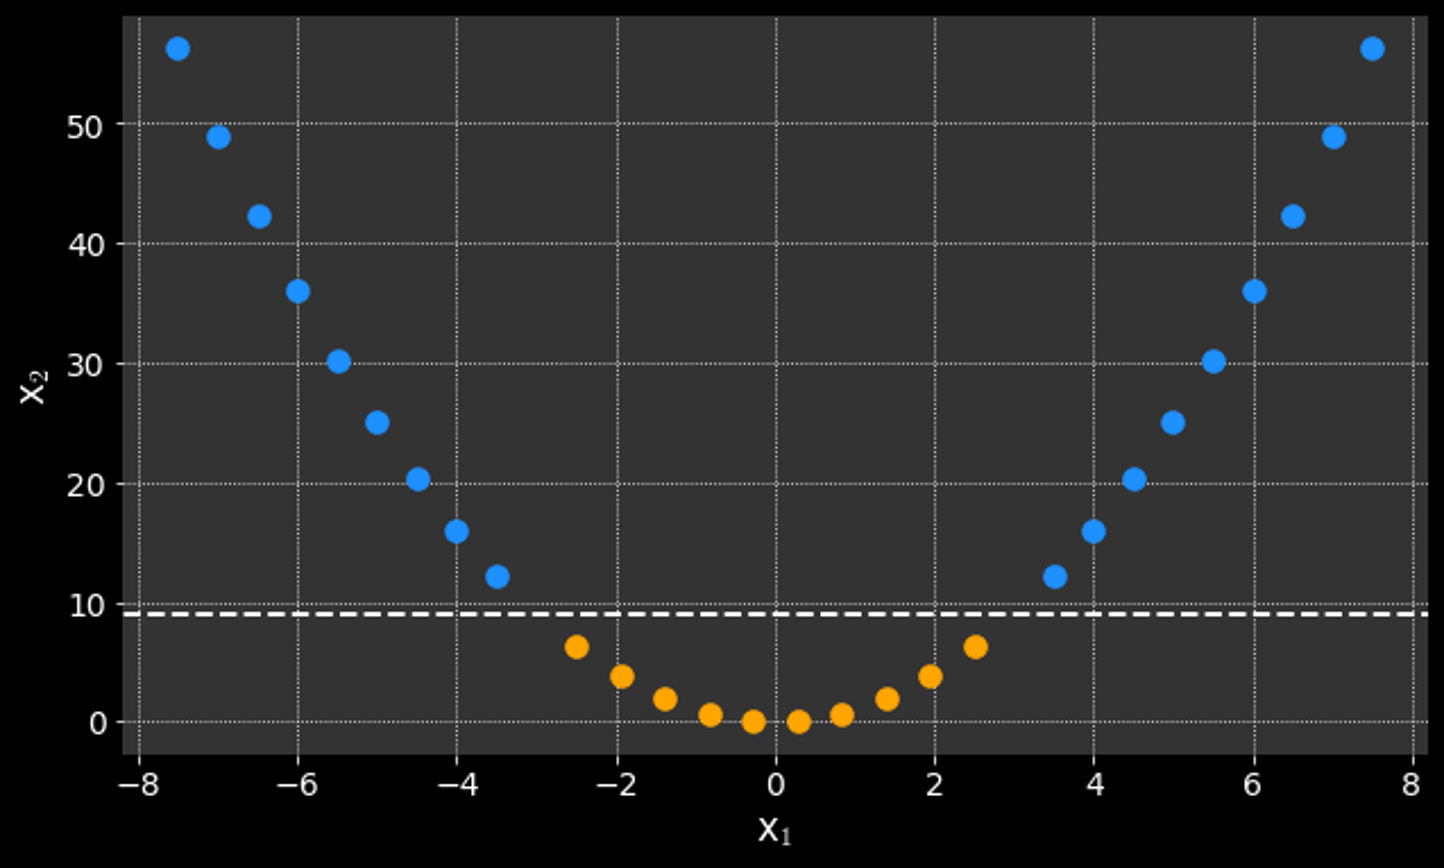
What if the data is not linearly separable?
MLPP
What if the data is not linearly separable?
MLPP
What if the data is not linearly separable?
MLPP
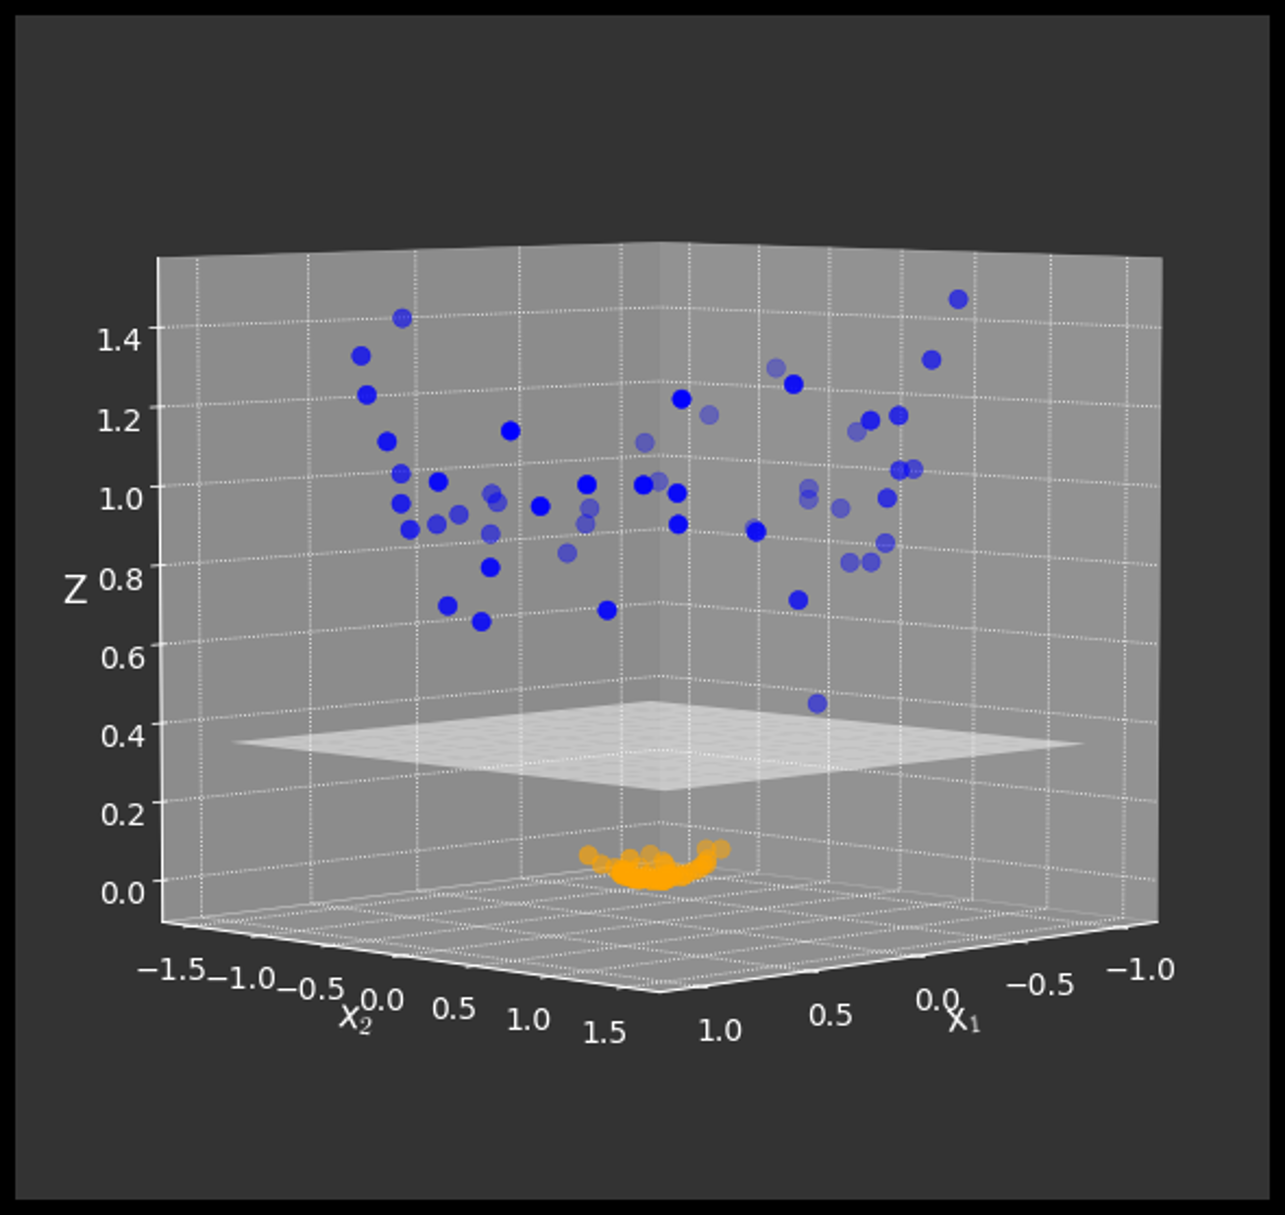
What if the data is not linearly separable?
Kernel Trick:
Using a mathematical function to convert the data into linearly separable sets
MLPP
What if the data is not linearly separable?
Kernel Trick:
Using a mathematical function to convert the data into linearly separable sets
kernel
function
MLPP
What if the data is not linearly separable?
Kernel Trick:
Using a mathematical function to convert the data into linearly separable sets
kernel
function
kernel
function
MLPP
What if the data is not linearly separable?
Kernel Trick:
Using a mathematical function to convert the data into linearly separable sets
kernel
function
kernel
function
Some kernel Types:
Linear kernel ("Non-kernel")
Polynomial kernel
Sigmoid kernel
Radial Basis Function (RBF) kernel
MLPP
Logistic Regression:
Support Vector Machines
By Farid Qamar


