


federica bianco PRO
astro | data science | data for good
Federica B. Bianco
University of Delaware
Physics and Astronomy
Biden School of Public Policy and Administration
Data Science Institute
Historical perspective
1/6
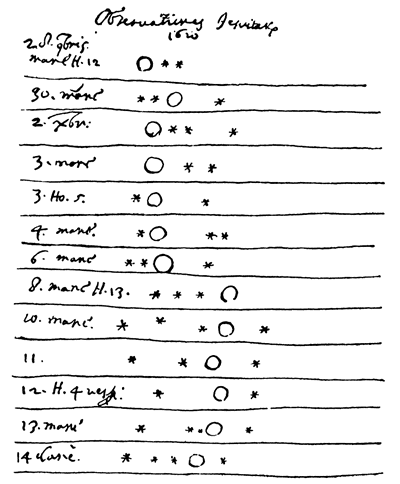
Galileo Galilei 1610
Following: Djorgovski
https://events.asiaa.sinica.edu.tw/school/20170904/talk/djorgovski1.pdf
Experiment driven
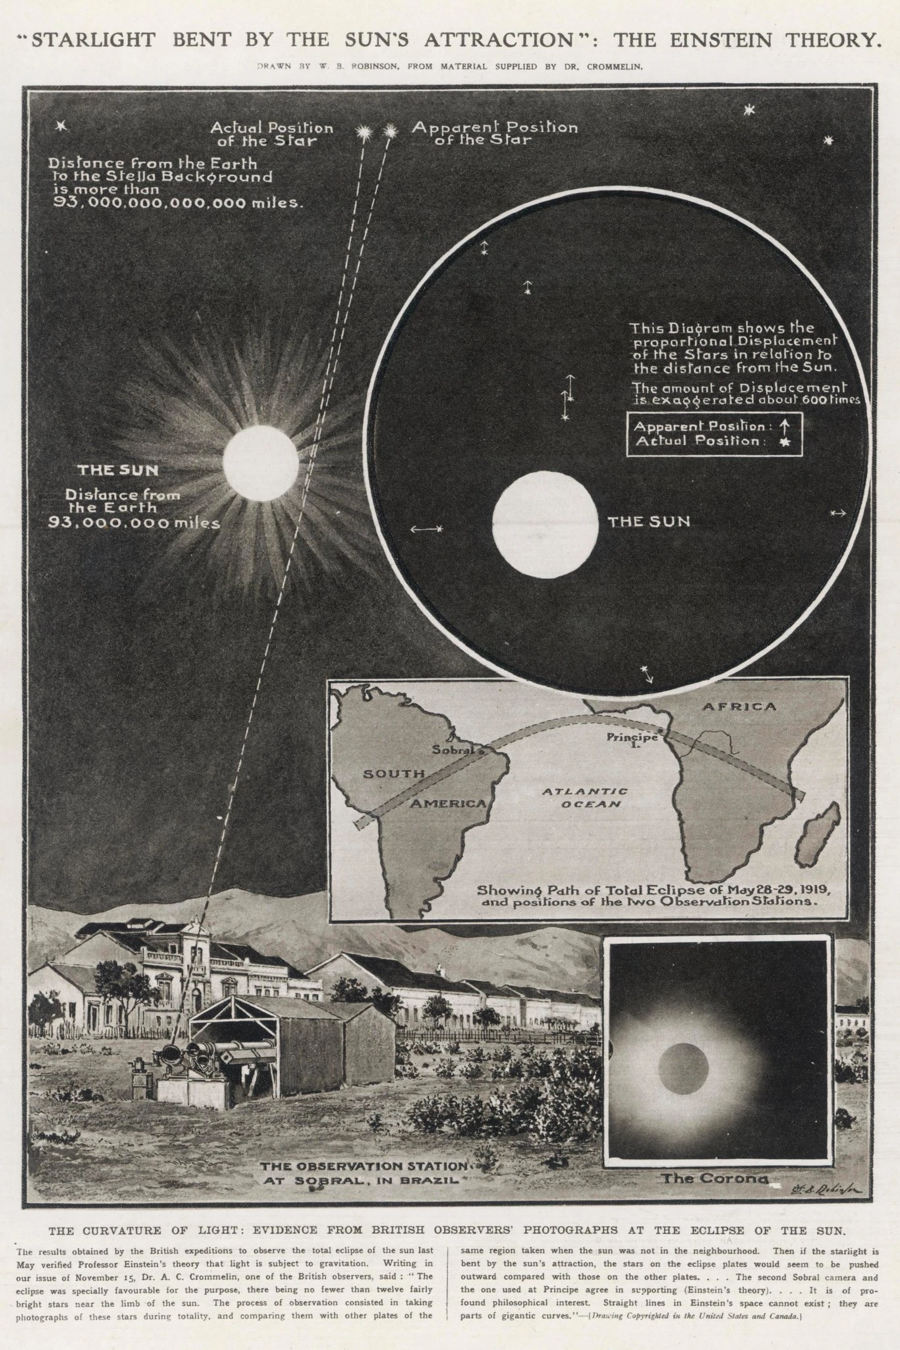
Enistein 1916
Theory driven | Falsifiability
Experiment driven
Theory driven | Falsifiability
Experiment driven
Simulations | Probabilistic inference | Computation
the 1947-today
the 2000s-2010s
Theory driven | Falsifiability
Experiment driven
Simulations | Probabilistic inference | Computation
Data | Survey astronomy | Computation | Pattern Discovery
from commissioniong observation
to scanning the sky and giving away the data (open science model!)
experiment driven science -∞:1900
theory driven science 1900-1950
data driven science 1990-2010
the fourth paradigm - Jim Gray, 2009
computationally driven science 1950-1990
AI driven science? 2010...
https://app.sli.do/event/qxbWnfzkJyT3SvbeKi3rwd
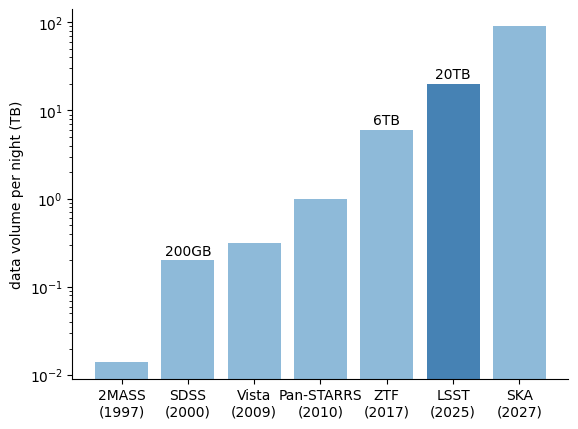
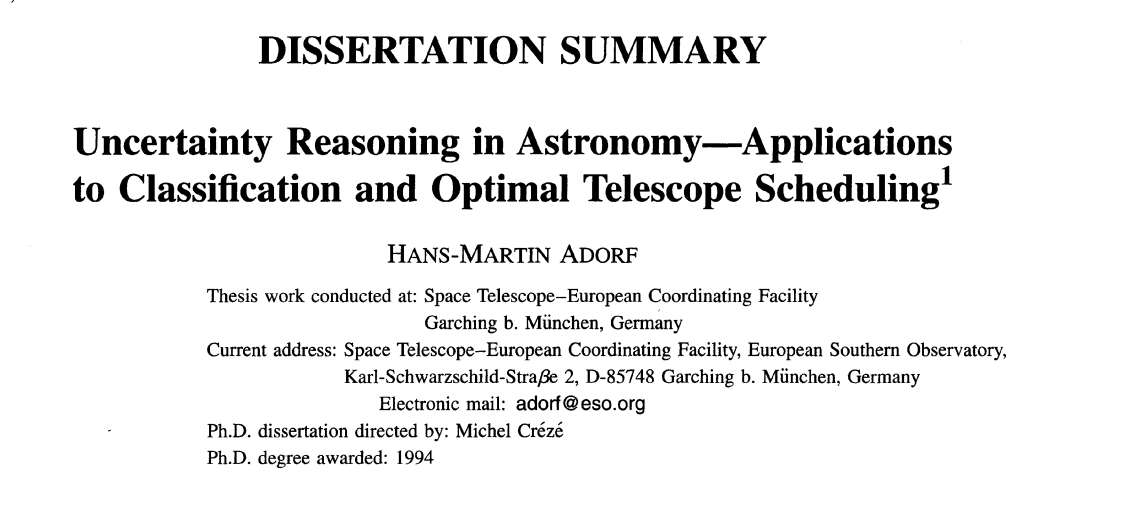
when did the first Neural Network in astronomy review came out?
number of arXiv:astro-ph submissions with abstracts containing one or more of the strings: ‘machine learning’, ‘ML’, ‘artificial intelligence’, ‘AI’, ‘deep learning’ or ‘neural network’.
Artificial Intelligence:
enable machines to make decisions without being explicitly programmed
Machine Learning:
machines learn directly from data and examples
Data Science: the field of studies that deals with the extraction of information from data within a domain context to enable interpretation and prediction of phenomena.
This includes development and application of statistical tools and machine learning and AI methods
Deep Learning
(Neural Networks)
DATA
MODEL
PRACTICE
Complex Large Data
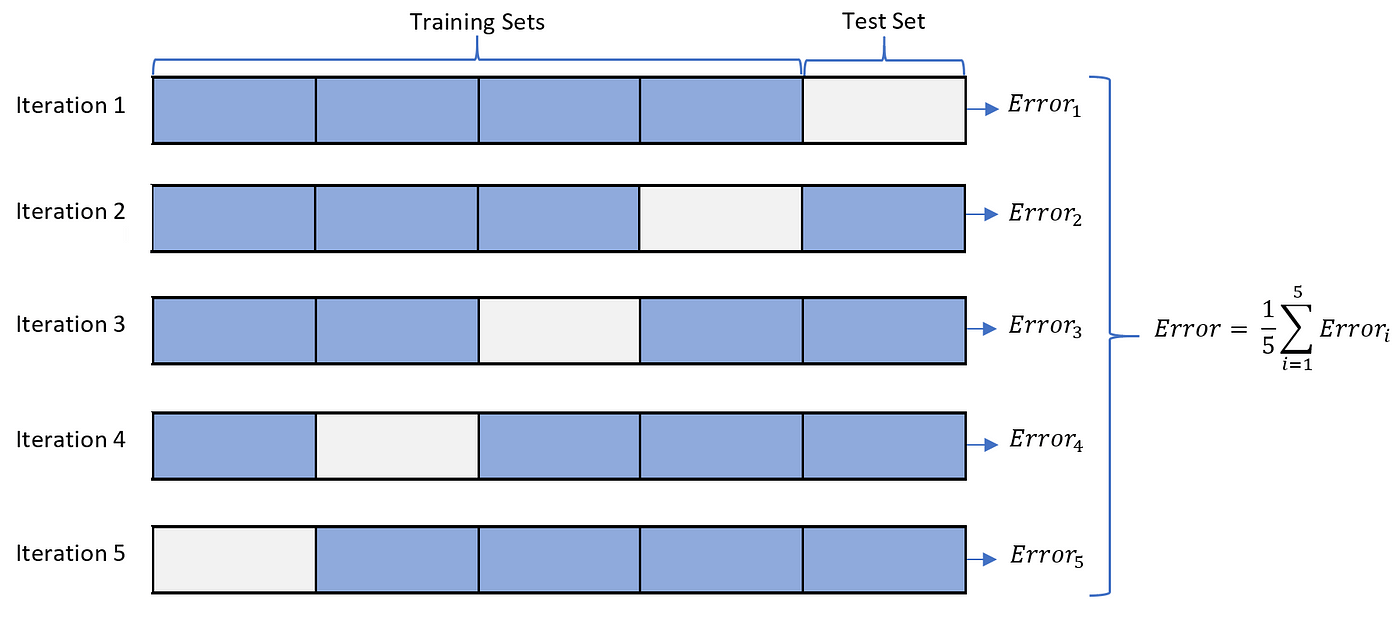
whitening
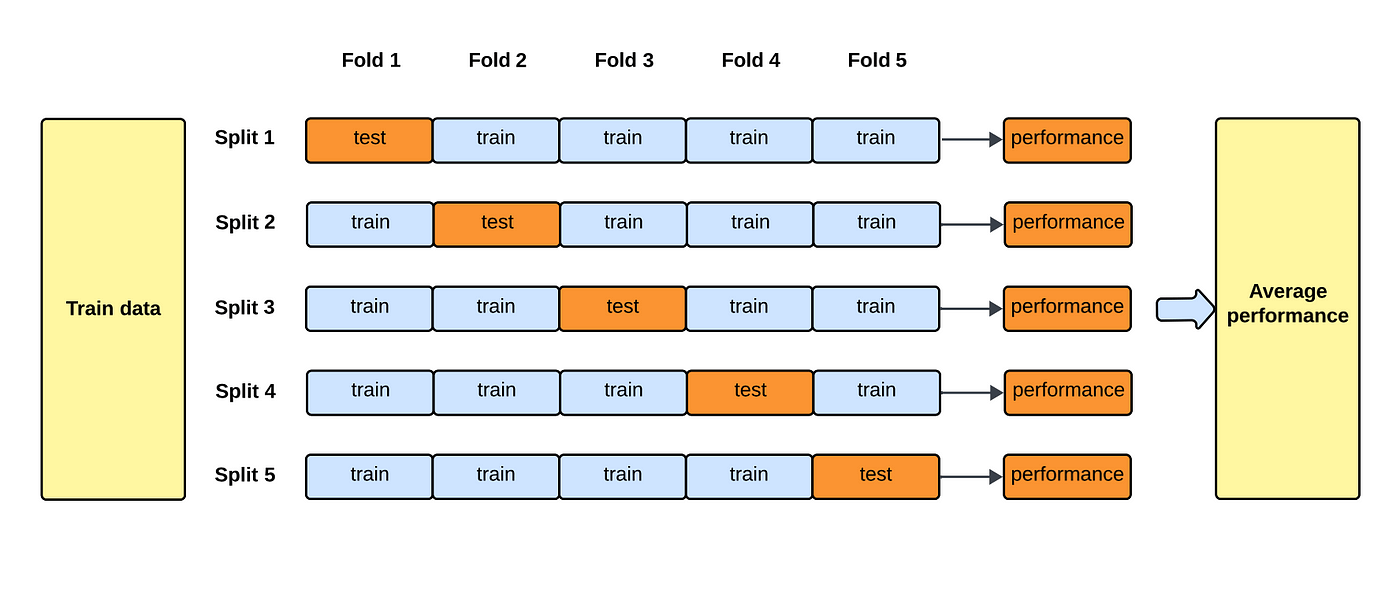
cross validation
Flexible non-linar models
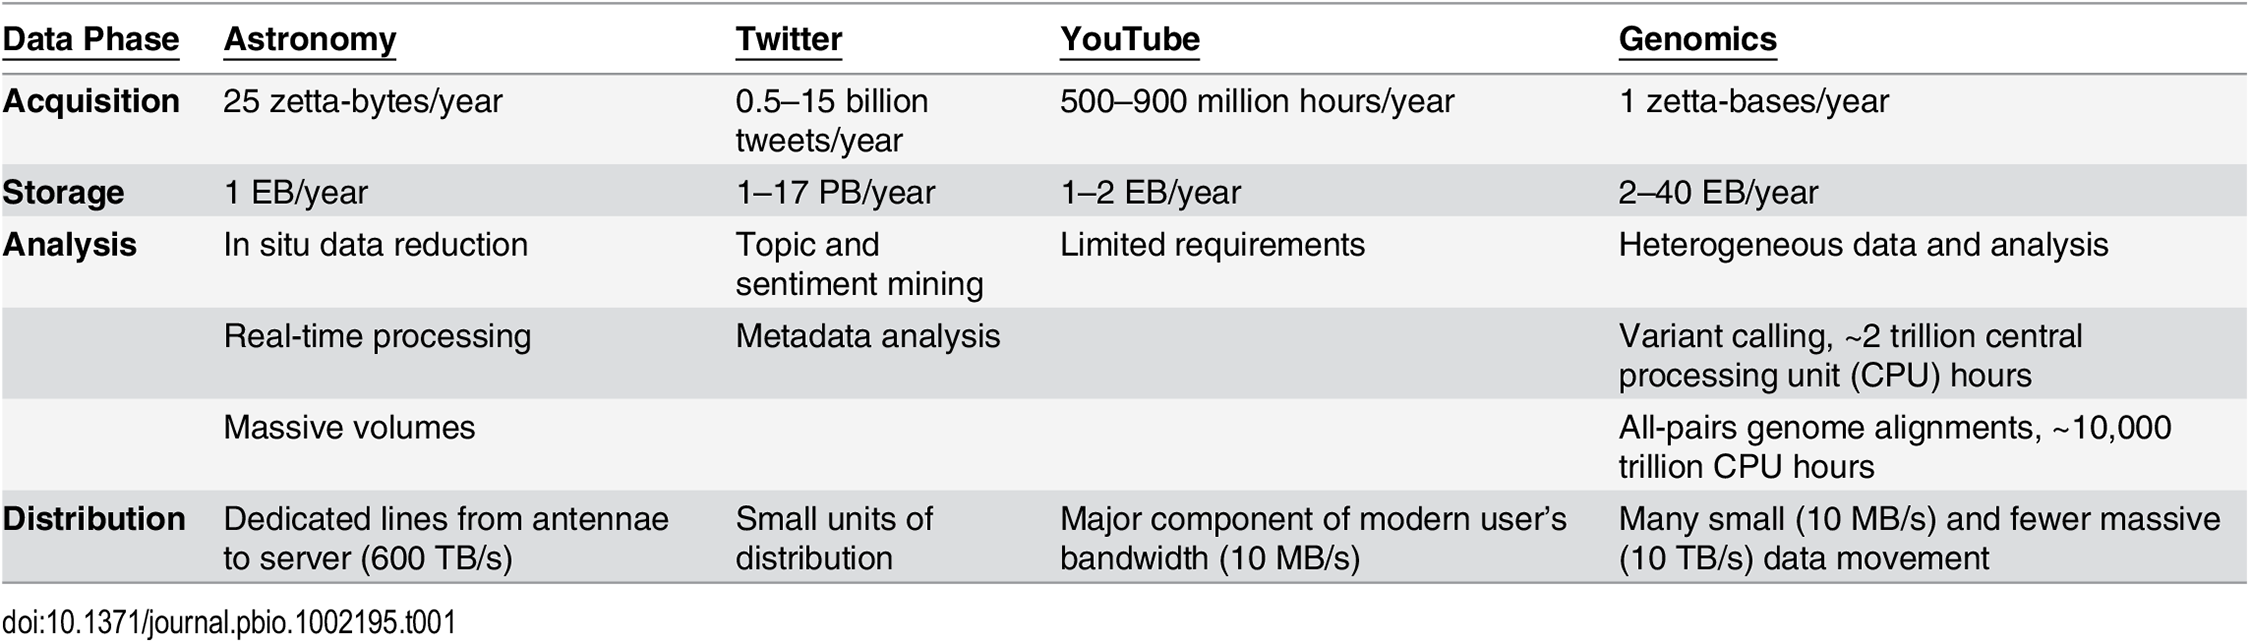
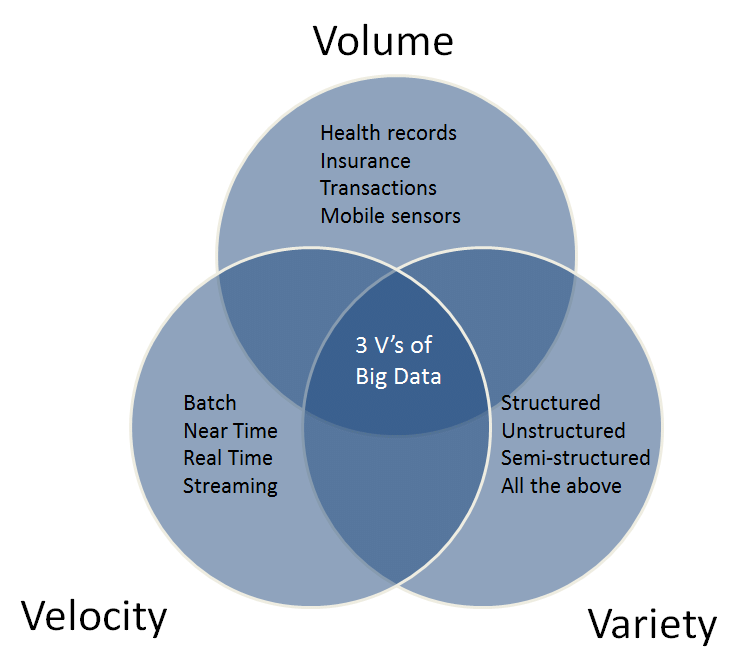
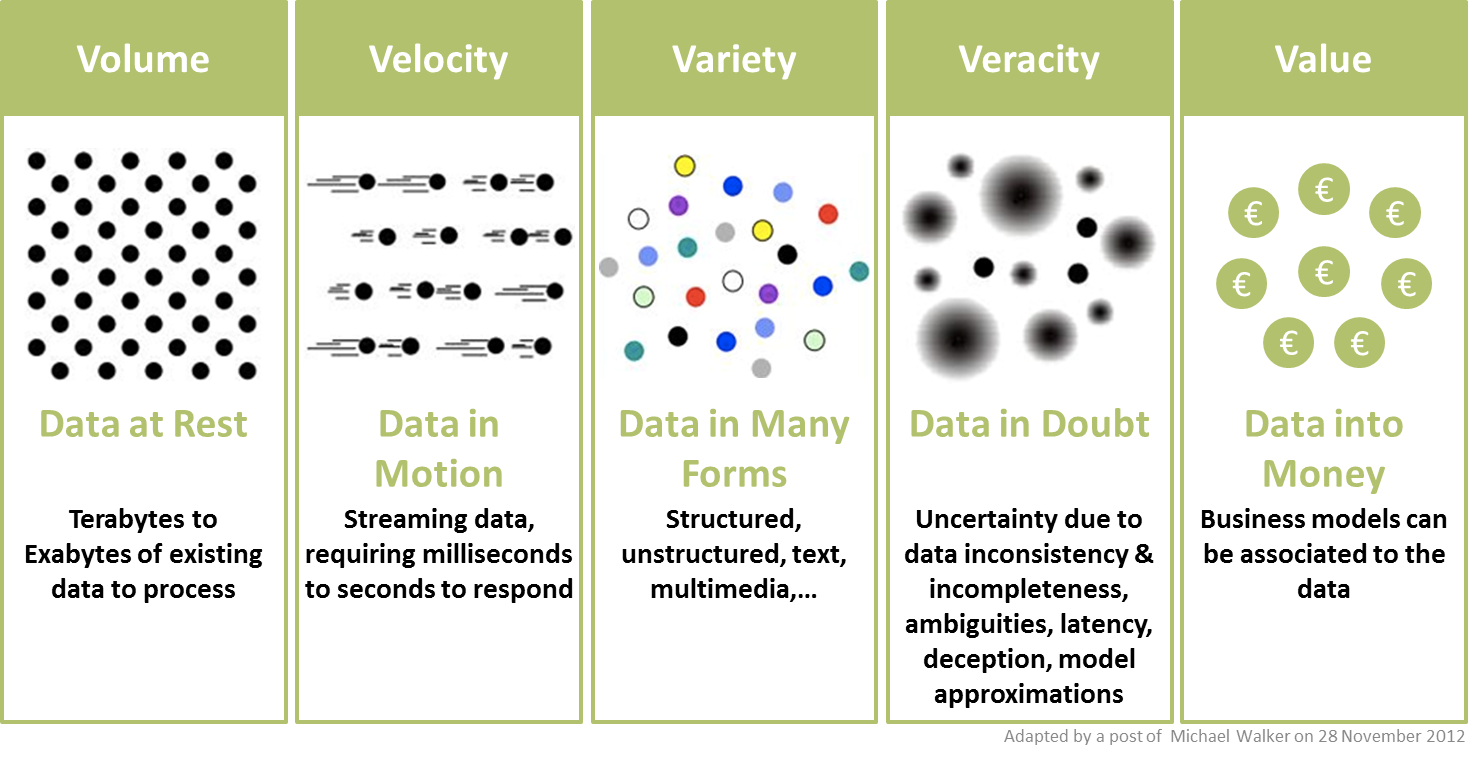
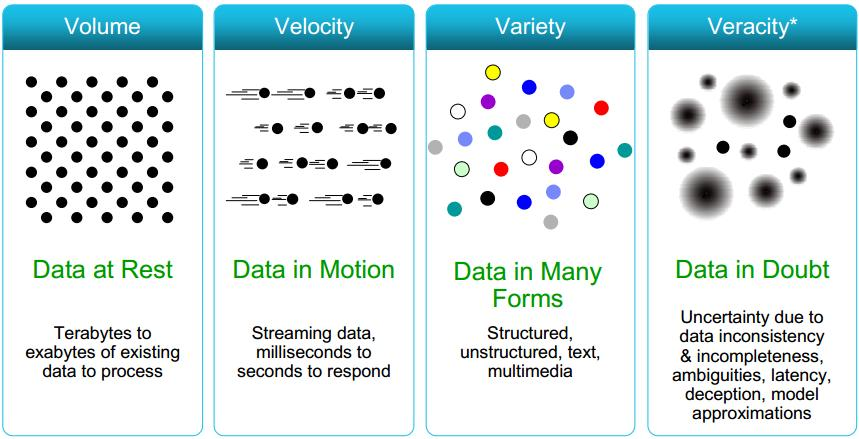
Gartner report 2001
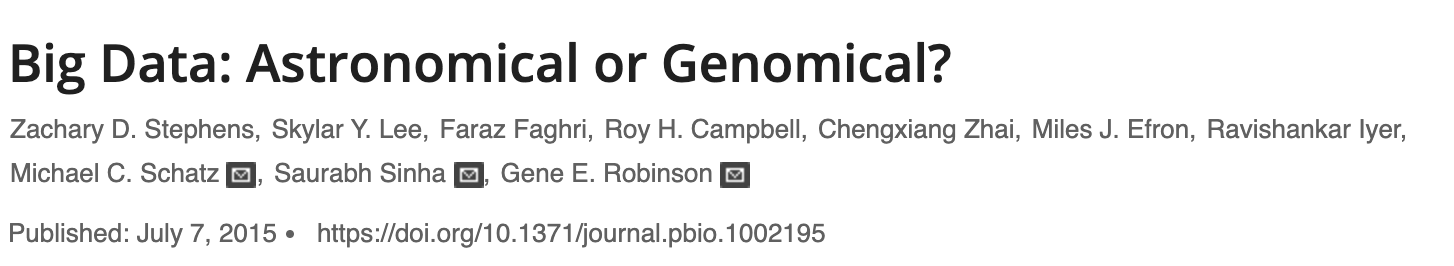
V1: Volume
Number of bites
Number of pixels
Number of astrophysical objects in a data x number of featured measured
V2: Variety
Diverse science return from the same dataset
e.g. cosmology+stellar physics
cosmo
Multiwavelength
Multimessenger
Images and spectra
V4: Veracity
This V will refer to both data quality and availability (added in 2012)
Inclusion of uncertainty in inference and simulations
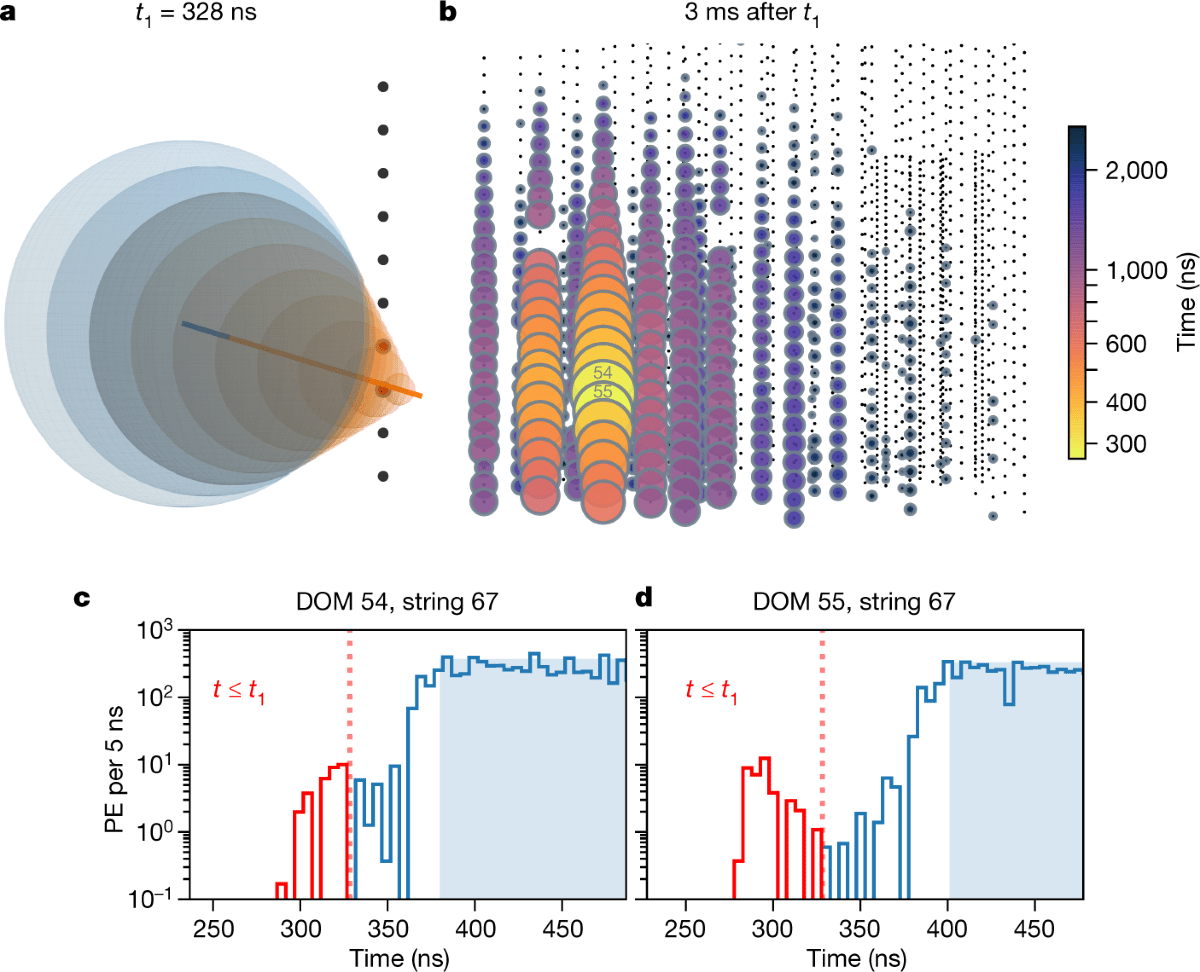
V3: Velocity
Real time analysis, edge computing, data transfer
IceCube edge computing
Gartner report 2001
Gartner report 2001
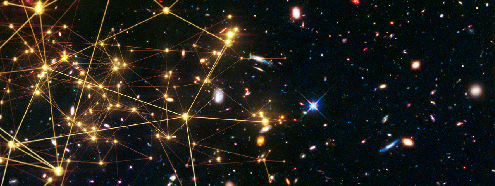
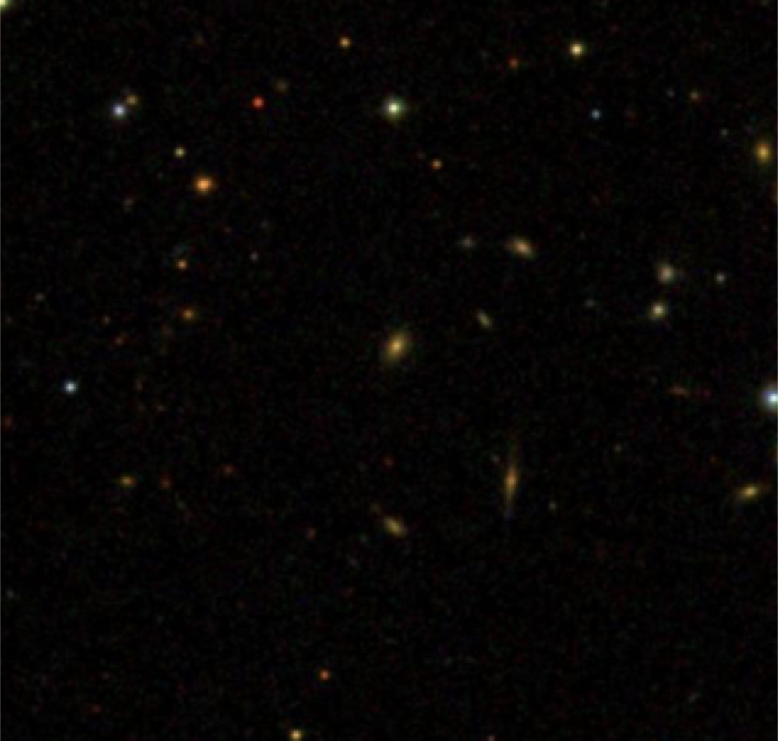
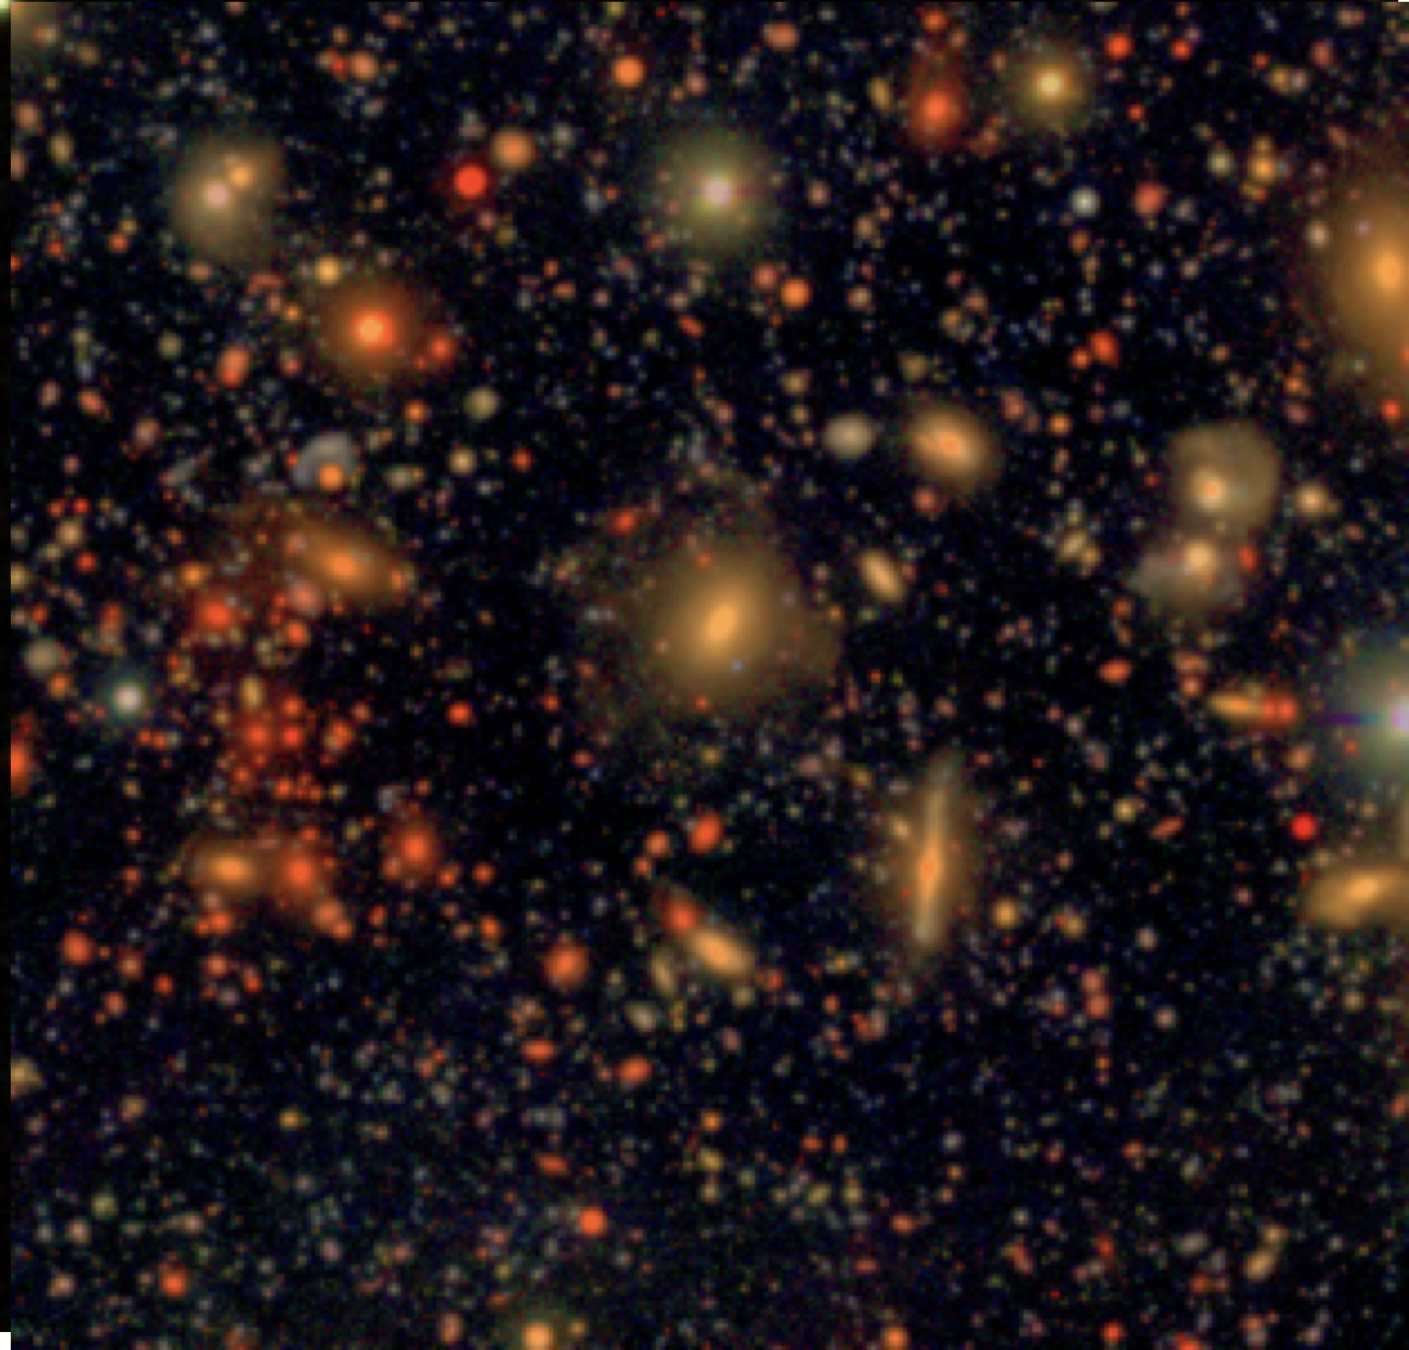
Exquisite image quality
all over the sky
over and over again
SDSS image circa 2000
HSC image circa 2018
when you look at the sky at this resolution and this depth...
everything is blended and everything is changing
Gartner report 2001
Gartner report 2001
Text
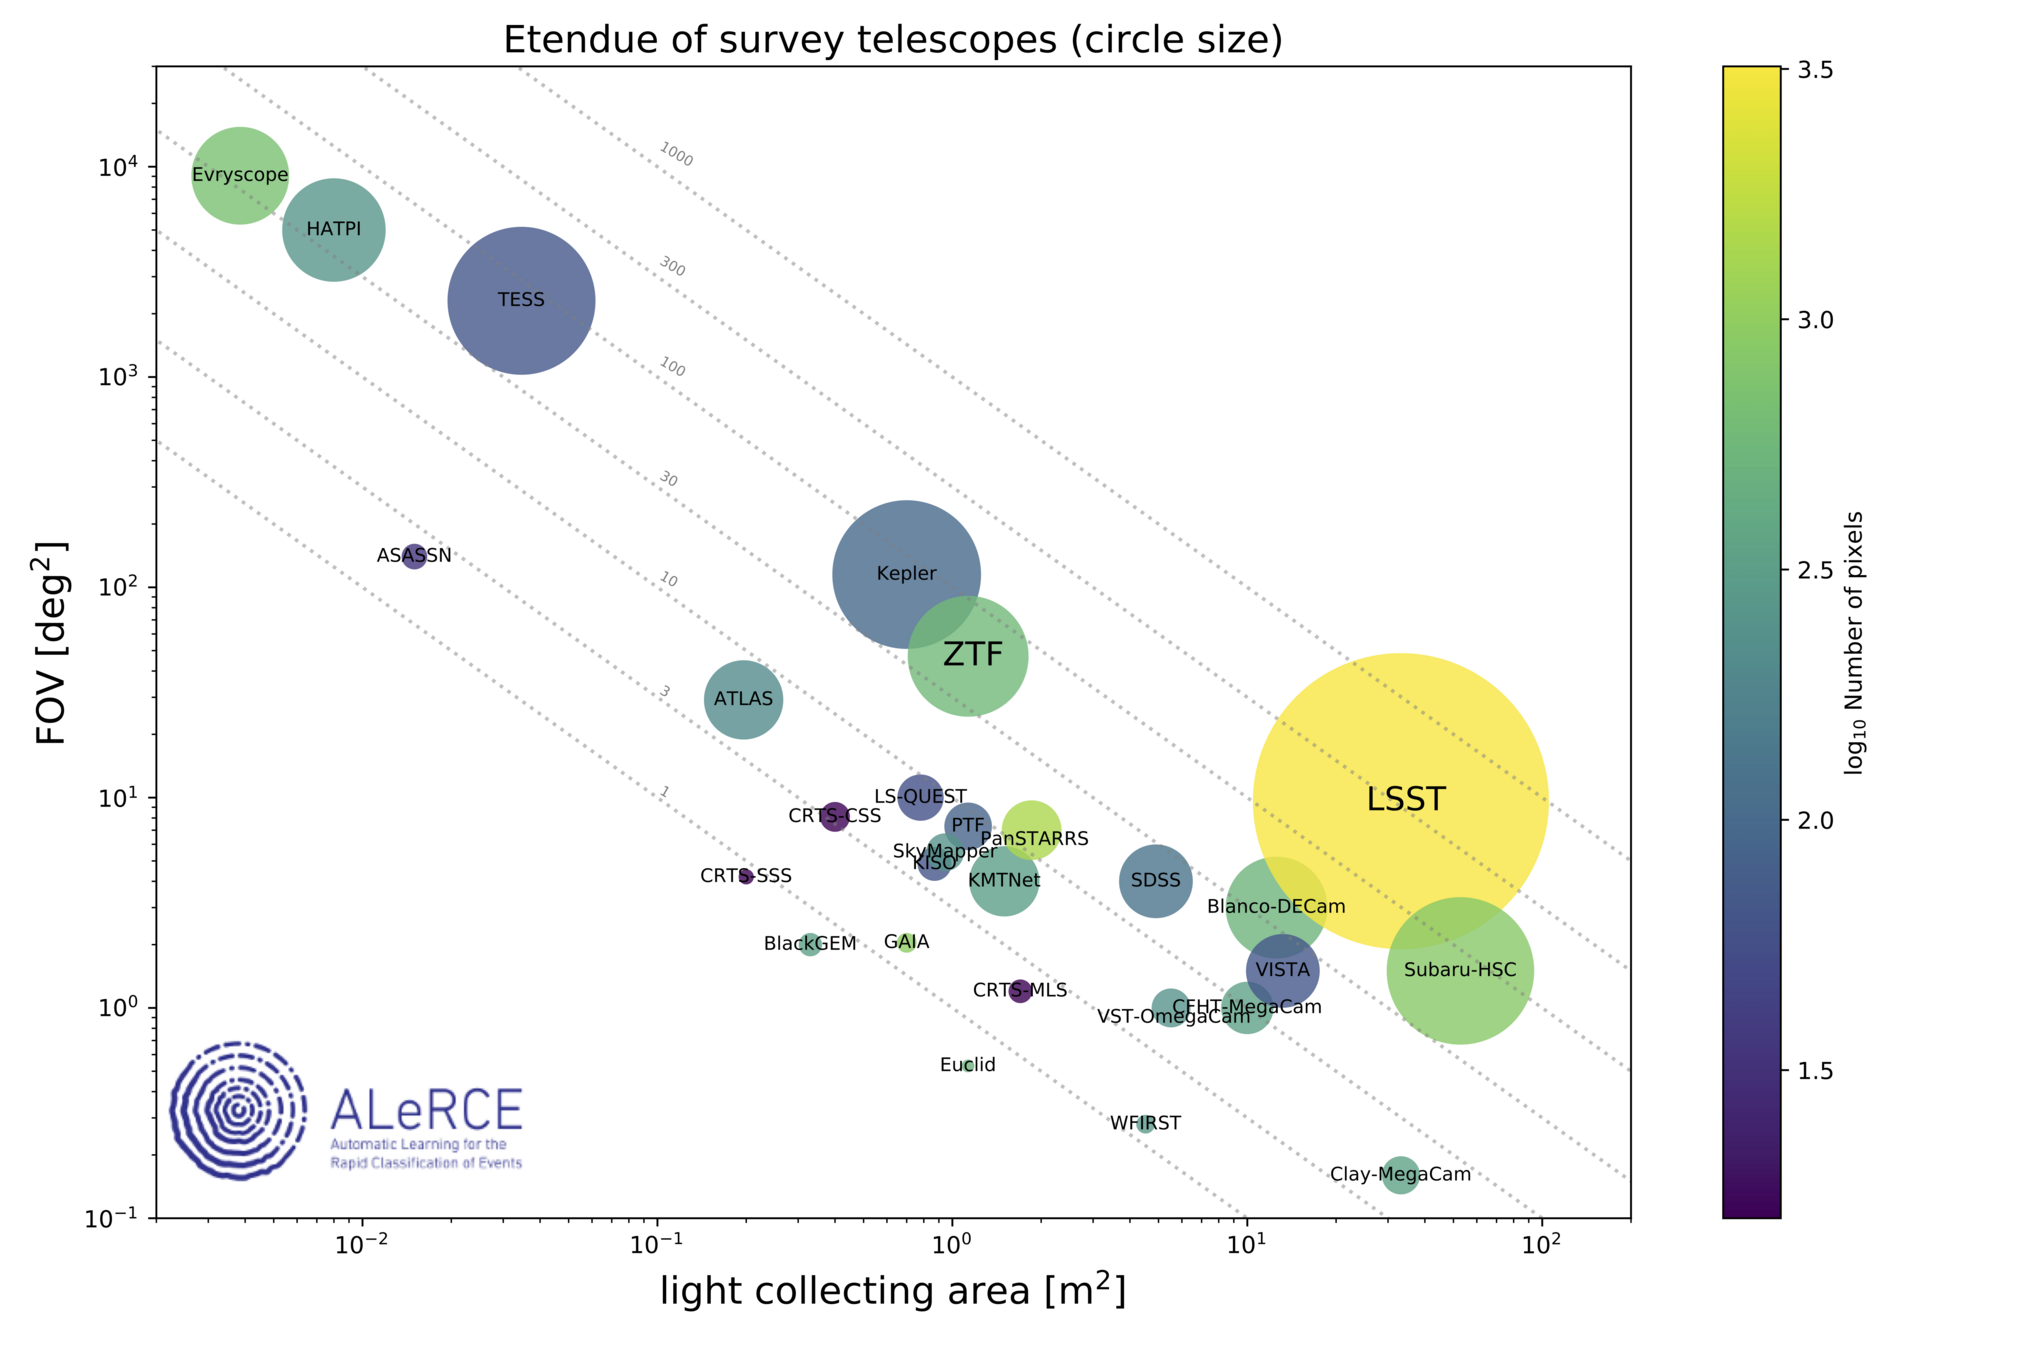
log number of Megapixels
1.5 2.0 2.5 3.0 3.5
Etendue: area x FoV
Exquisite image quality
all over the sky
over and over again
SDSS image circa 2000HSC image circa 2018when you look at the sky at this resolution and this depth...
everything is blended and everything is changing
Gartner report 2001
Gartner report 2001
Text
Exquisite image quality
all over the sky
over and over again
SDSS image circa 2000HSC image circa 2018when you look at the sky at this resolution and this depth...
everything is blended and everything is changing
Gartner report 2001
Gartner report 2001
Text
The IceCube collaboration
Nature 591, 220–224 (2021)
DATA
MODEL
PRACTICE
Complex Large Data
whitening
cross validation
Flexible non-linar models
[Machine Learning is the] field of study that gives computers the ability to learn without being explicitly programmed.
Arthur Samuel, 1959
a model is a low dimensional representation of a higher dimensionality dataset
What is a model in ML
ML: any model with parameters learnt from the data
dimensionality of the model: number of parameters
What is a model in ML
Machine Learning models are parametrized representation of "reality" where the parameters are learned from finite sets (the sample) of realizations of that reality (the population)
(note: learning by instance, e.g. nearest neighbours, may not comply to this definition)
Machine Learning is the disciplines that conceptualizes, studies, and applies those models.
Key Concept
what is machine learning?
DATA
MODEL
PRACTICE
Complex Large Data
whitening
cross validation
Flexible non-linar models
DATA
MODEL
PRACTICE
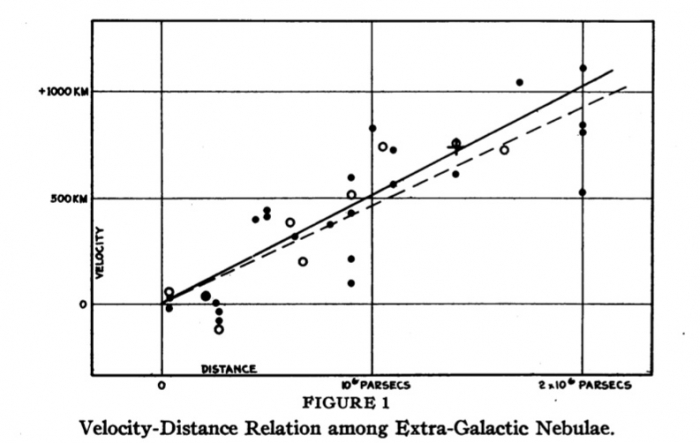
Hubble in 1929
Emphasis on transferability of the model to unseen data
AI "Learning"
2/6
Input
x
y
output
data
prediction
physics
Input
x
y
output
function
Input
x
y
output
b
m
m: slope
b: intercept
Input
x
y
output
b
m
m: slope
b: intercept
parameters
Input
x
y
output
b
m
m: slope
b: intercept
parameters
x
y
goal: find the right m and b that turn x into y
goal: find the right m and b that turn x into y
Input
x
y
output
b
m
m: slope
b: intercept
parameters
x
y
learn
goal: find the right m and b that turn x into y
goal: find the right m and b that turn x into y
Input
x
y
output
m = 0.4 and b=0
m: slope
b: intercept
parameters
x
let's try
goal: learn the right m and b that turn x into y
unsupervised vs supervised learning
Clustering
understand the structure of a feature space
All features are observed for all datapoints
Clustering
partitioning the feature space so that the existing data is grouped (according to some target function!)
Unsupervised learning
All features are observed for all datapoints
unsupervised vs supervised learning
understand the structure of a feature space
Clustering
partitioning the feature space so that the existing data is grouped (according to some target function!)
Unsupervised learning
All features are observed for all datapoints
unsupervised vs supervised learning
understand the structure of a feature space
Clustering
partitioning the feature space so that the existing data is grouped (according to some target function!)
Unsupervised learning
All features are observed for all datapoints
unsupervised vs supervised learning
understand the structure of a feature space
Clustering
partitioning the feature space so that the existing data is grouped (according to some target function!)
Classifying & regression
Unsupervised learning
All features are observed for all datapoints
unsupervised vs supervised learning
prediction and classification based on examples
Some features not observable & we want to predict them.
Classifying & regression
finding functions of the variables that allow to predict unobserved properties of new observations
prediction and classification based on examples
Clustering
partitioning the feature space so that the existing data is grouped (according to some target function!)
Unsupervised learning
All features are observed for all datapoints
Some features not observable & we want to predict them.
unsupervised vs supervised learning
Classifying & regression
Supervised learning
prediction and classification based on examples
Clustering
partitioning the feature space so that the existing data is grouped (according to some target function!)
Unsupervised learning
All features are observed for all datapoints
finding functions of the variables that allow to predict unobserved properties of new observations
Some features not observable & we want to predict them.
unsupervised vs supervised learning
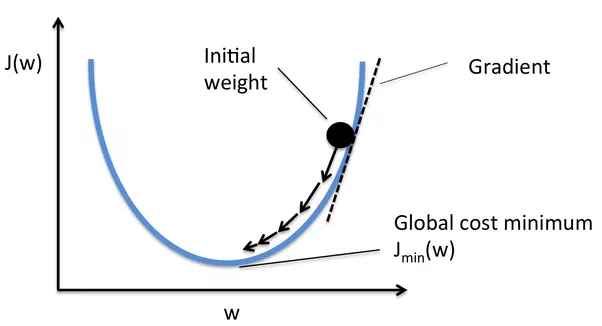
The Loss function
Supervised learning
Unsupervised learning
model parameter
Loss function
Physics informed AI
Application regime:
-infinity - 1950's
theory driven: little data, mostly theory, falsifiability and all that...
-1980's - today
data driven: lots of data, drop theory and use associations, black-box modles
Application regime:
-infinity - 1950's
theory driven: little data, mostly theory, falsifiability and all that...
-1980's - today
data driven: lots of data, drop theory and use associations, black-box modles
lots of data yet not enough for entirely automated decision making
complex theory that cannot be solved analytically
combine it with some theory
Non Linear PDEs are hard to solve!
via a modified loss function that includes residuals of the prediction and residual of the PDE
Non Linear PDEs are hard to solve!
Raissi, Perdikaris, Karniadakis 2017
Unsupervised learning
Supervised learning
All features are observed for all datapoints
and we are looking for structure in the feature space
Some features are not observed for some data points we want to predict them.
The datapoints for which the target feature is observed are said to be "labeled"
Semi-supervised learning
Active learning
A small amount of labeled data is available. Data is cluster and clusters inherit labels
The code can interact with the user to update labels and update model.
also...
different flavors of learning
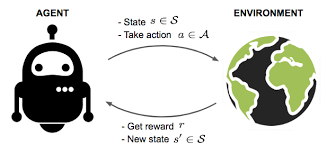
Reinforcement Learning
reward vs loss
delayed feedback from the changes in the environment
different flavors of learning
Reinforcement Learning
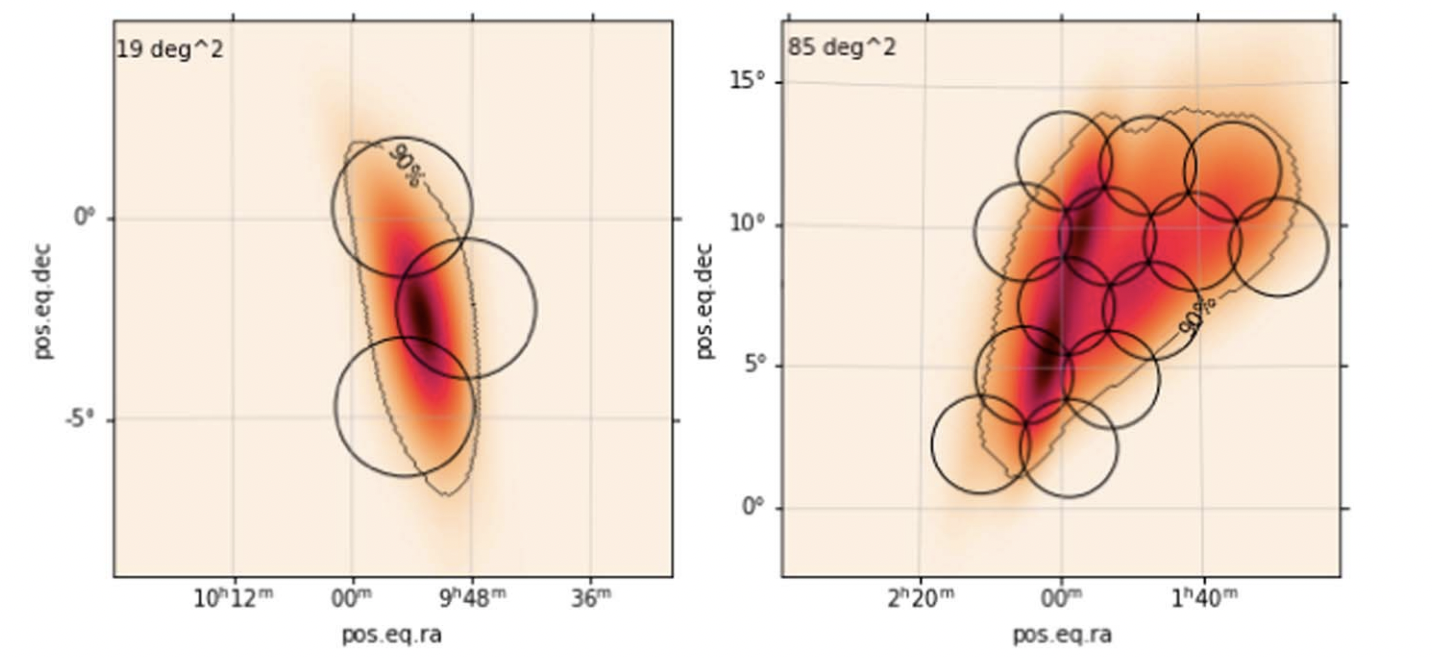
E.g. Selection of follow-up targets in Multi Messenger Astronomy
different flavors of learning
reward vs loss
delayed feedback from the changes in the environment
Andreoni+ 2022b
+80 authors!
PROS:
Large FoV (10 sq deg - easly cover 100 sq deg in full)
6 filters (5 available on any given night)
deep observations (r~24 in 30 sec, up to 180 sec)
public data
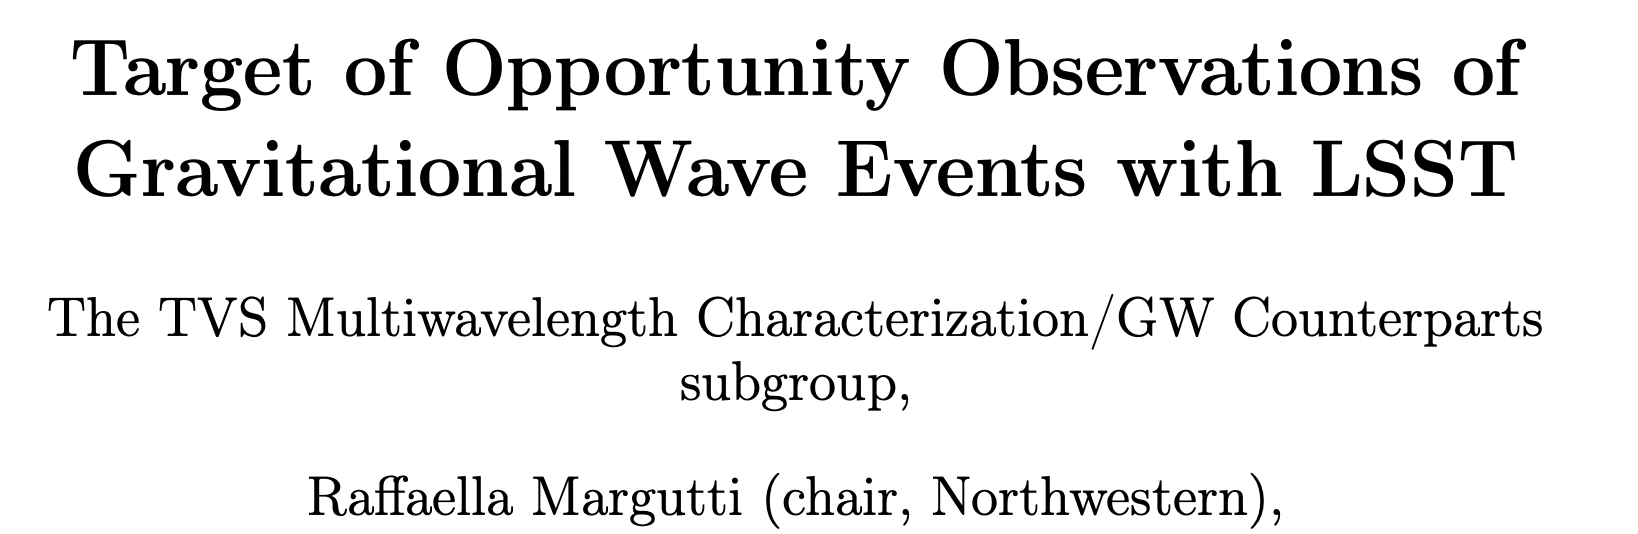
Registration for online participation open through March 15th!
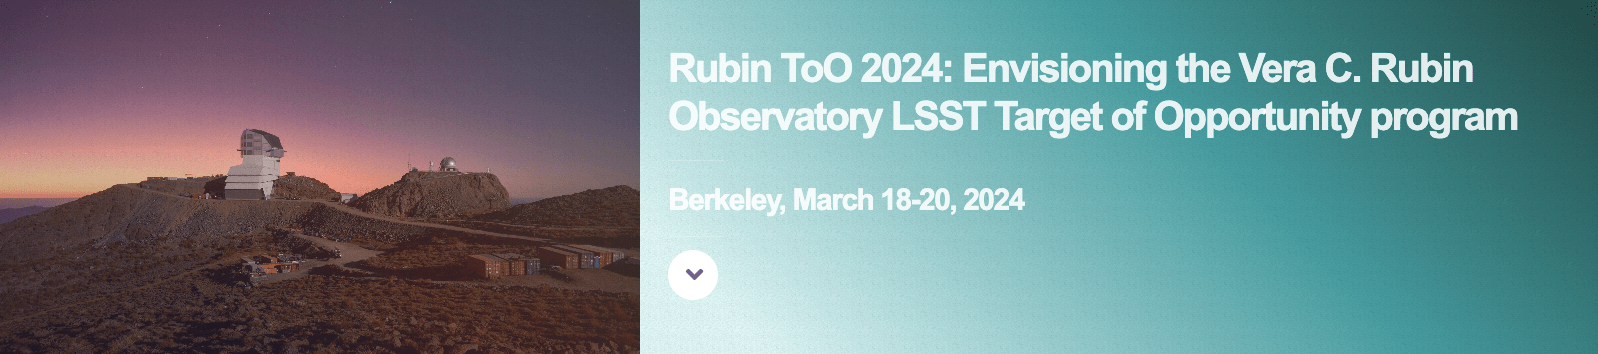
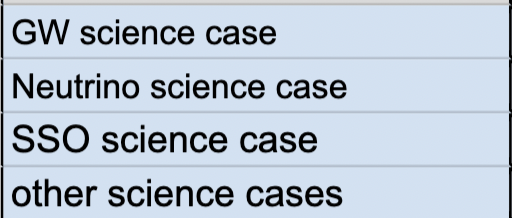
This is a workshop: the goal of the workshop is to produce a report to be delivered to the SCOC containing recommendations for how to implement ToO responses with Rubin. There are no talks.Time is dedicated to collaboratively working toward the workshop report.
SOC: I. Andreoni (KN), F. Bianco, A. Franckowiak (ν), T. Lister (Solar System),
R. Margutti (KN, GRB), G. Smith (Lensed KN)
Deep Learning
3/6
Input
x
y
output
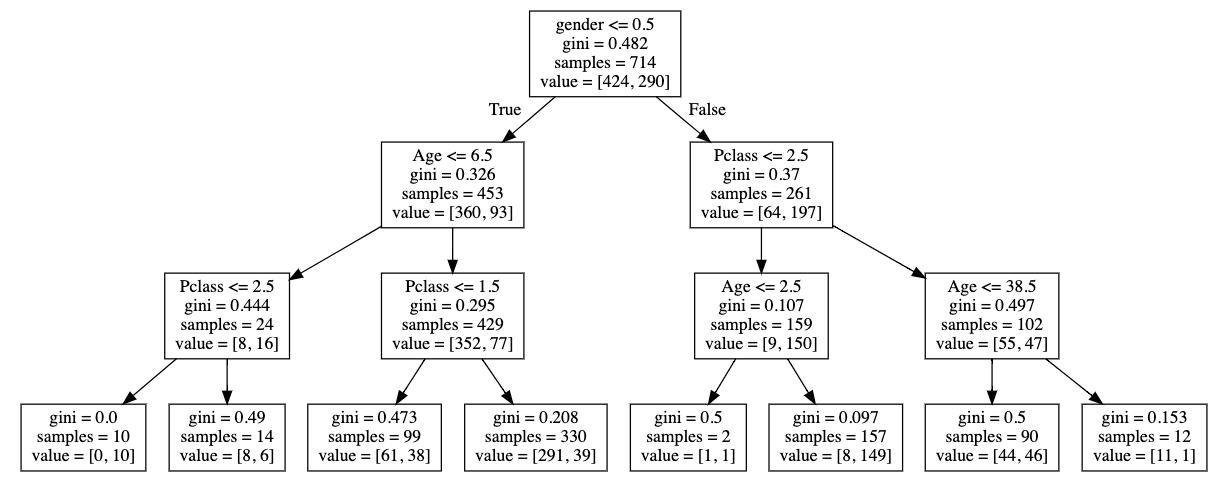
Tree models
(at the basis of Random Forest
Gradient Boosted Trees)
nodes
(make a decision)
root node
branches
(split off of a node)
leaves (last groups)
Tree models
(at the basis of Random Forest
Gradient Boosted Trees)
p(class)
extracted
features vector
p(class)
pixel values tensor
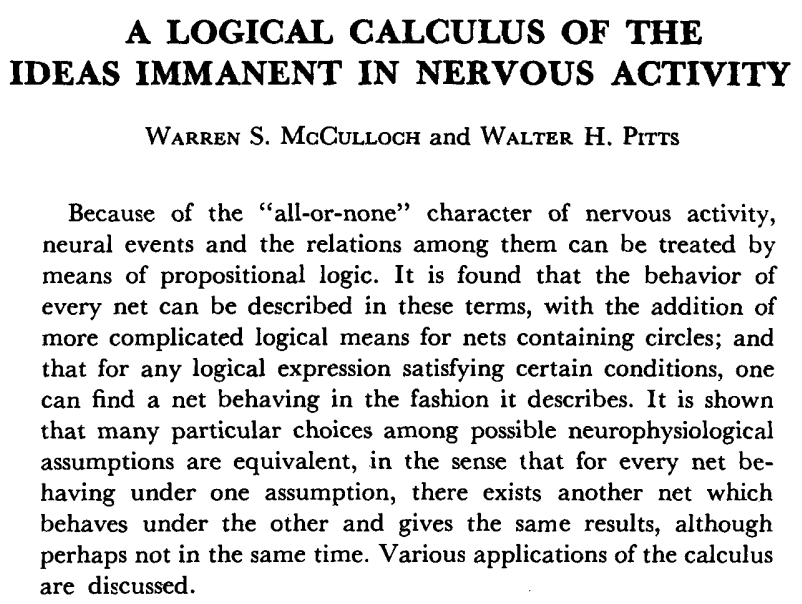
1943
M-P Neuron McCulloch & Pitts 1943
M-P Neuron
1943
M-P Neuron McCulloch & Pitts 1943
M-P Neuron
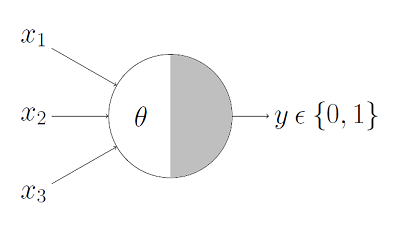
M-P Neuron
w1
w1
w2
w2
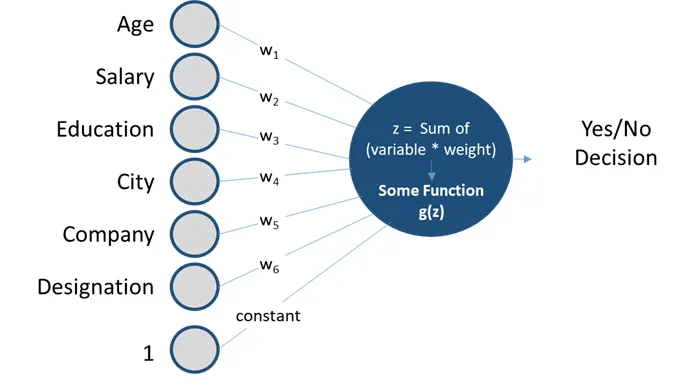
The perceptron algorithm : 1958, Frank Rosenblatt
1958
Perceptron
The perceptron algorithm : 1958, Frank Rosenblatt
.
.
.
output
weights
bias
linear regression:
1958
Perceptron
.
.
.
output
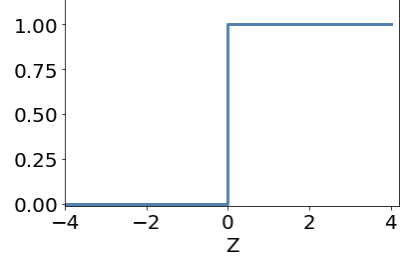
activation function
weights
bias
The perceptron algorithm : 1958, Frank Rosenblatt
Perceptrons are linear classifiers: makes its predictions based on a linear predictor function
combining a set of weights (=parameters) with the feature vector.
Perceptron
.
.
.
output
activation function
weights
bias
The perceptron algorithm : 1958, Frank Rosenblatt
Perceptrons are linear classifiers: makes its predictions based on a linear predictor function
combining a set of weights (=parameters) with the feature vector.
Perceptron
The perceptron algorithm : 1958, Frank Rosenblatt
output
activation function
weights
bias
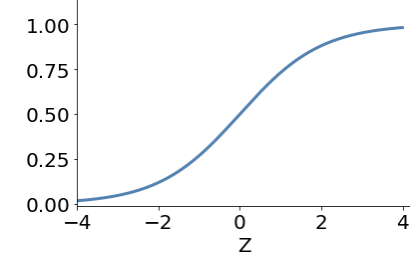
sigmoid
.
.
.
Perceptrons are linear classifiers: makes its predictions based on a linear predictor function
combining a set of weights (=parameters) with the feature vector.
Perceptron
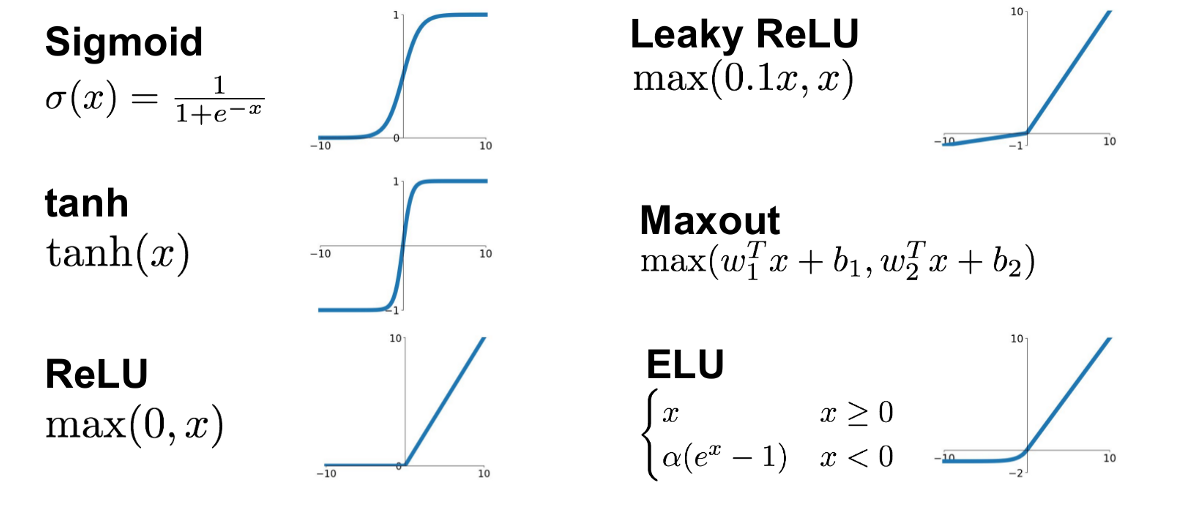
ANN examples of activation function
The perceptron algorithm : 1958, Frank Rosenblatt
Perceptron
The Navy revealed the embryo of an electronic computer today that it expects will be able to walk, talk, see, write, reproduce itself and be conscious of its existence.
The embryo - the Weather Buerau's $2,000,000 "704" computer - learned to differentiate between left and right after 50 attempts in the Navy demonstration
July 8, 1958
output
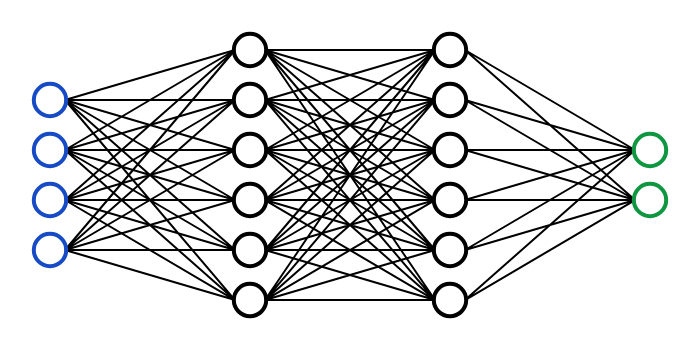
input layer
hidden layer
output layer
1970: multilayer perceptron architecture
Fully connected: all nodes go to all nodes of the next layer.
Perceptrons by Marvin Minsky and Seymour Papert 1969
Input
x
y
output
x
y
A Neural Network is a kind of function that maps input to output
Input
output
hidden layers
output
layer of perceptrons
output
layer of perceptrons
layer of perceptrons
layer of perceptrons
output
layer of perceptrons
layer of perceptrons
output
Fully connected: all nodes go to all nodes of the next layer.
layer of perceptrons
w: weight
sets the sensitivity of a neuron
b: bias:
up-down weights a neuron
f: activation function:
turns neurons on-off
output
how many parameters?
input layer
hidden layer
output layer
hidden layer
output
output
how many parameters?
input layer
hidden layer
output layer
hidden layer
output
output
input layer
hidden layer
output layer
hidden layer
35
(3x4)+4
(4x3)+3
how many parameters?
(3)+1
output
output
input layer
hidden layer
output layer
hidden layer
35
(3x4)+4
(4x3)+3
how many parameters?
(3)+1
output
output
input layer
hidden layer
output layer
hidden layer
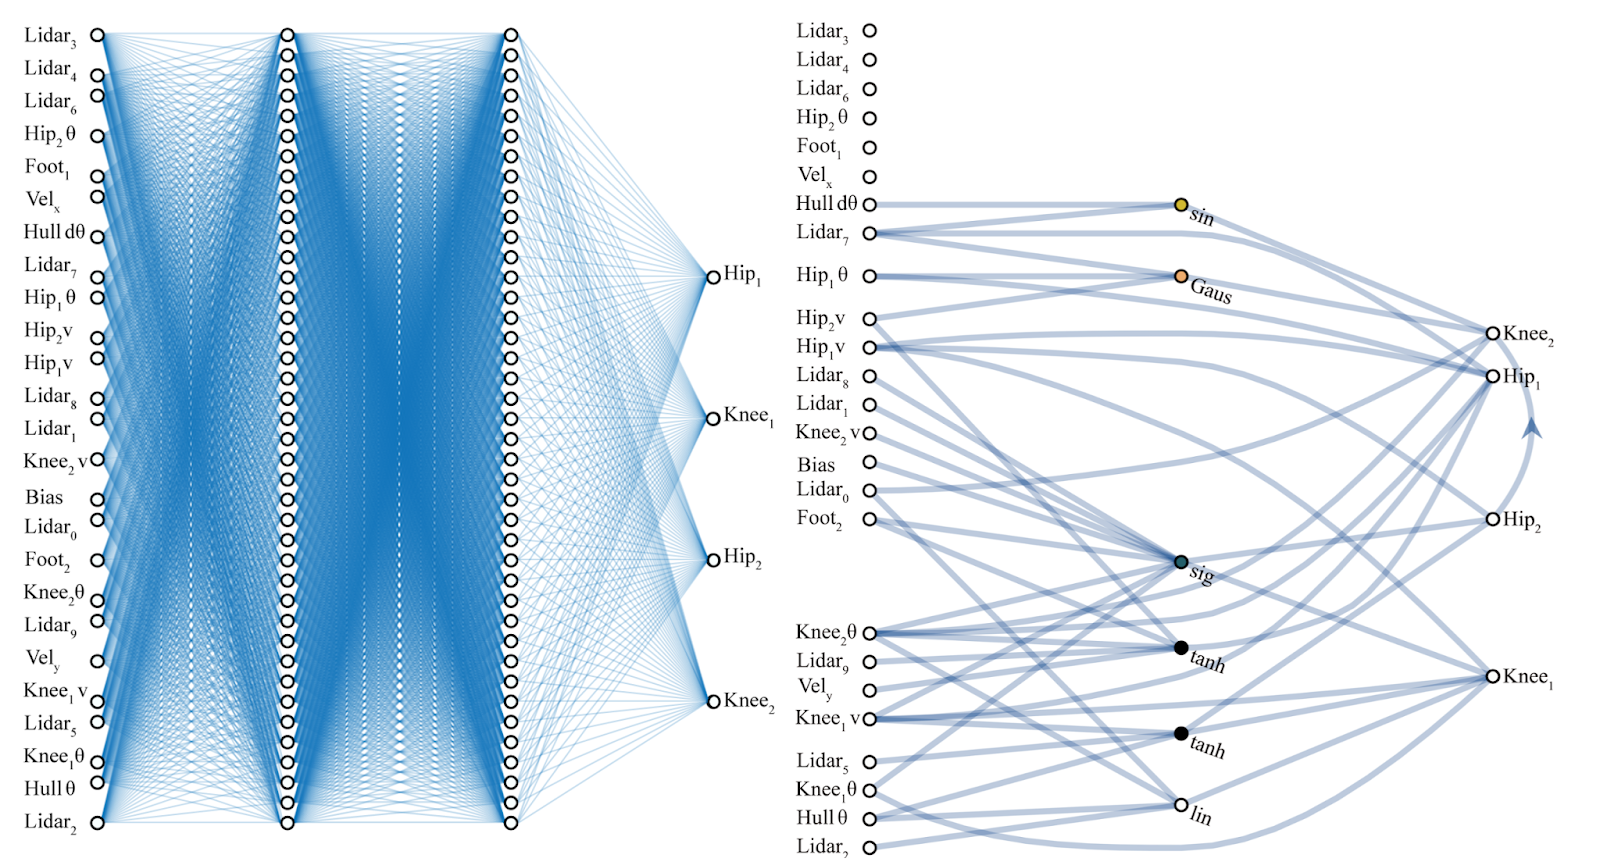
how many hyperparameters?
GREEN: architecture hyperparameters
RED: training hyperparameters
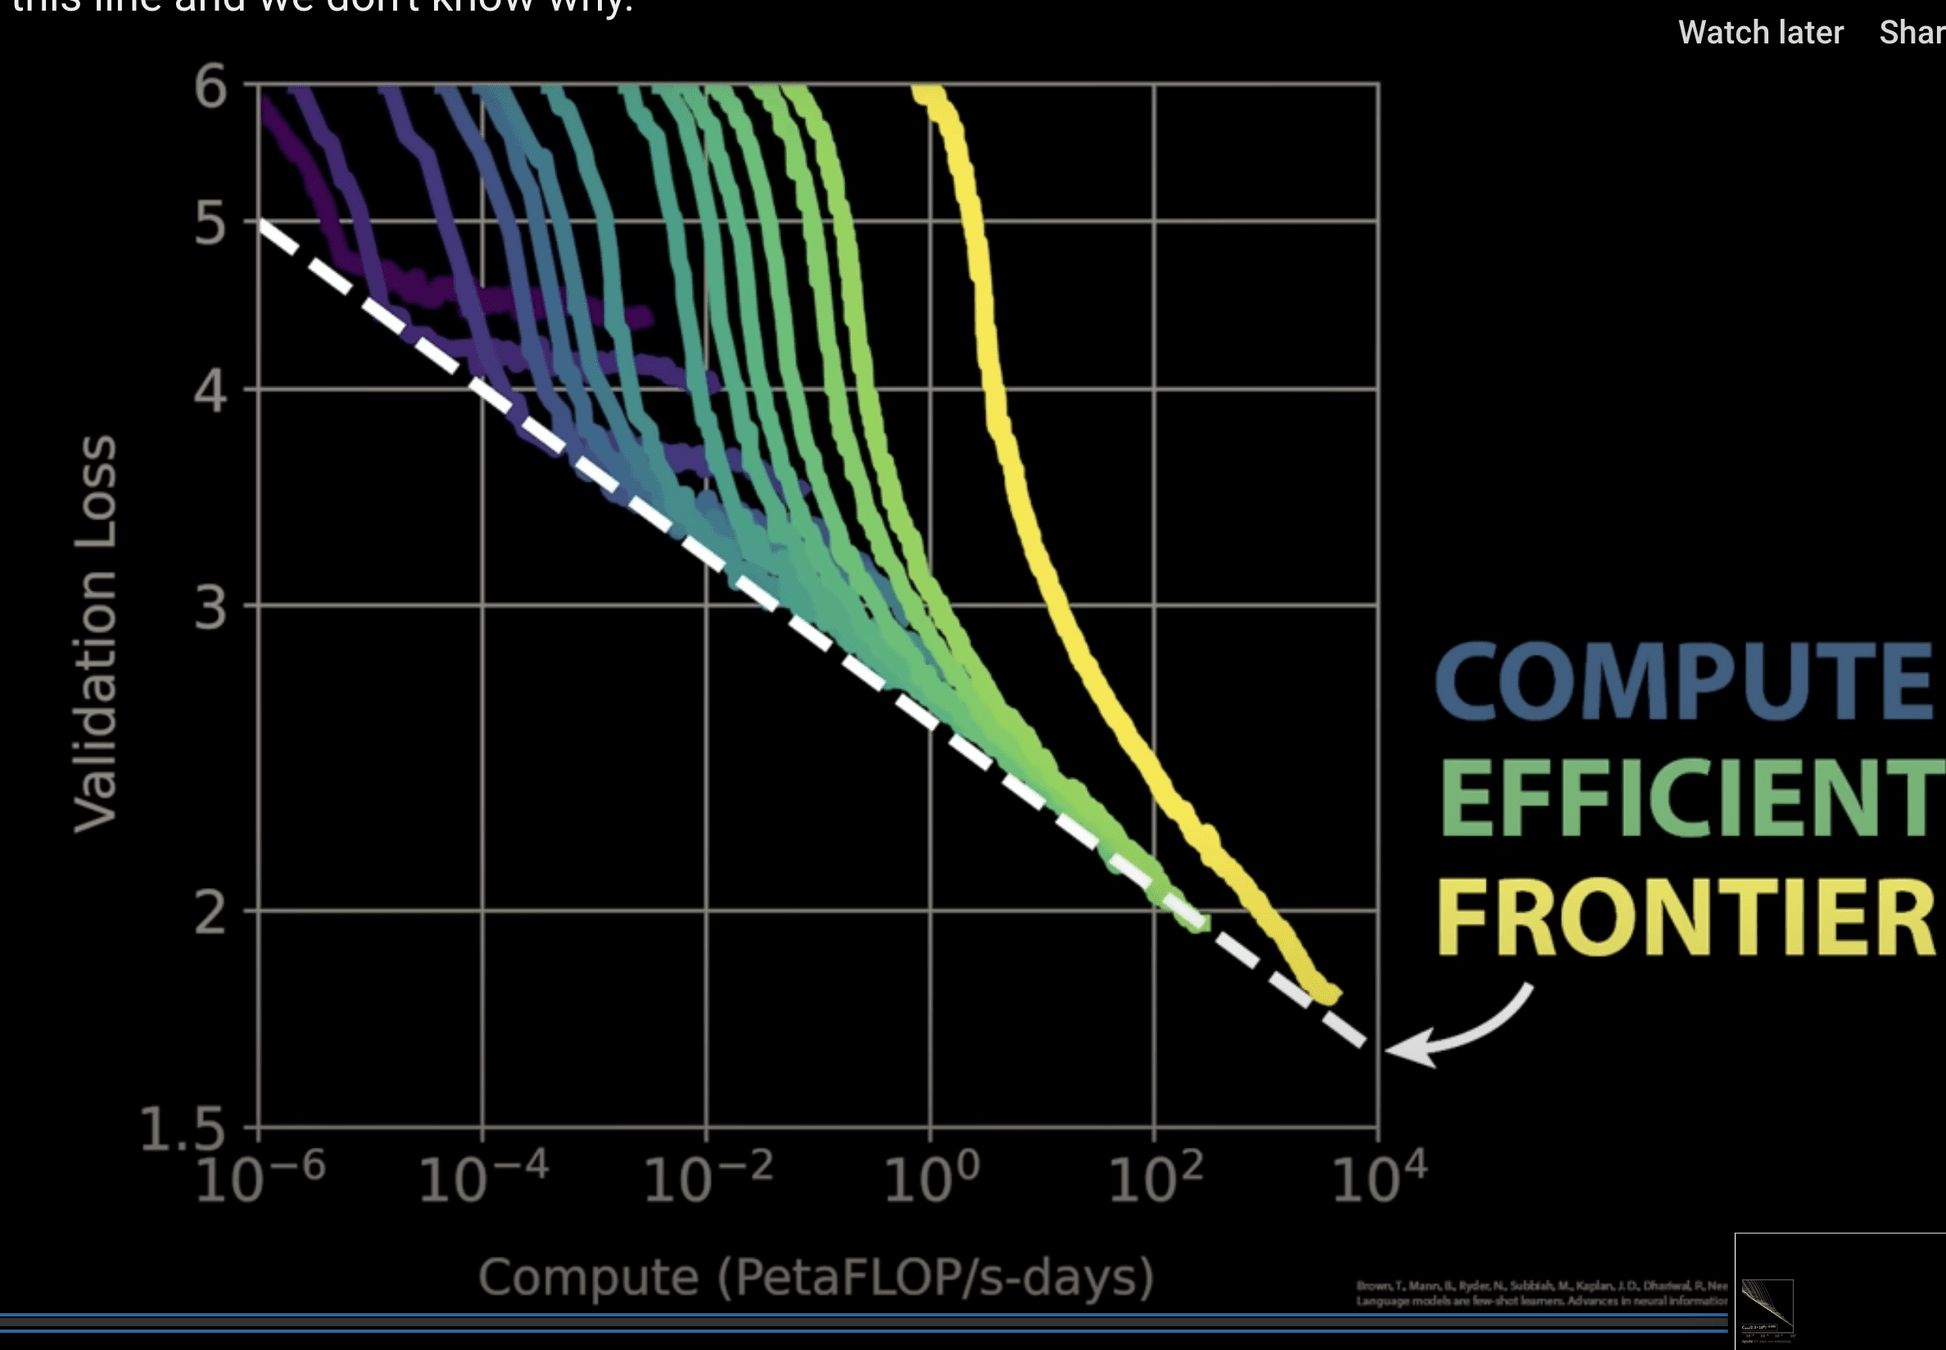
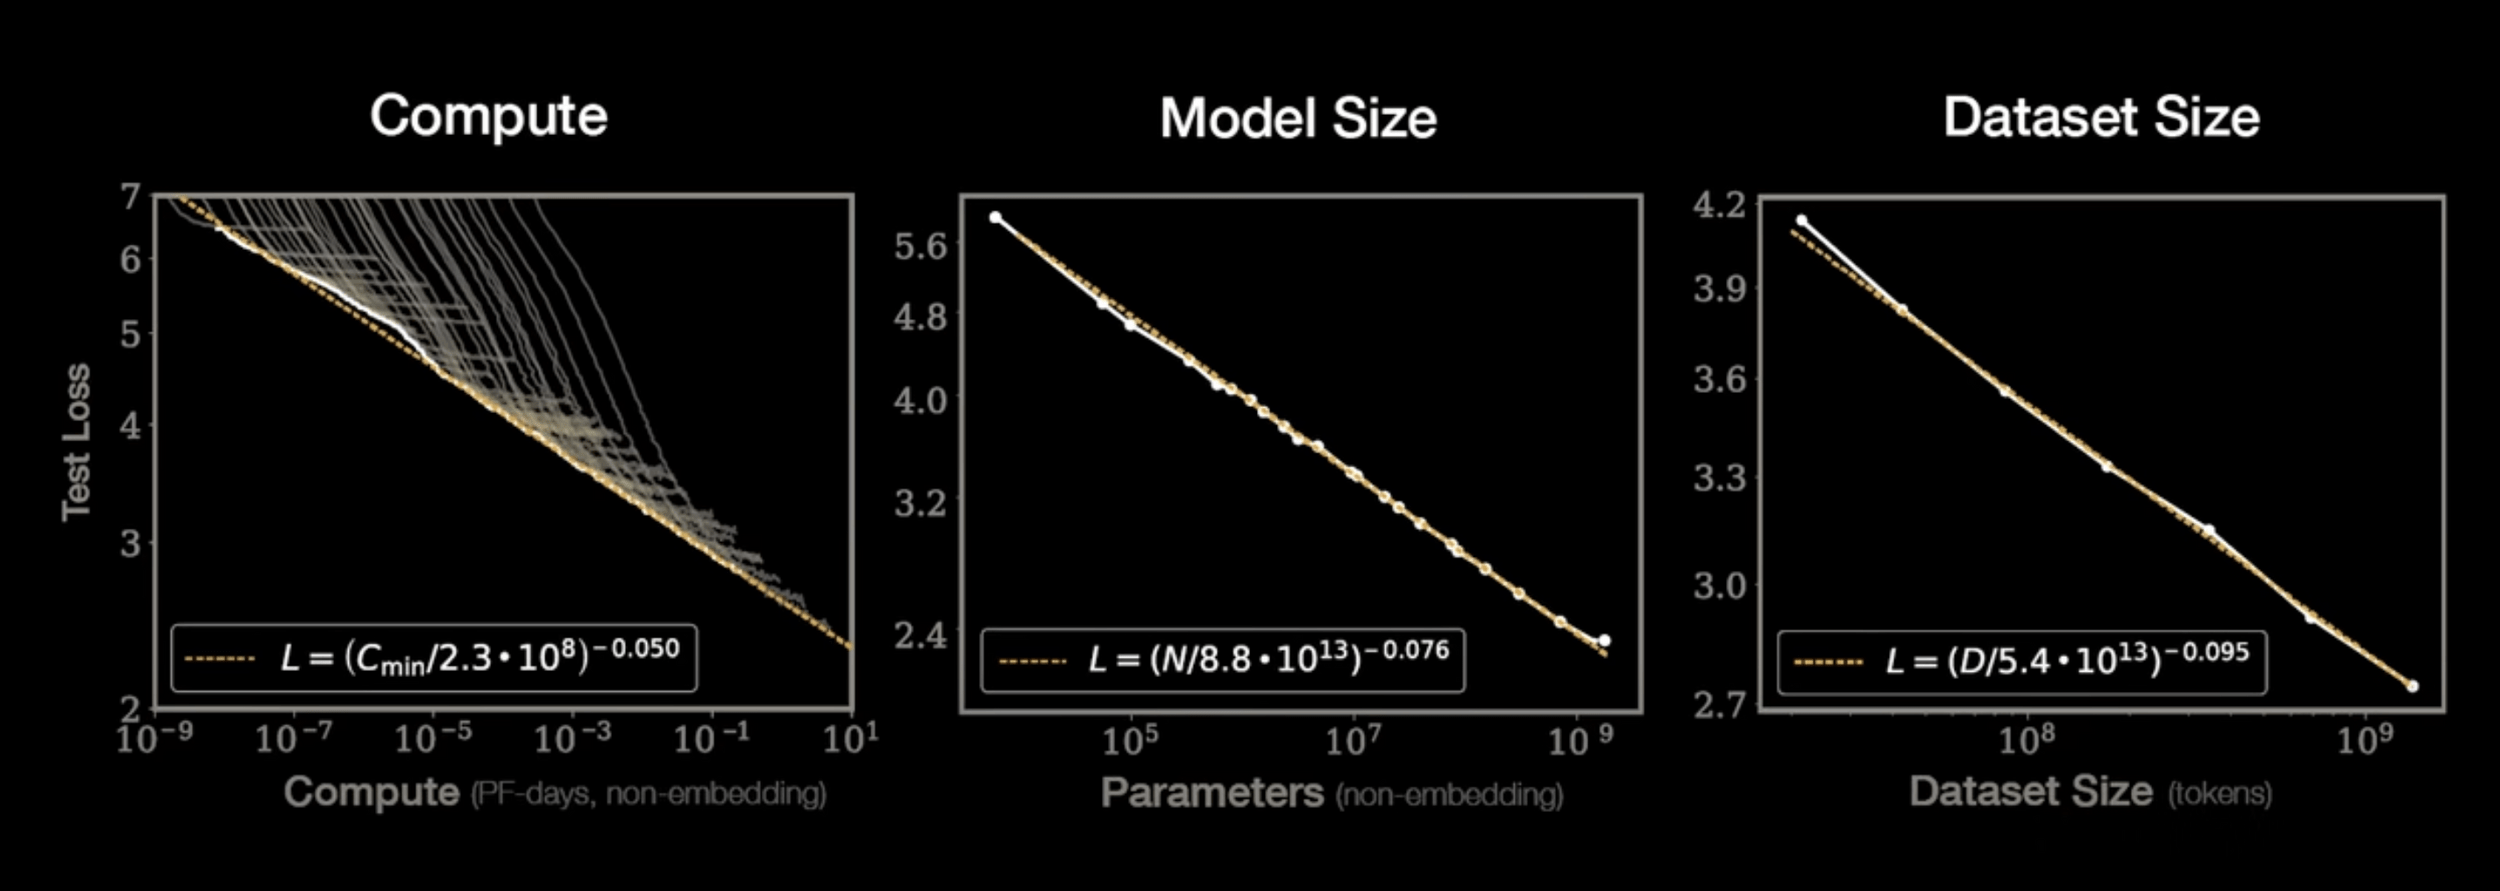
GPT-3
175 Billion Parameters
3,640 PetaFLOPs days
Kaplan+ 2020
GPT-4
??? Billion Parameters
200,000 PetaFLOPs days
$100M
Kaplan+ 2020
Kaplan+ 2020
National Public Radio
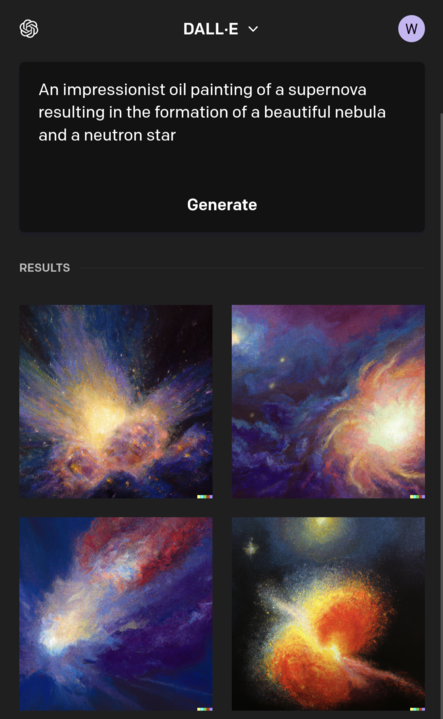
Generative
AI
4/6
Applications
Generative AI
What do NN do? approximate complex functions with series of linear functions
.... so if my layers are smaller what I have is a compact representation of the data
What do NN do? approximate complex functions with series of linear functions
To do that they extract information from the data
Each layer of the DNN produces a representation of the data a "latent representation" .
The dimensionality of that latent representation is determined by the size of the layer (and its connectivity, but we will ignore this bit for now)
.... so if my layers are smaller what I have is a compact representation of the data
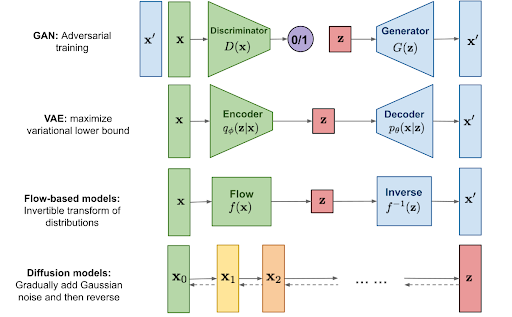
Generative AI
Generative AI
Generative AI
Generative AI
Generative AI
Autoencoders
Autoencoder Architecture
Feed Forward DNN:
the size of the input is 5,
the size of the last layer is 2
Autoencoder Architecture
Feed Forward DNN:
the size of the input is 5,
the size of the last layer is 2
p(9)
infederntial AI output:
Autoencoder Architecture
Feed Forward DNN:
the size of the input is 5,
the size of the last layer is 2
encoder
Autoencoder Architecture
encoder
decoder
Autoencoder Architecture
encoder
decoder
latent space: internal representation of the input data
Generative AI
Autoencoders
Autoencoder Architecture
Feed Forward DNN:
the size of the input is <N,
the size of the last layer is N
Feed Forward DNN:
the size of the input is ,
the size of the last layer is N
Theory driven | Falsifiability
Experiment driven
Simulations | Probabilistic inference | Computation
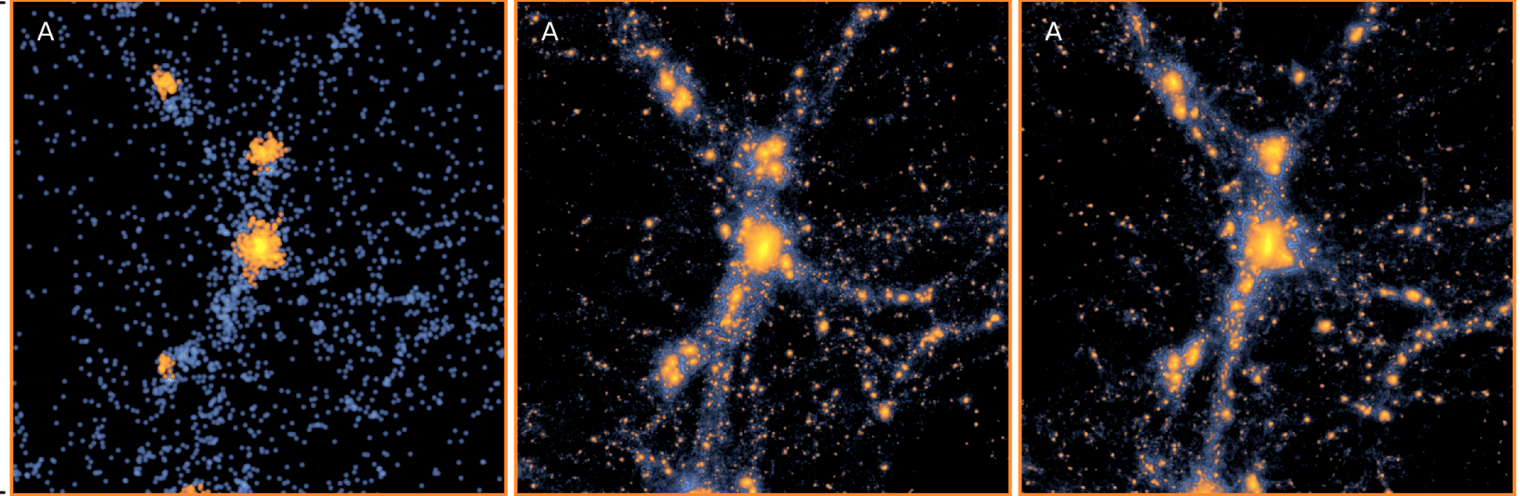
The Millennium Run used more than 10^10 particles to trace the evolution of the matter distribution in a cubic region of the Universe 500/h Mpc on a side (~over 2 billion light-years on a side), and has a spatial resolution of 5/h kpc. ~20M galaxies.
350 000 processor hours of CPU time, or 28 days of wall-clock time. Springel+2005
LOW RES SIM
HIGH RES SIM
LOW RES SIM
HIGH RES SIM
AI-AIDED HIGH RES
LOW RES SIM
HIGH RES SIM
AI-AIDED HIGH RES
INPUT
OUTPUT
TARGET
loss = D(OUTPUT-TARGET)
November 30, 2022
will be made available to developers through Google Cloud’s API from December 13, 2023
teaching AI
5/6
- project based learning
immediate practice enhances theoretical understanding
- incremental learning
compartimentalized topics with shared fundations
- intuitive learning
can be taught with a light mathematical approach
- project based learning
immediate practice enhances theoretical understanding
- incremental learning
compartimentalized topics with shared fundations
- intuitive learning
can be taught with a light mathematical approach
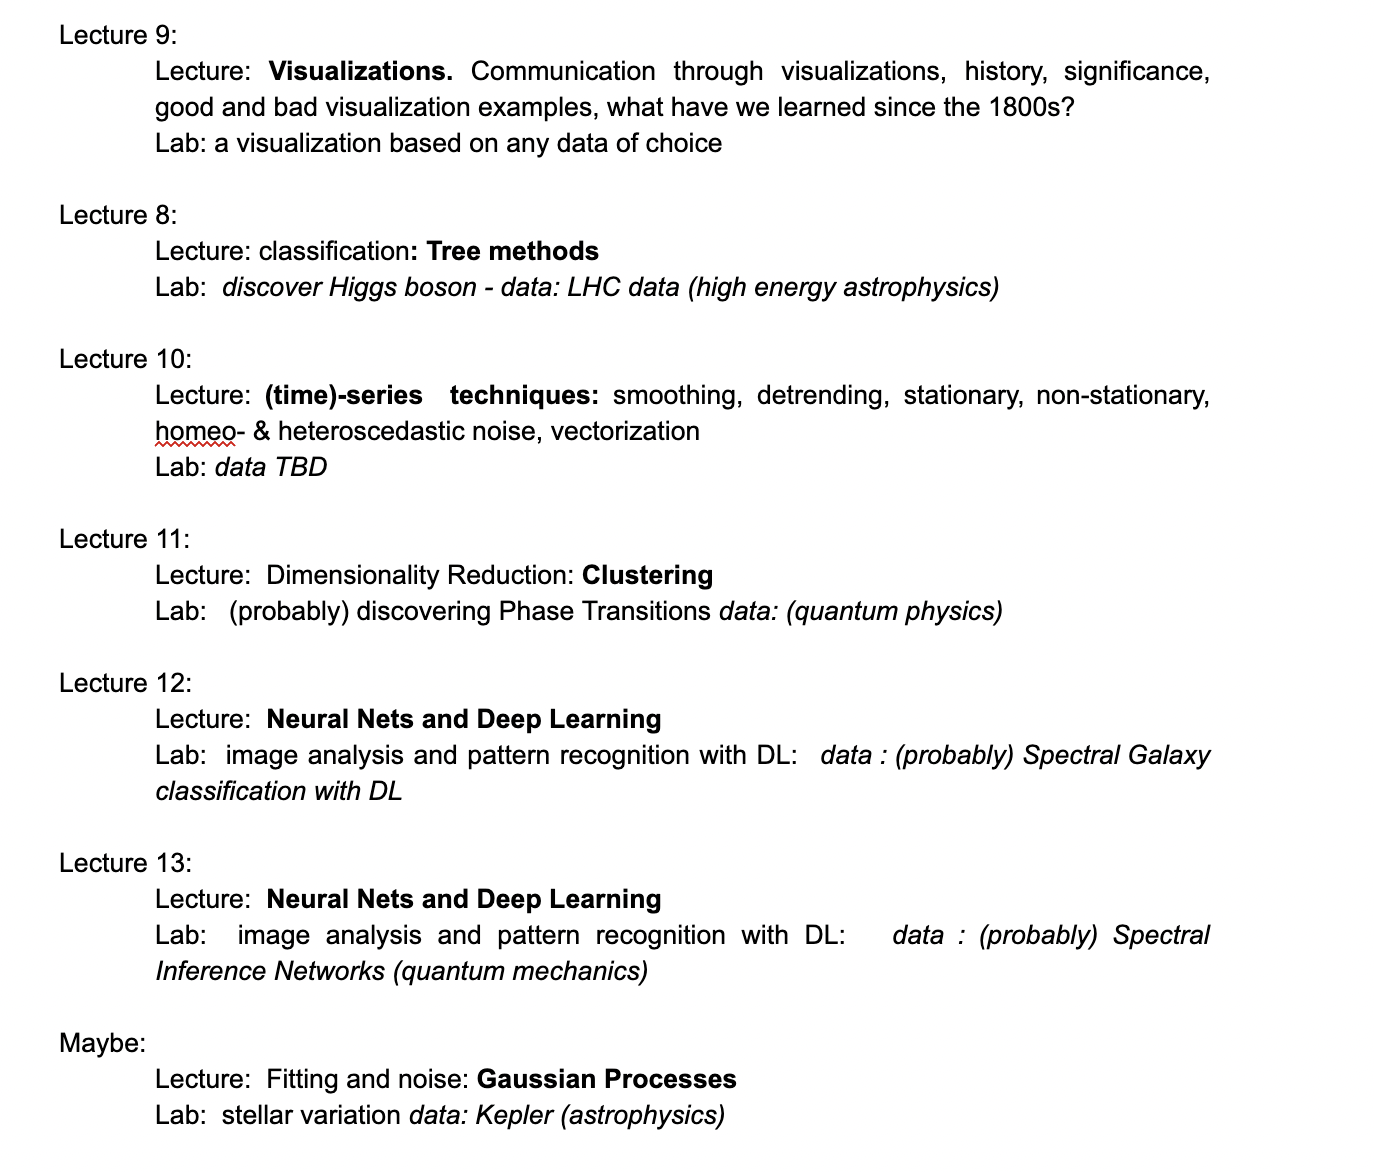
Syllabus Machine Learning for Physical Scientists
- project based learning
immediate practice enhances theoretical understanding
- incremental learning
compartimentalized topics with shared fundations
- intuitive learning
can be taught with a light mathematical approach
ethics of AI
6/6
the butterfly effect
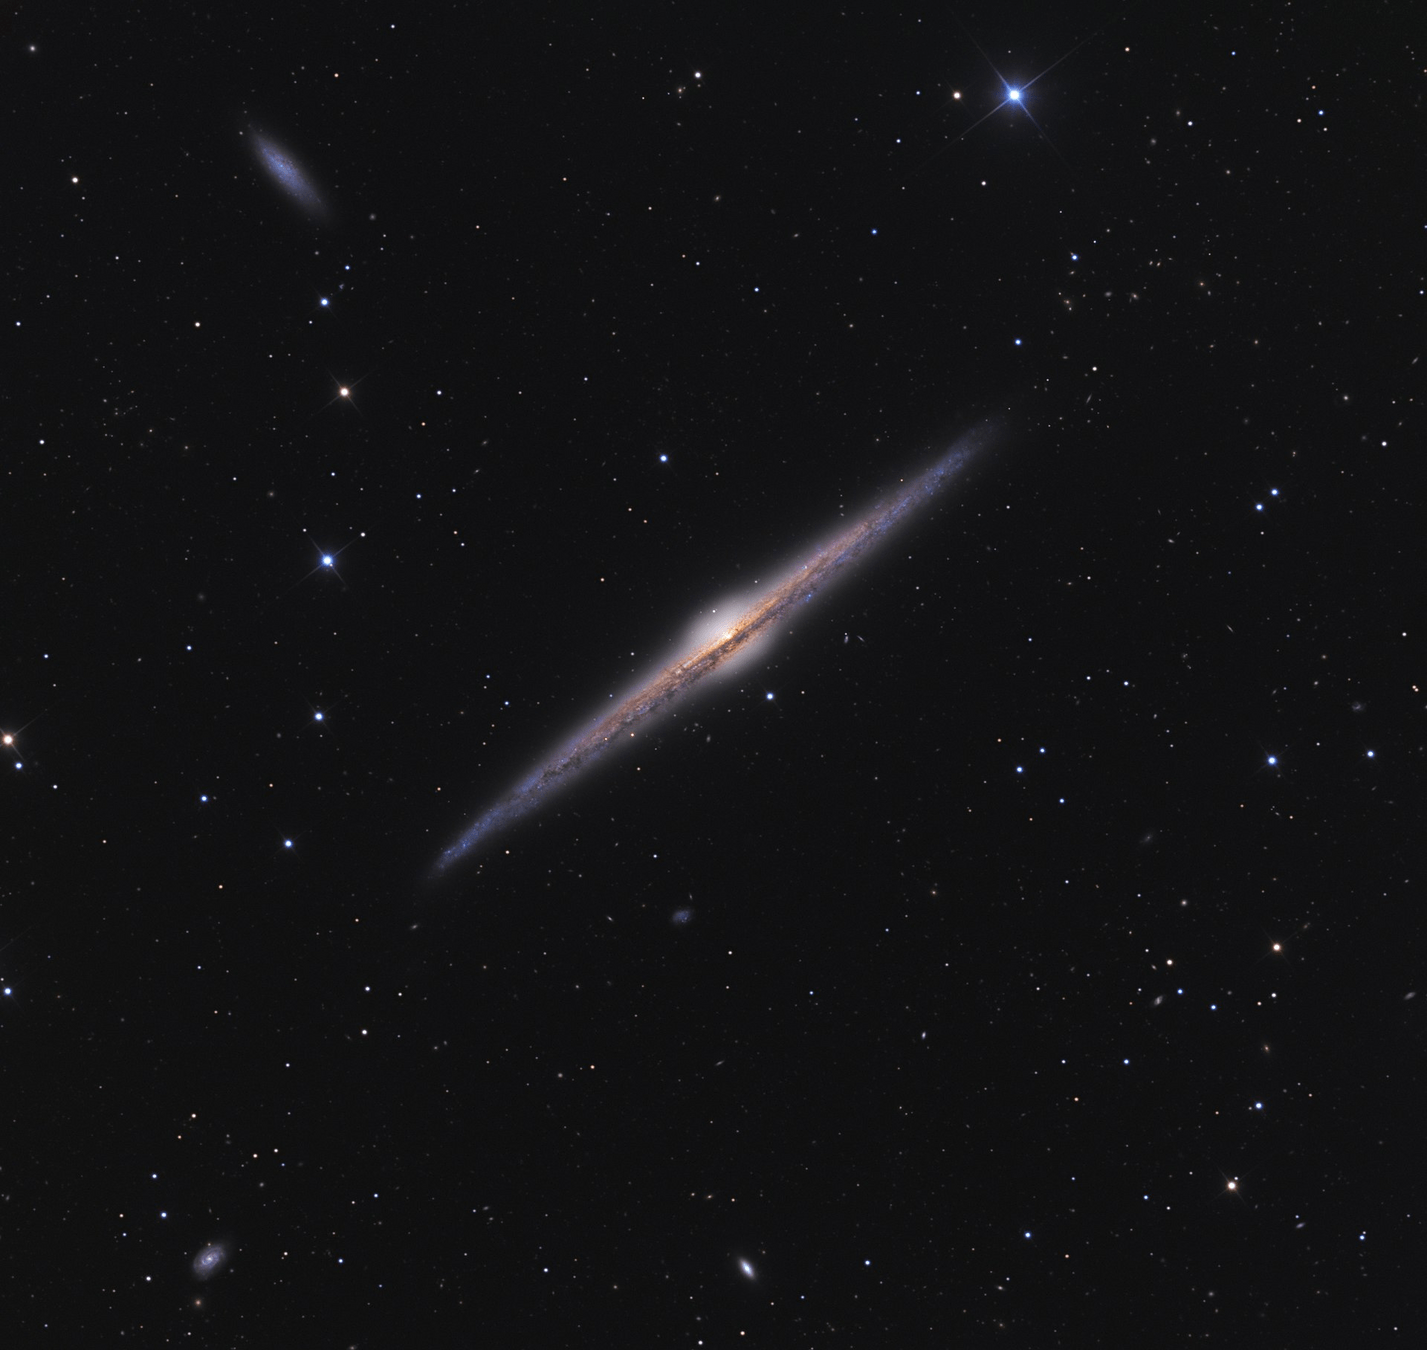
NGC 4565 is an edge-on spiral galaxy about 30 to 50 million light-years away. The faculty at the IUCAA used a AI model (emulator) to predict the hidden physical parameters of the Galaxy wrongfully estimating the DM content of NCG 4565 and claimed a novel process for Galaxy formation should be taken under consideration.
the butterfly effect
NGC 4565 is an edge-on spiral galaxy about 30 to 50 million light-years away. The faculty at the University of Delaware used a AI model (emulator) to predict the hidden physical parameters of the Galaxy wrongfully estimating the DM content of NCG 4565 and claimed a novel process for Galaxy formation should be taken under consideration.
Unfortunately, this was the result of a model hallucination.
The galaxy was featured in many social media posts gaining rapid notoriety, but upon retraction it was canceled. The galaxy is suing University of Delaware claiming emotional damage and loss of revenue
the butterfly effect
the butterfly effect
We use astrophyiscs as a neutral and safe sandbox to learn how to develop and apply powerful tool.
Deploying these tools in the real worlds can do harm.
Ethics of AI is essential training that all data scientists shoudl receive.
The main skill that is missing in the portfolio of our new hires is data ethics
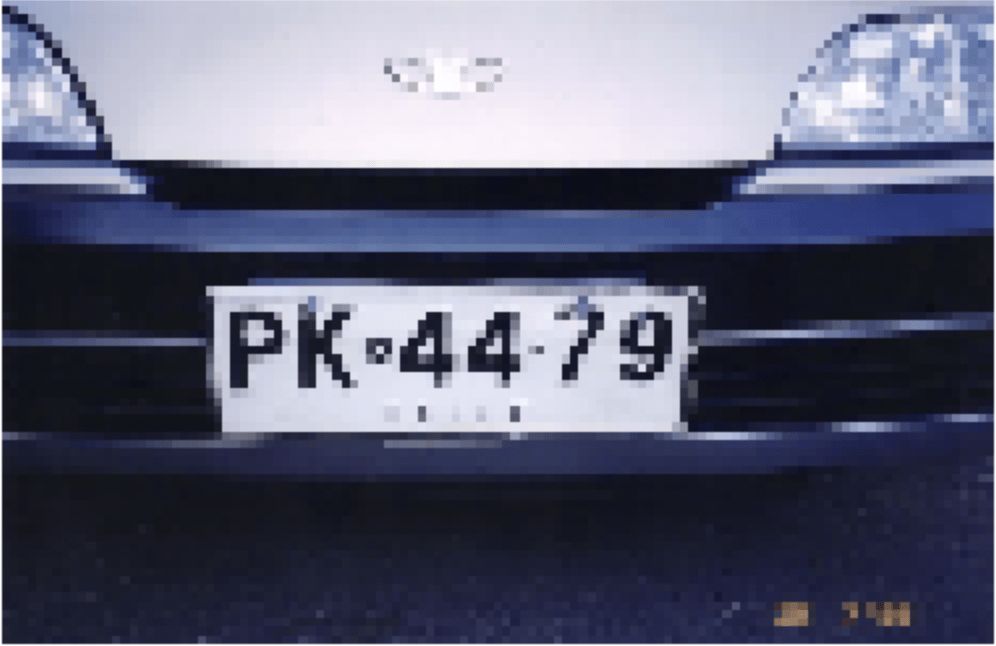
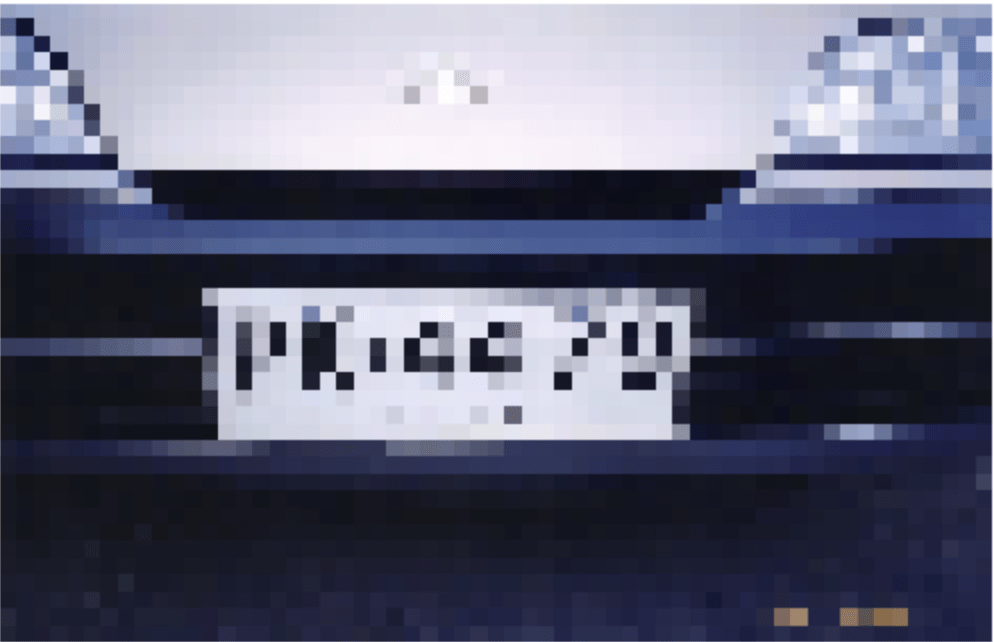
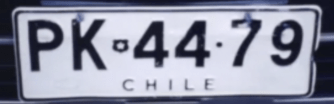
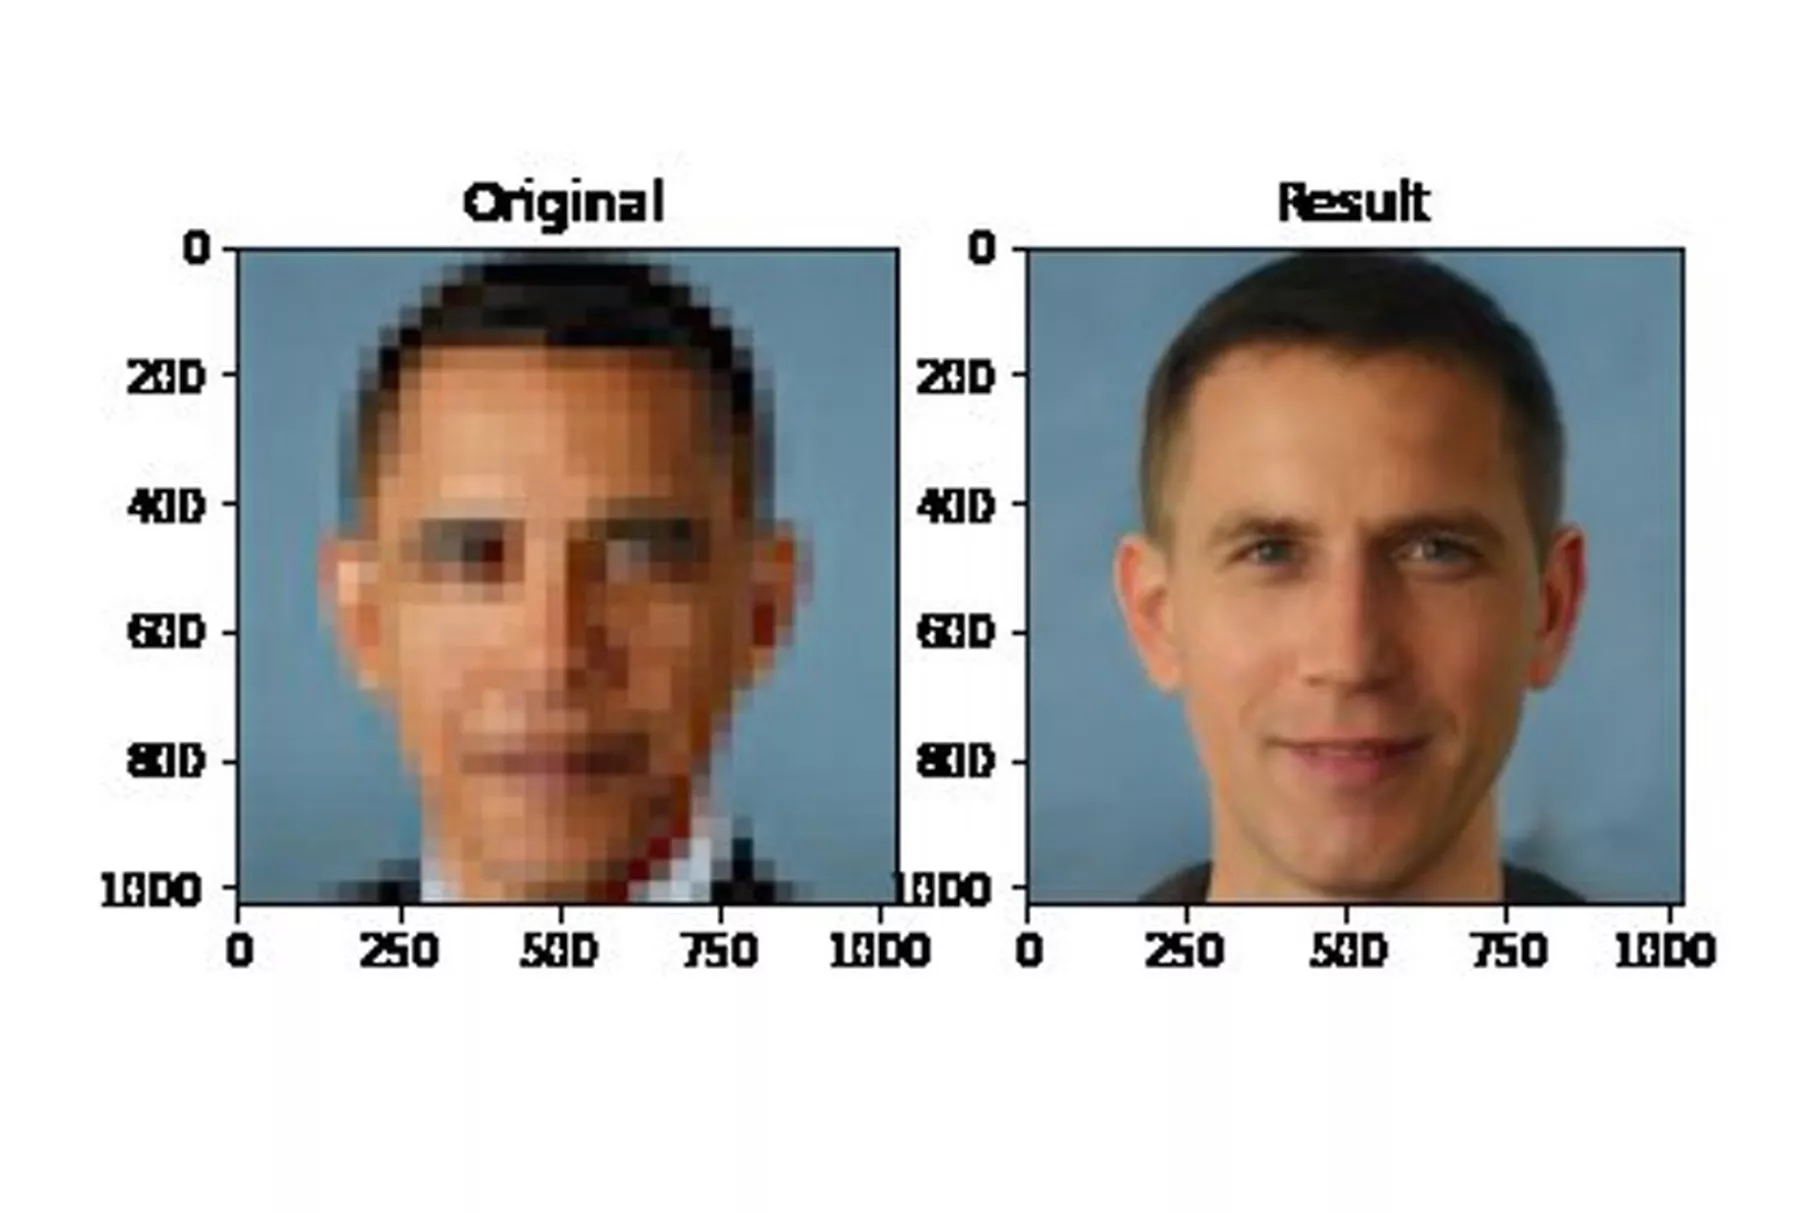
Why does this AI model whitens Obama face?
Simple answer: the data is biased. The algorithm is fed more images of white people
But really, would the opposite have been acceptable? The bias is in society
Why does this AI model whitens Obama face?
Simple answer: the data is biased. The algorithm is fed more images of white people
But really, would the opposite have been acceptable? The bias is in society
Why does this AI model whitens Obama face?
Simple answer: the data is biased. The algorithm is fed more images of white people
Joy Boulamwini
November 30, 2022
will be made available to developers through Google Cloud’s API from December 13, 2023
Vinay Prabhu exposes racist bias in GPT-3
RAISE ALL VOICES
RAISE ALL VOICES
Federica B. Bianco
University of Delaware
Physics and Astronomy
Biden School of Public Policy and Administration
Data Science Institute
Vera C. Rubin Observatory
Deputy Project Scientist - Construction
Interim Head of Science - Operations
By federica bianco


