


federica bianco PRO
astro | data science | data for good
Spring 2025 - UDel PHYS 664
dr. federica bianco
@fedhere
falsifiability
reproducibility
this slide deck:
0
grading, communication
Dr. Federica Bianco - fbianco@udel.edu
Office hours:
???
Location: Sharp Lab 209
Available on Slack.... a lot
Class syllabus - https://bit.ly/mltsa25_syllabus
UD Canvas - used for announcements and grading
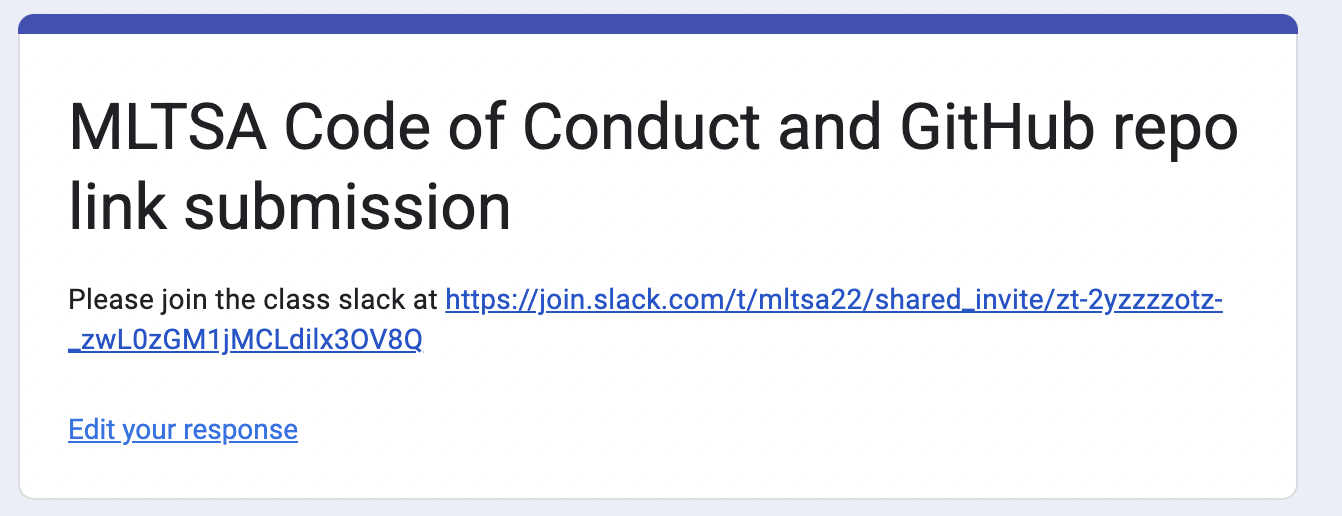
Class slack - you will access it by filling in a form as first assignment. The form will ensure you read the code of conduct and syllabus for the class
(will need to gain invitation by filling in the class form)
Communication
Class syllabus - http://bit.ly/MLTSASyllabus
UD Canvas - used for announcements and grading
Class slack -
Communication
There are several textbooks listed on the syllabus . However, since none of them will fully cover the curriculum I want to cover they may be useful but will not be sufficient. Truly the slides will be the main resource for reviewing the material covered. Therefore, I urge you not to rush to spend a large amount of money on buying them. Start the class as see if you think they would help you, and which ones would. I also asked the physics library to acquire copies of the books and you can also ask to borrow mine from time to time.
Elements of Statistical Learning, Hastie,Tibshirani,Friedman, Springer 2001 - available for free at the link provided here
Is a foundational textbook for machine learning
Statistics, Data Mining, and Machine Learning in Astronomy, Ivezic, Connoly, VanderPlas, Gray, 2nd edition 2019
It is an application textbook that shows specifically applications of ML to astrophysics, and a good chunk of astrophysics deals with time series. Note that the second edition just appeared.
Hands-on Machine Learning with Scikit-Learn, Keras, and TensorFlow Aurélien Géron O'Reilly Media 2019
probably the book that is closer to the syllabus in terms of techniques, but don’t buy it, because the second edition is due to come out imminently and the deep learning chapters of the previous edition are out of date now
More books about python may be useful depending on your background.
Dive into Deep Learning free resource, Interactive deep learning book with code, math, and discussions Implemented with PyTorch, NumPy/MXNet, JAX, and TensorFlow
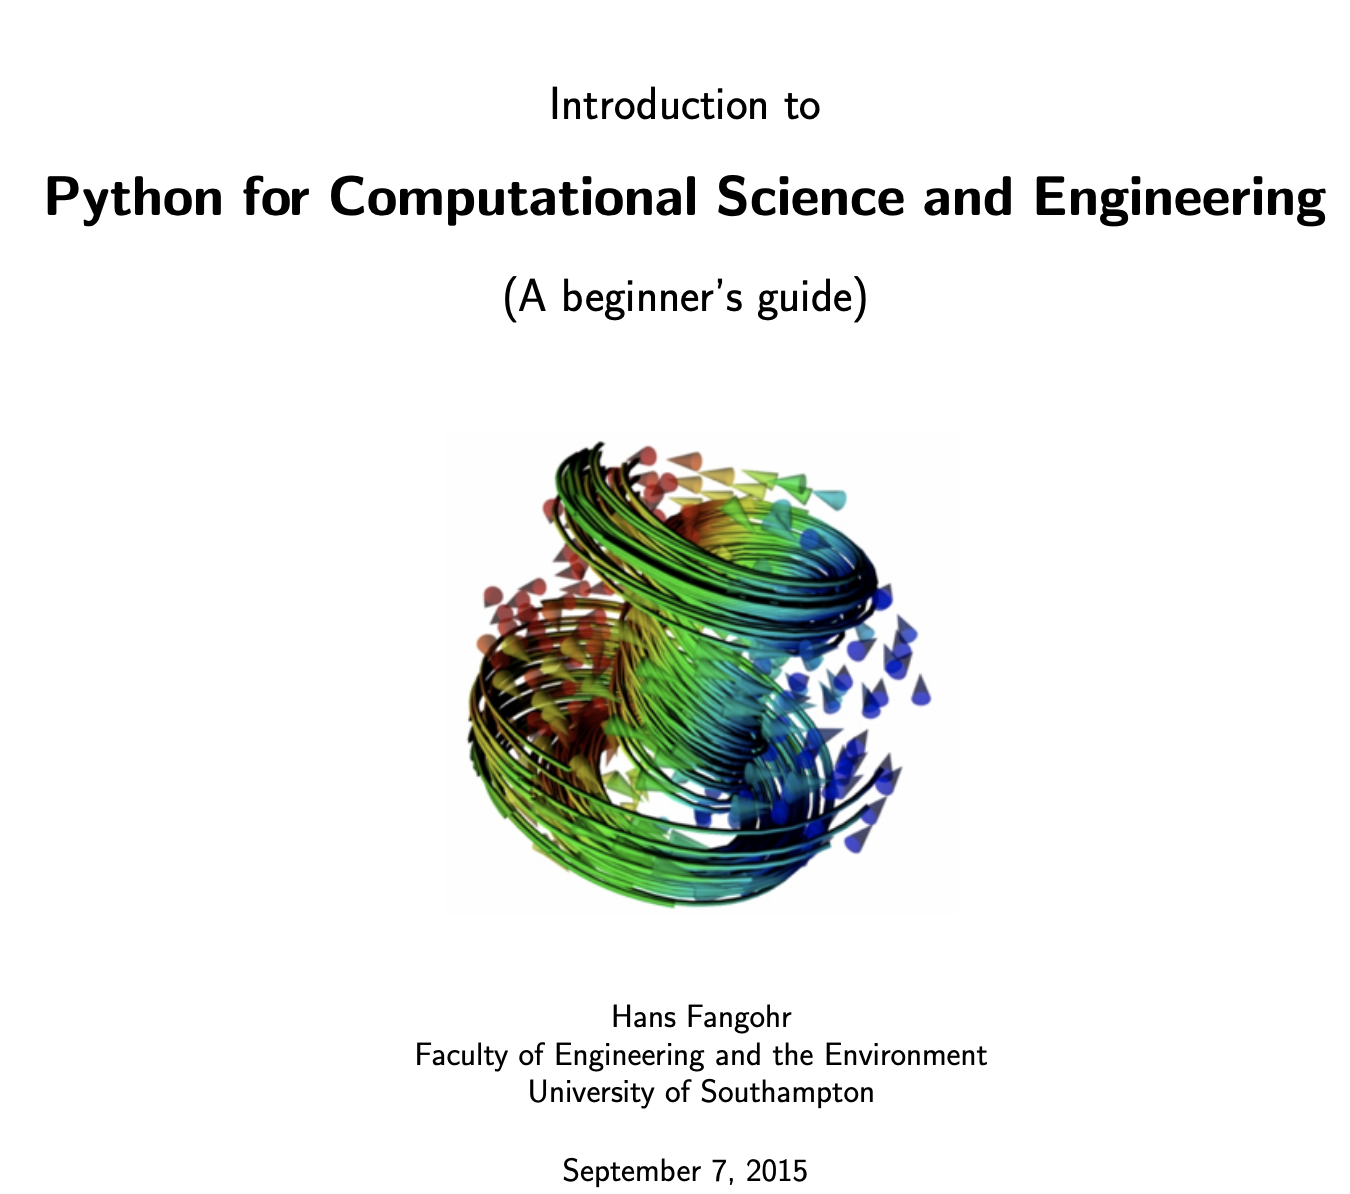
Coding if you are not familiar with python
Python Data Science Handbook, Jake VanderPlas, O'Reilly Media 2016 (for free at this link, just click download)
Beginning Python Visualization, Shai Vaingast 2009 (great for python beginners) - available for free at the link provided here
Visualizations:
Visualizations Analysis and Design, T. Munzer, 2014 not free
Class resources
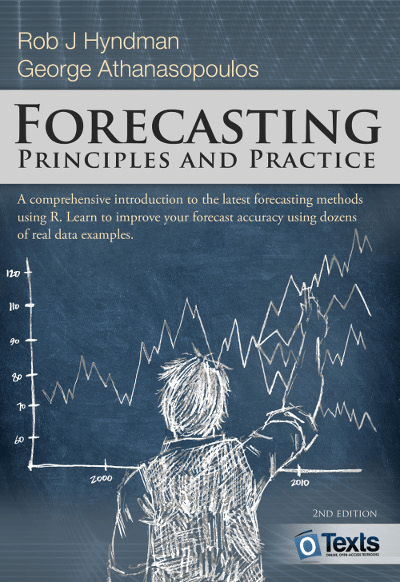
Open textbook on forecasting http://otexts.com/fpp2
Forecasting: Principles and Practice
Rob J Hyndman and George Athanasopoulos
Class resources
What I expect from you
Grades are based on:
every (... most) class will start with a quizz. You will have up to 10 minutes to complete the quizz. The quizz will be based on content of previous lectures and assigned reading.
midterm and final projects
Team projects: minimum 3 people group, max 4 people group
Deliverables:
report + presentation (slides and live presentation) for both proposal and final project
(templates are available in http://bit.ly/MLTSA20drive)
Deliver on your own repo
github.com/MLTSA25_<Firstinitial><Lastname>/HW<number>
midterm and final projects
Please work in groups of up to 5 people on homework as a collaborative projects.
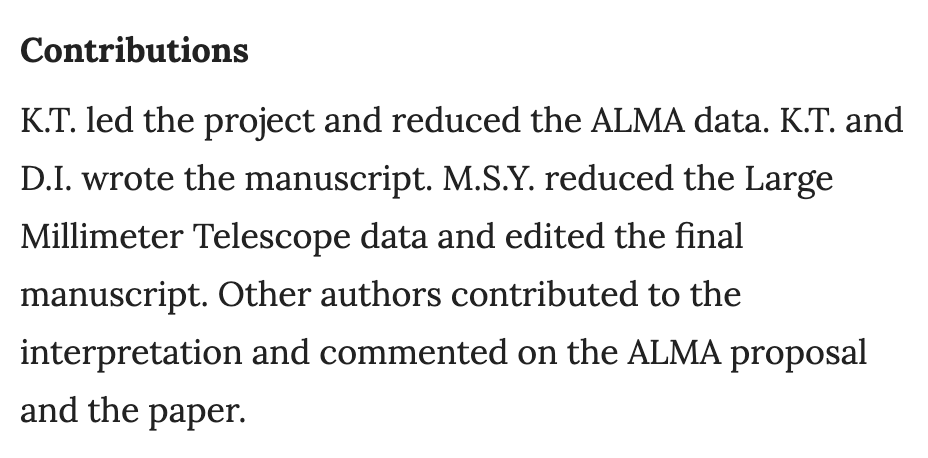
Individual notebooks must be returned for each homework. Different group members should lead different aspects of the work. A statement must be included in the README explaining each team member’s contribution (similar to an acknowledge of contribution you would find in a Nature letter see, for example these contributions).
Things that count for participation
(20% of the grade)
python github google-colab stackoverflow
1
Reproducible research means:
all numbers in a data analysis can be recalculated exactly (down to stochastic variables!) using the code and raw data provided by the analyst.
Claerbout, J. 1990,
Active Documents and Reproducible Results, Stanford Exploration Project Report, 67, 139
allows reproducibility through code distribution
the Git software
is a distributed version control system:
a version of the files on your local computer is made also available at a central server.
The history of the files is saved remotely so that any version (that was checked in) is retrievable.
allows version control
collaboration tool
by fork, fork and pull request, or by working directly as a collaborator
allows effective collaboration
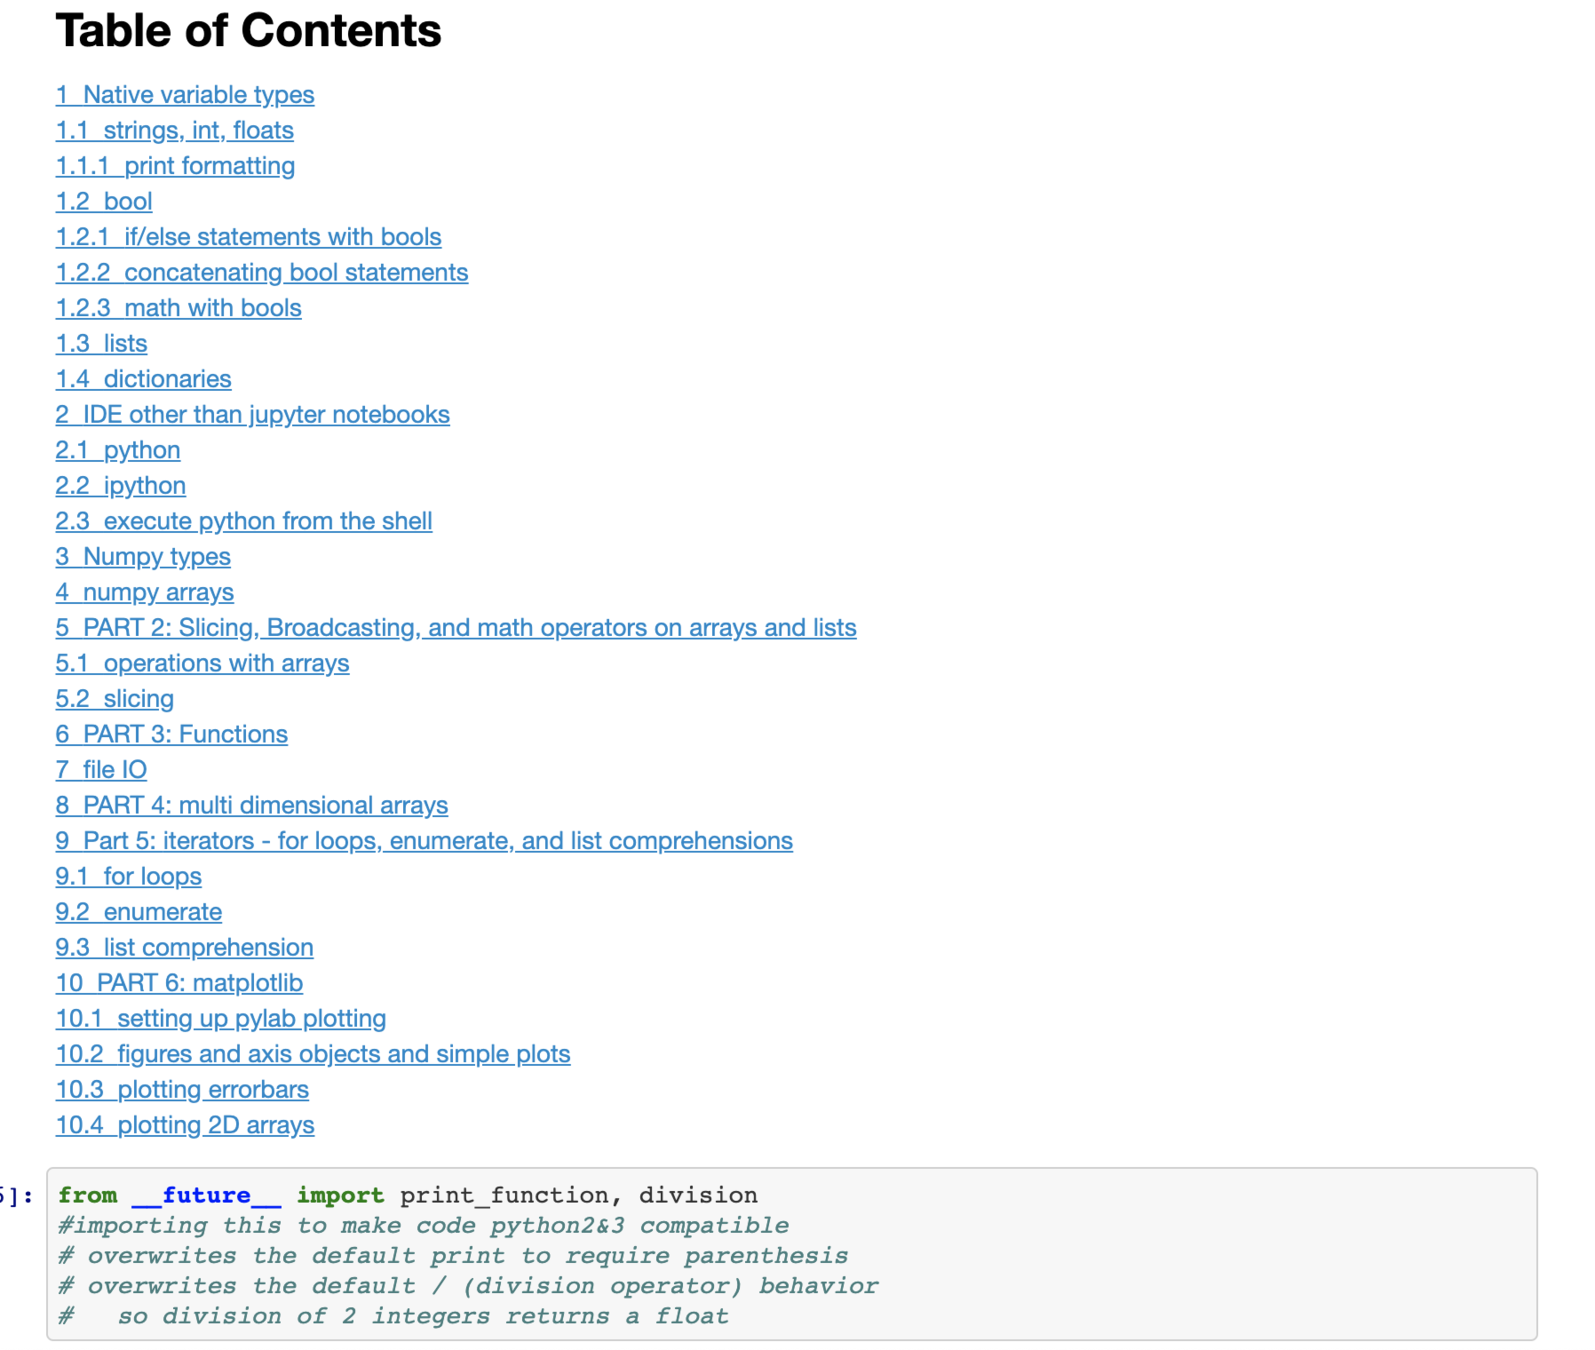
series of notebooks designed for Urban Science students by Dr. Mohit Sharma (in consultation with me)
recommanded if you are brand new to python and coding or are serious about cleaning up your foundamentals
quick bootcamp
recommanded if you know some python or if you know some other conding language reasonably proficiently
online book
PEP8: Python Enhancement Proposals 8
“This document gives coding conventions for the Python code comprising the standard library in the main Python distribution.”
you can ask coding questions, installation questions, colab questions...
you can ask coding questions, installation questions, colab questions...
you can ask ciding questions, installation questions, colab questions...
it can be a toxic environment...
Science Guiding Principles
2
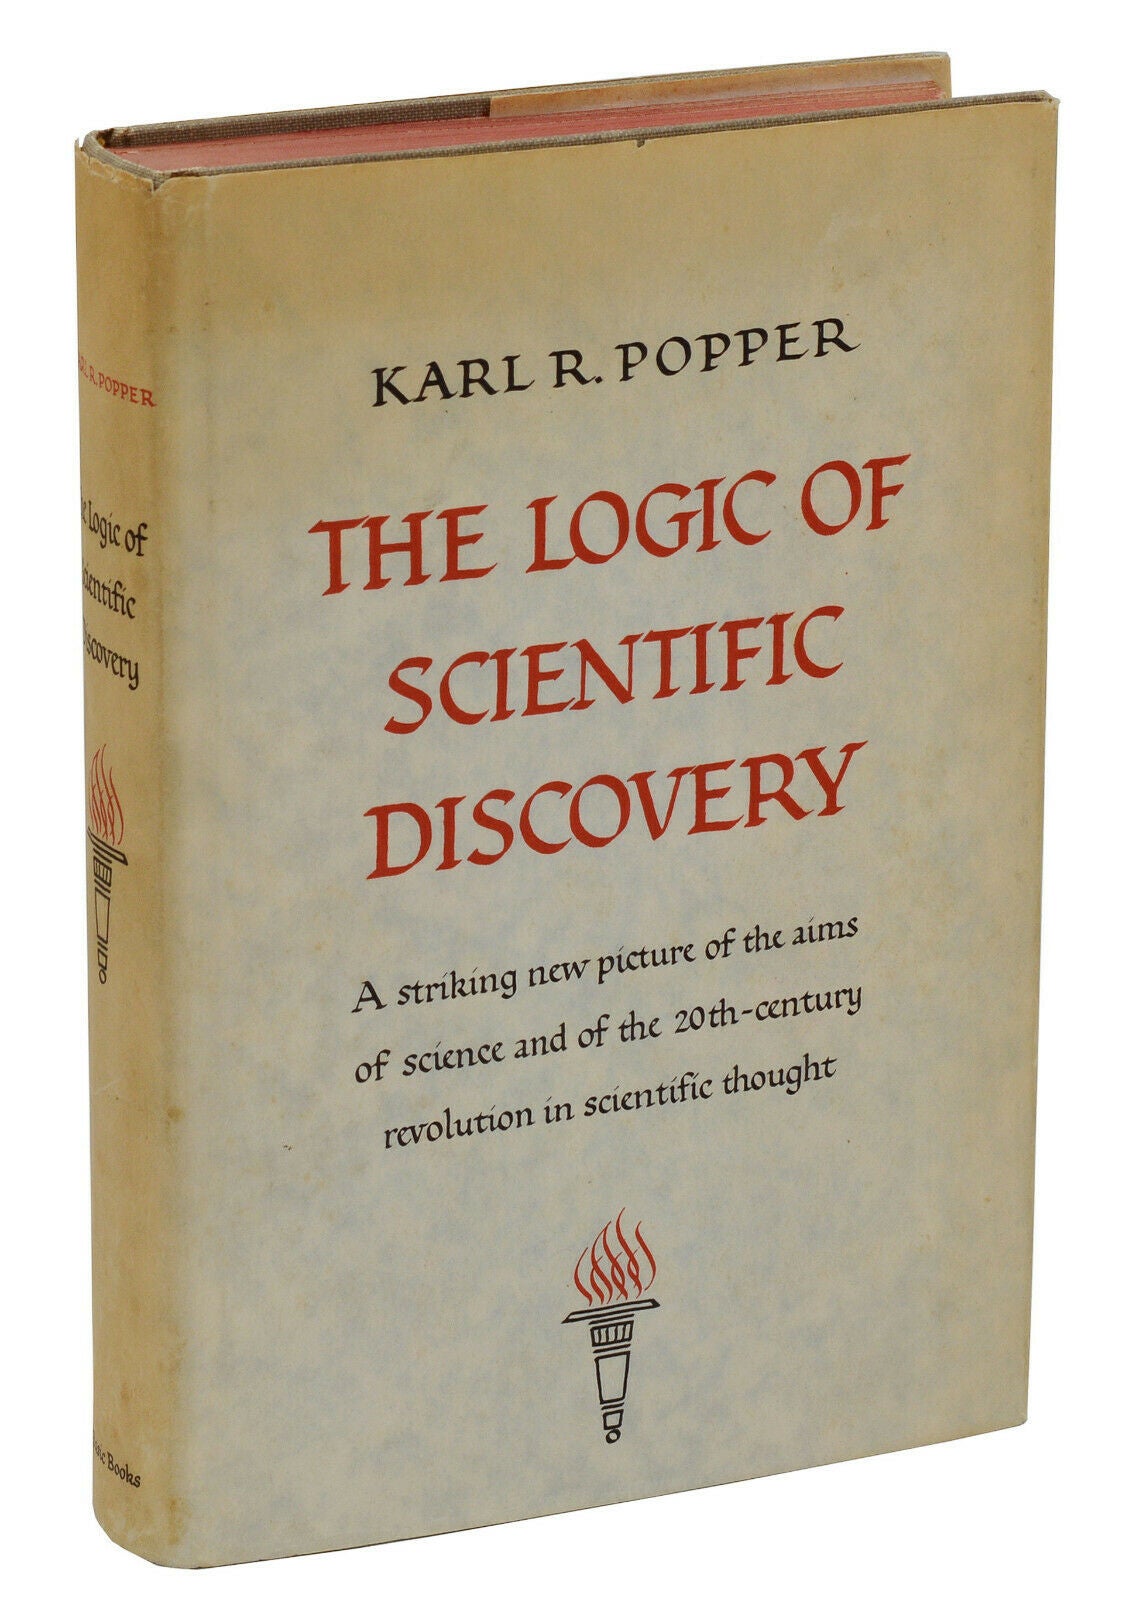
My proposal is based upon an asymmetry between verifiability and falsifiability; an asymmetry which results from the logical form of universal statements. For these are never derivable from singular statements, but can be contradicted by singular statements.
—Karl Popper, The Logic of Scientific Discovery
the demarcation problem:
what is science? what is not?
a scientific theory must be falsifiable
My proposal is based upon an asymmetry between verifiability and falsifiability; an asymmetry which results from the logical form of universal statements. For these are never derivable from singular statements, but can be contradicted by singular statements.
—Karl Popper, The Logic of Scientific Discovery
the demarcation problem:
what is science? what is not?
model
prediction
the demarcation problem
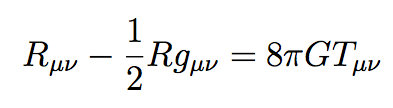
Einstein GR
the demarcation problem
model
prediction
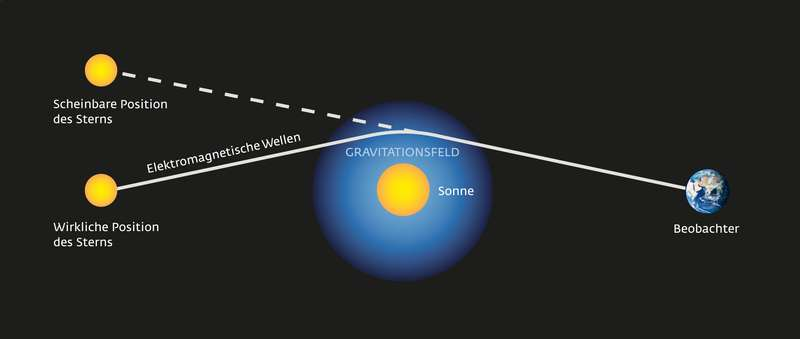
Light rays are deflected by mass
model
prediction
data
does not falsify
falsifies
GR
still holds
GR
rejected
the demarcation problem
position of star changes during eclipse
position of star does not change during eclipse
is astrology a science?
the demarcation problem
DISCUSS!
the demarcation problem
things can get more complicated though:
most scientific theories are actually based largely on probabilistic induction and
modern inductive inference (Solomonoff, frequentist vs Bayesian methods...)
the demarcation problem
A theory can be said to be scientific if it makes falsifiable predictions
Experiments should be designed to falsify the predictions
Key Concept
Reproducible research means:
the ability of a researcher to duplicate the results of a prior study using the same materials as were used by the original investigator. That is, a second researcher might use the same raw data to build the same analysis files and implement the same statistical analysis in an attempt to yield the same results.
assures a result is grounded in evidence
1
#openscience
#opendata
Reproducible research means:
the ability of a researcher to duplicate the results of a prior study using the same materials as were used by the original investigator. That is, a second researcher might use the same raw data to build the same analysis files and implement the same statistical analysis in an attempt to yield the same results.
facilitates scientific progress by avoiding the need to duplicate unoriginal research
2
Reproducible research means:
the ability of a researcher to duplicate the results of a prior study using the same materials as were used by the original investigator. That is, a second researcher might use the same raw data to build the same analysis files and implement the same statistical analysis in an attempt to yield the same results.
facilitate collaboration and teamwork
3
Reproducible research in practice:
using the code and raw data provided by the analyst.
Claerbout, J. 1990,
Active Documents and Reproducible Results, Stanford Exploration Project Report, 67, 139
Reproducible research means:
the ability of a researcher to duplicate the results of a prior study using the same materials as were used by the original investigator. That is, a second researcher might use the same raw data to build the same analysis files and implement the same statistical analysis in an attempt to yield the same results.
all numbers in a data analysis can be recalculated exactly (down to stochastic variables!)
Reproducible research means:
the ability of a researcher to duplicate the results of a prior study using the same materials as were used by the original investigator. That is, a second researcher might use the same raw data to build the same analysis files and implement the same statistical analysis in an attempt to yield the same results.
Reproducible research in practice:
using the code and raw data provided by the analyst.
all numbers in a data analysis can be recalculated exactly (down to stochastic variables!)
A research product is reproducible if all numbers can be reproduced exactly be applying the same code to the same raw data.
It is the responsibility of the researcher to provide the data and code that make a research product reproducible
Key Concept
3
Consider a dataset that is a time series
1D: exogenous-endogenous variable
time
y depend on x
Consider a dataset that is a time series
1D: exogenous-endogenous variable
time
y depend on x
exogenous variable is sequencial
time has an directionality:
y(t+1) depends on y(t)
Consider a dataset that is a time series
1D: exogenous-endogenous variable
time
y depend on x
exogenous variable is sequencial
time has an directionality:
y(t+1) depends on y(t)
you may have uncertainties...
Consider a dataset that is a time series
1D: exogenous-endogenous variable
time
y depend on x
exogenous variable is sequencial
time has an directionality:
y(t+1) depends on y(t)
you may have uncertainties...
A time series is any measurable quantity sampled at multiple points in time.
Time series are series of exogenous-endogenous variable pairs where the exogenous variable is time, and therefore it is a sequential quantity with a specific direction of evolution.
Key Concept
Consider a dataset that is not a time series
Evenly vs Unevenly sampled time series.
Most statistical methods are developed for evenly sampled TS.
Most physical TS are unevenly sampled
time
time
evenly: dt is constant
unevenly: dt changes
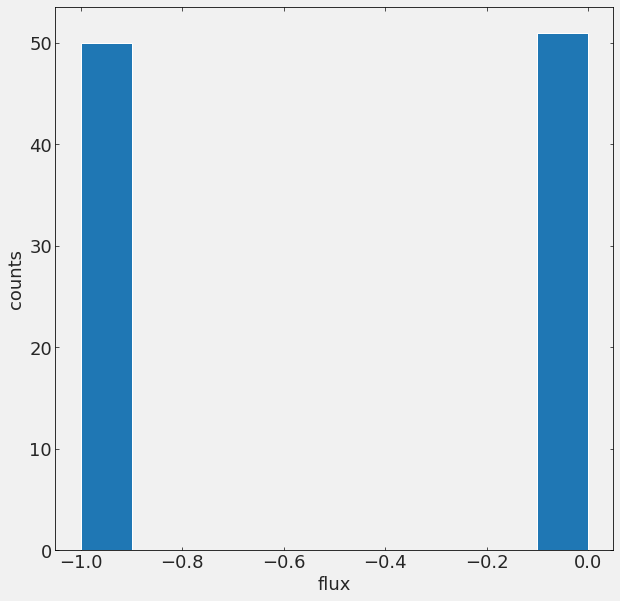
Target measurements:
1) measuring intensity as a function of time
e.g.
- stellar photometry
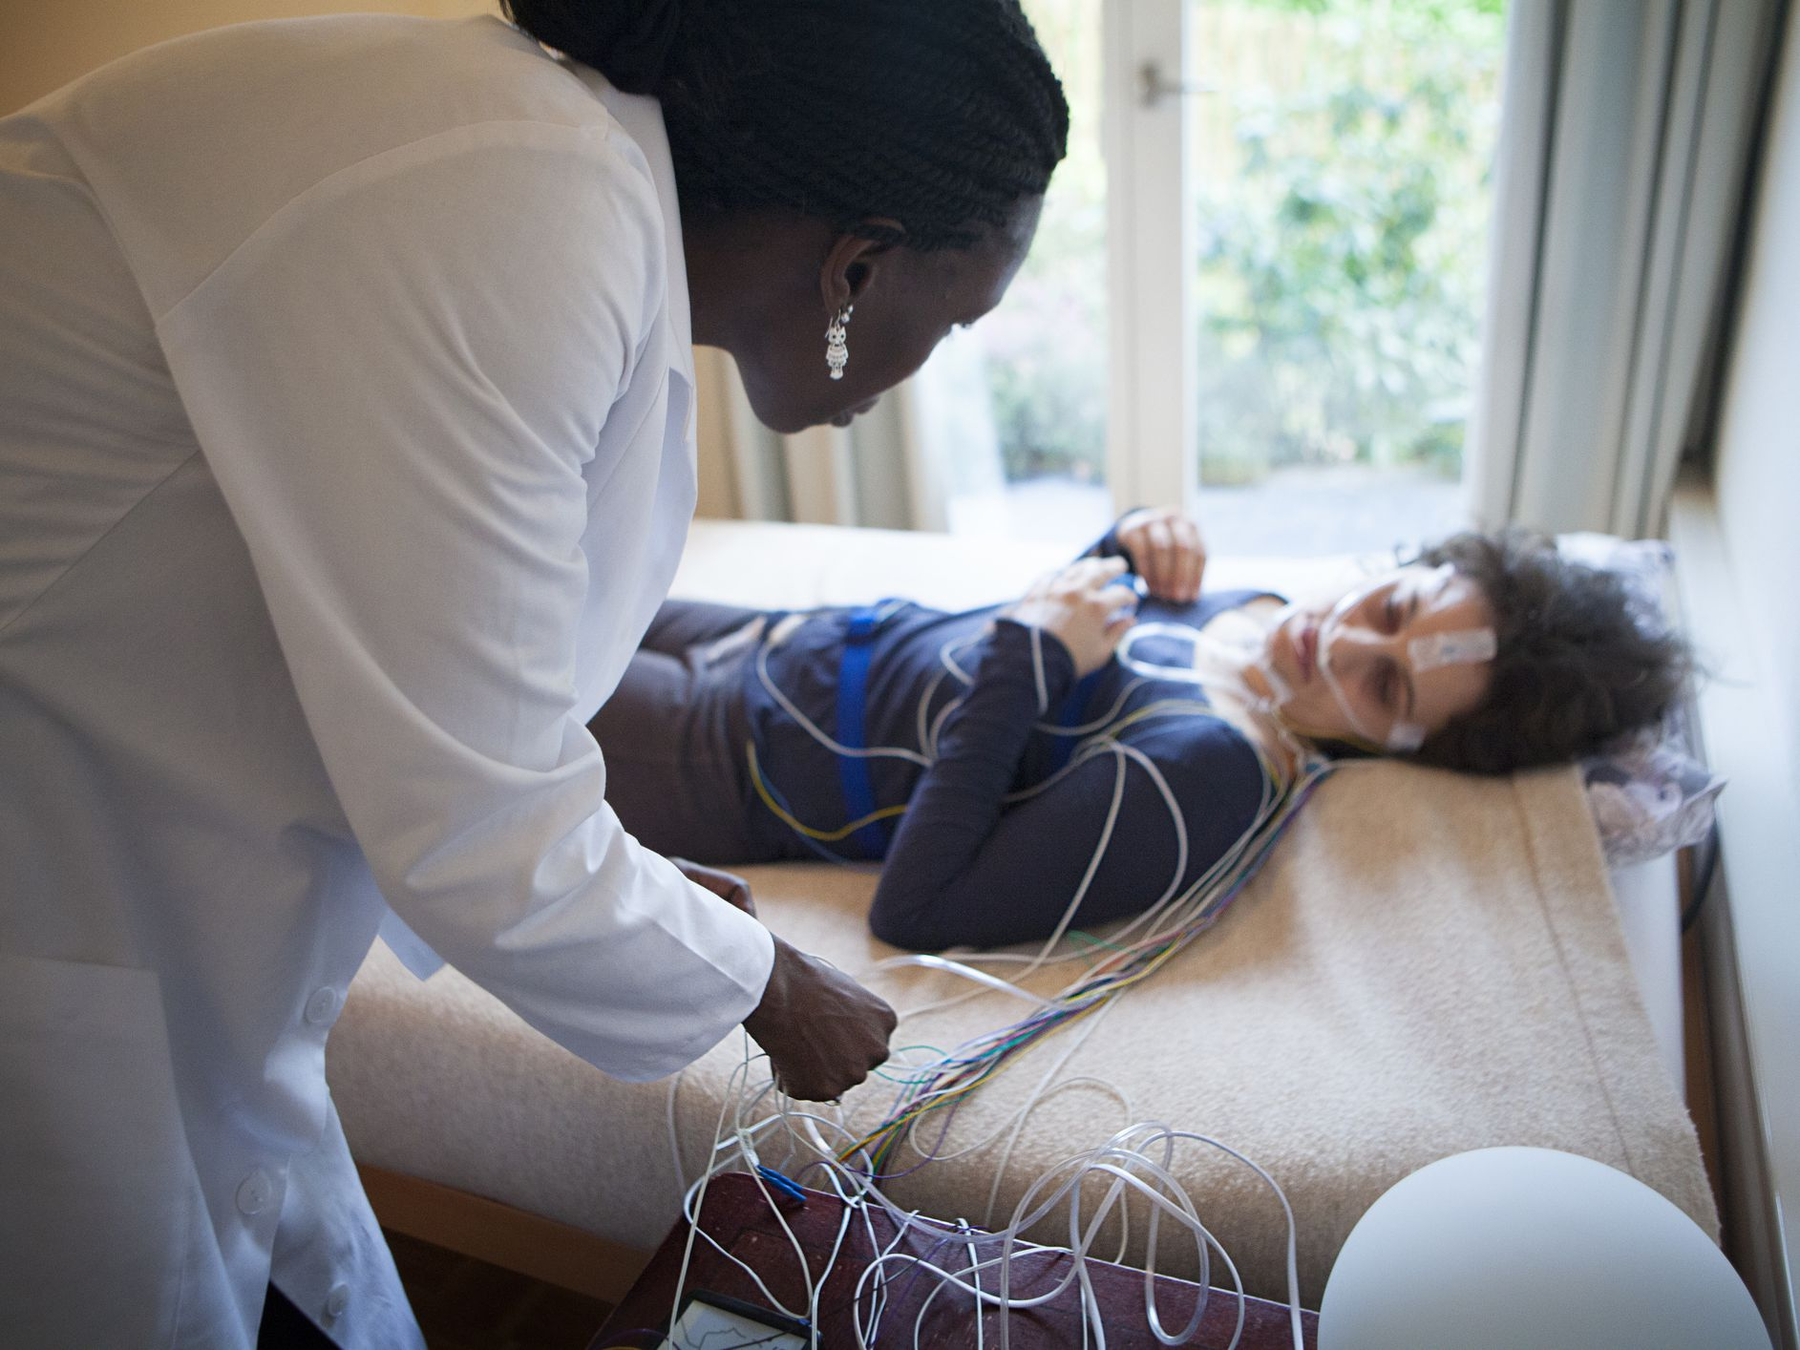
- brain electrical activity
2) measuring arrival time
e.g.
- high energy cosmic rays counting.
- atomic decay with geiger counts
time
time
4
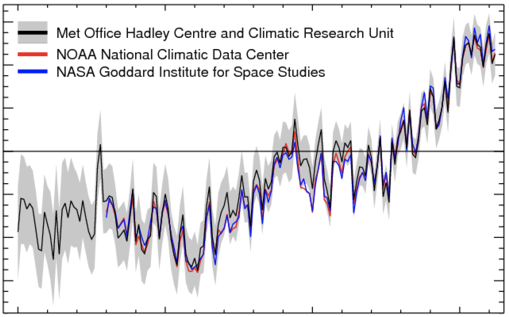
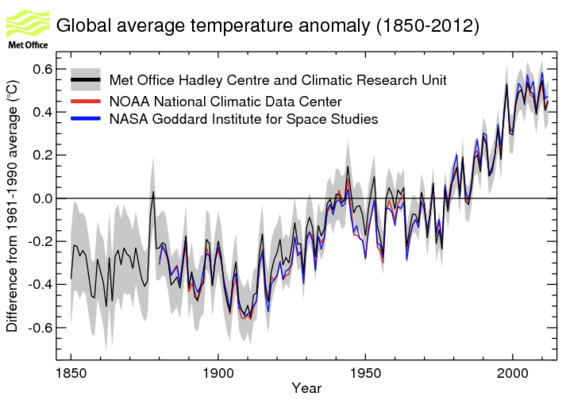
Trend detection
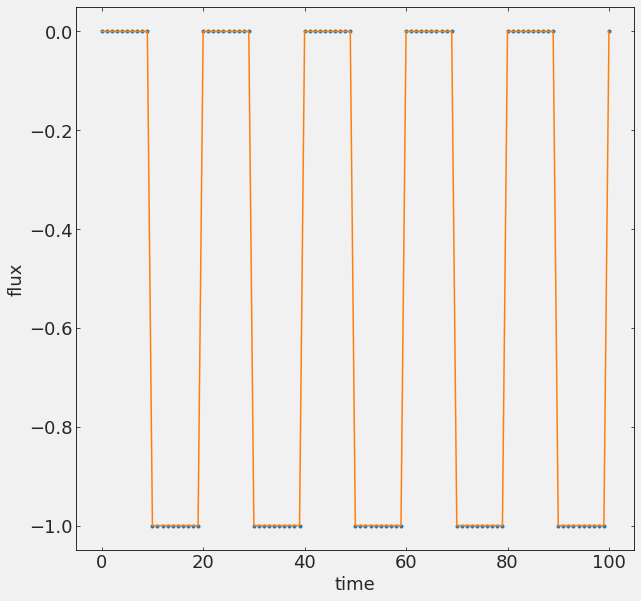
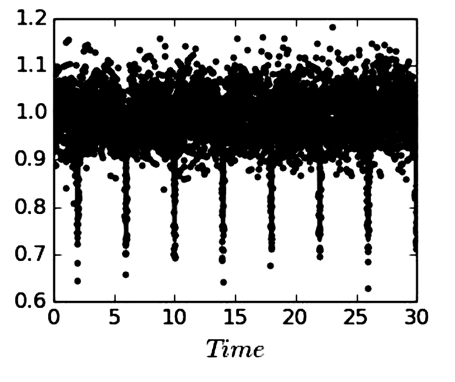
periodicity/seasonality detection
periodicity/seasonality detection
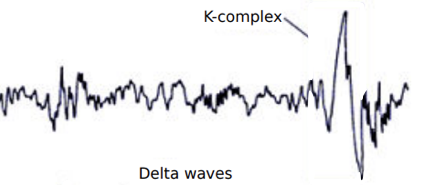
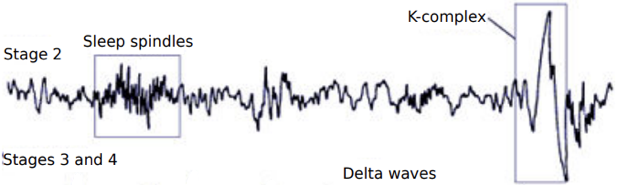
event detection
event detection
https://www.neurologic.theclinics.com/article/S0733-8619(05)00041-1/fulltext
The 3 behavioral states of wakefulness, rapid eye movement (REM) sleep, and non-REM (NREM)
sleep are characterized by specific changes in electroencephalography,
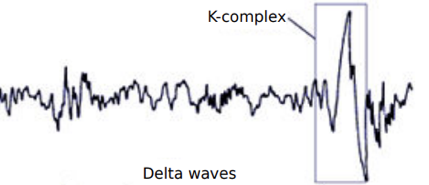
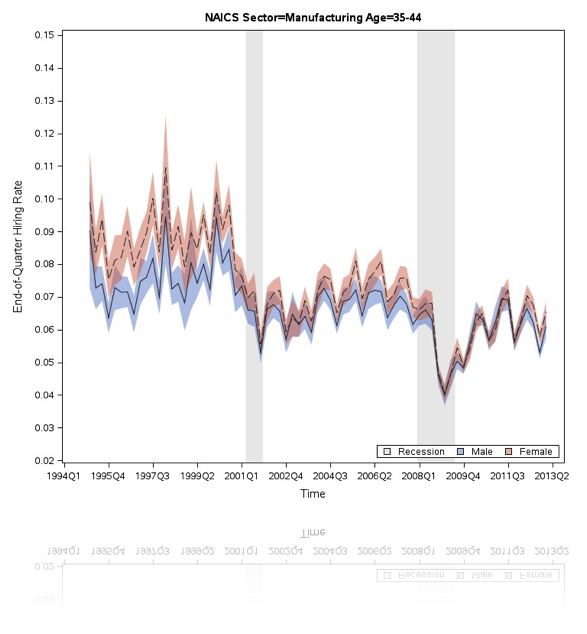
Point of change detection
Longitudinal Employer-Household Dynamics
Longitudinal Employer-Household Dynamics
seasonal variations,
cyclic variation,
periodicity
Forecasting/Prediction
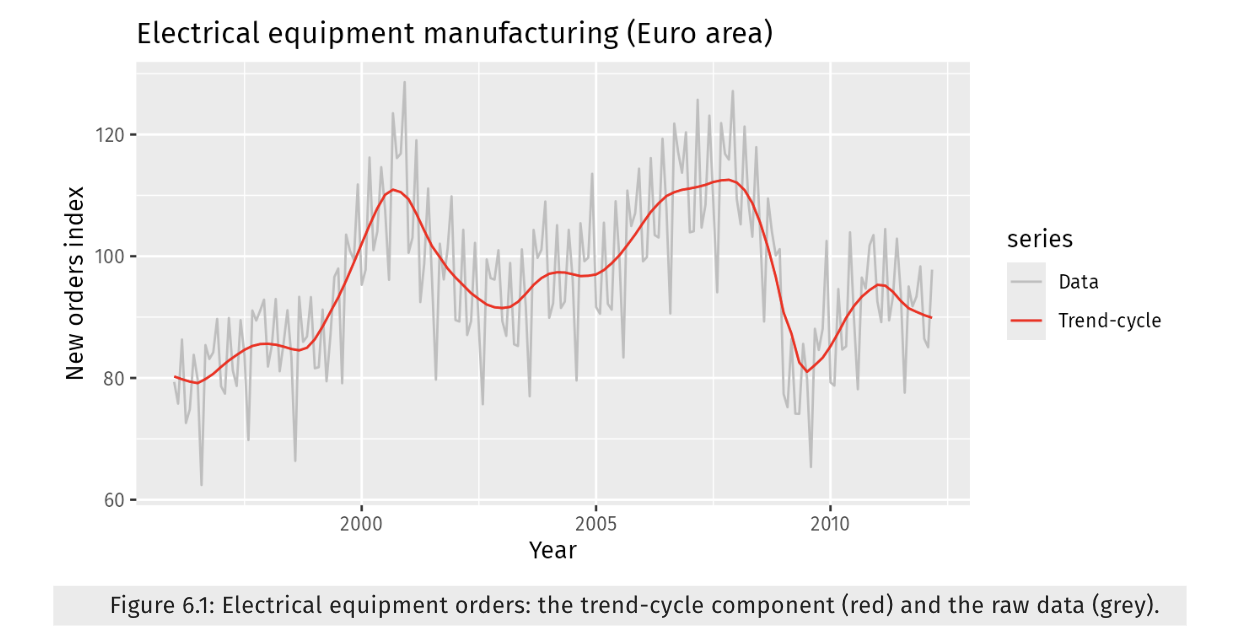
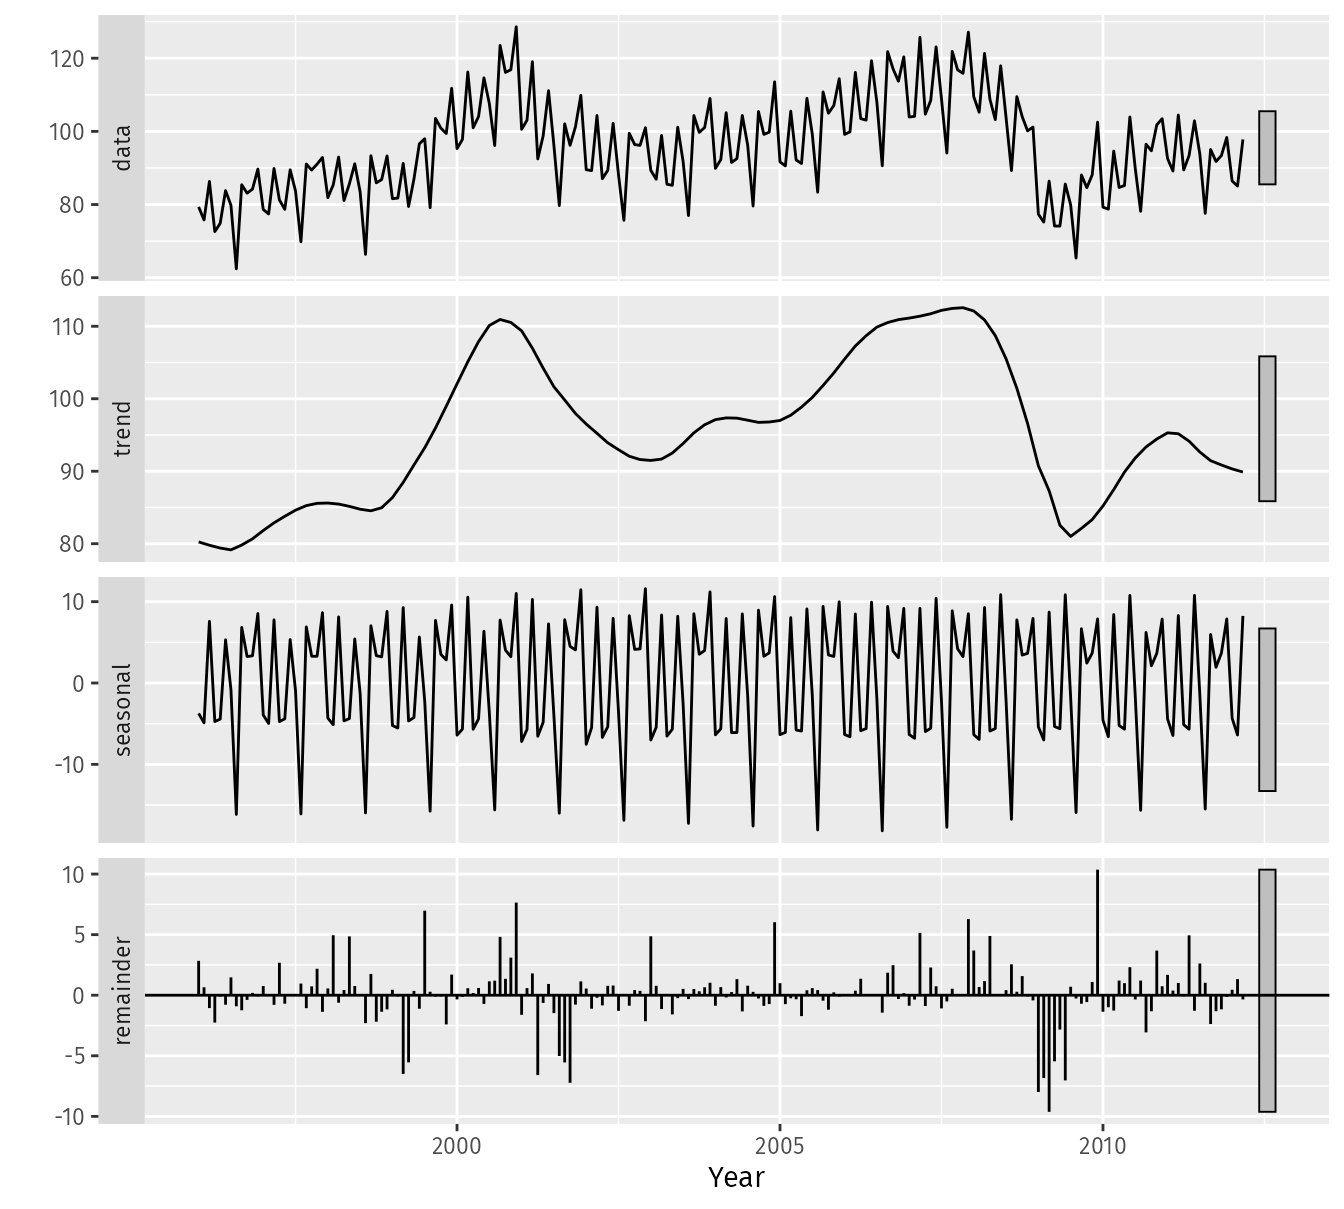
Time Series Components
Time Series Components
Time Series Components
Time Series Components
Time Series Components
Common issues
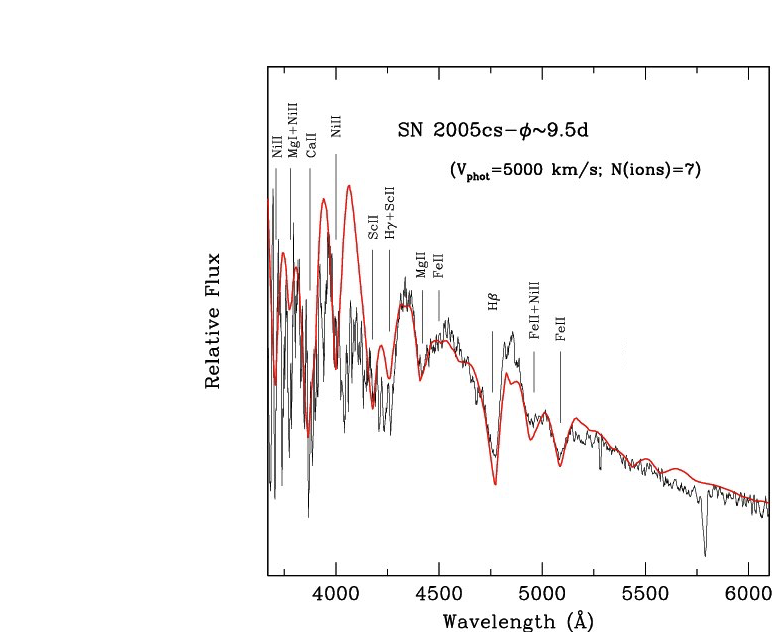
It is also a series of exogenous-endogenous variable pairs where the exogenous variable is time, and therefore it is a sequential quantity with a specific direction of evolution.
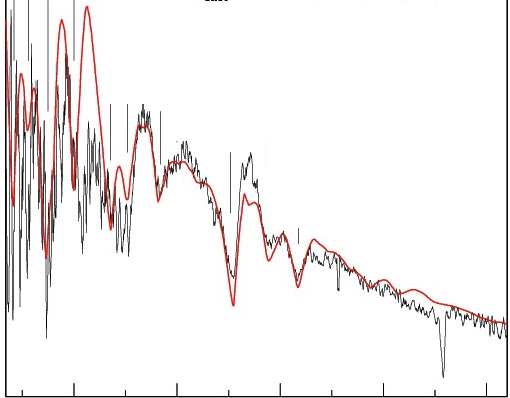
A spectrum is a measurable quantity sampled at multiple points in wavelength.
5
[Machine Learning is the] field of study that gives computers the ability to learn without being explicitly programmed.
Arthur Samuel, 1959
[Machine Learning is the] field of study that gives computers the ability to learn without being explicitly programmed.
Arthur Samuel, 1959
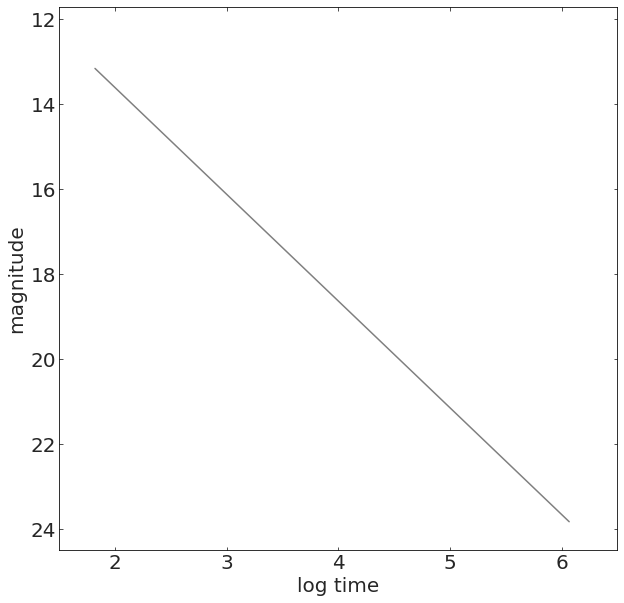
model
parameters: slope (a), intercept (b)
Model:
a mathematical formula with parameters
Model:
a mathematical formula with parameters
[Machine Learning is the] field of study that gives computers the ability to learn without being explicitly programmed.
Arthur Samuel, 1959
model variable: x - for us this will always be time
model
parameters: slope (a), intercept (b)
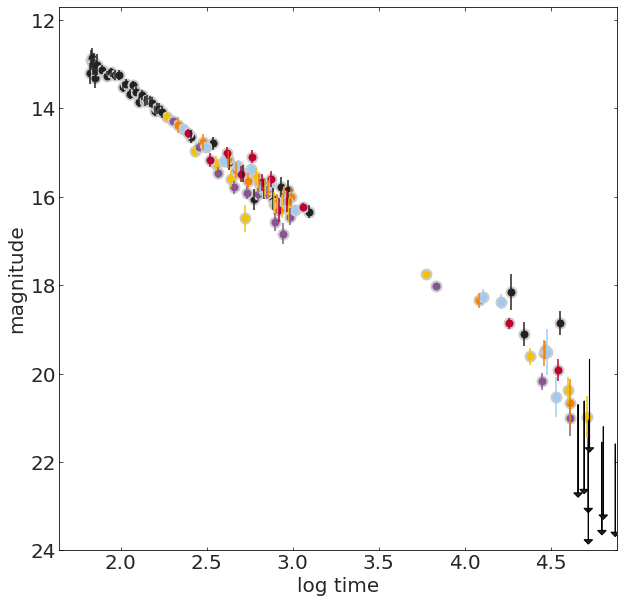
Data:
a set of observations
Model:
a mathematical formula with parameters
[Machine Learning is the] field of study that gives computers the ability to learn without being explicitly programmed.
Arthur Samuel, 1959
[Machine Learning is the] field of study that gives computers the ability to learn without being explicitly programmed.
Arthur Samuel, 1959
Data:
a set of observations
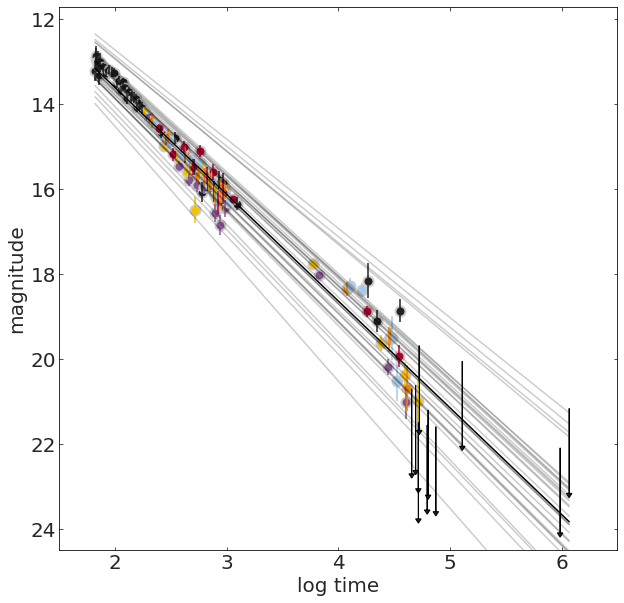
Model:
a mathematical formula with parameters
for every parameter there are an infinity of models
[Machine Learning is the] field of study that gives computers the ability to learn without being explicitly programmed.
Arthur Samuel, 1959
Data:
a set of observations
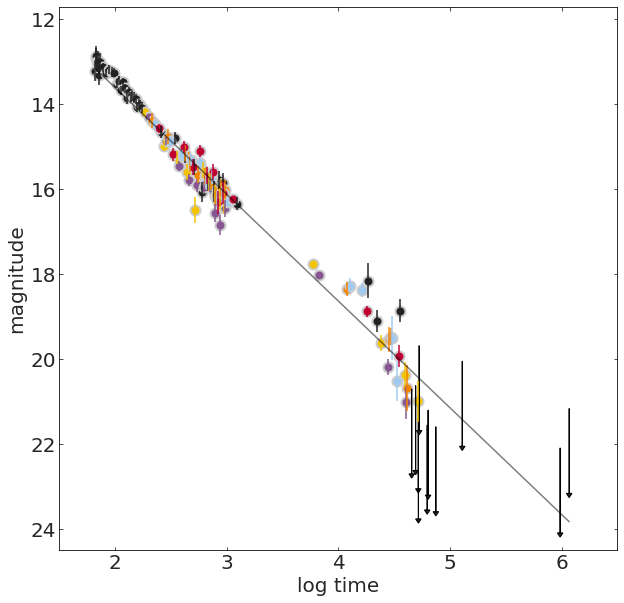
Model:
a mathematical formula with parameters
Use the data to learn the parameters of the model
Machine Learning models are parametrized representation of "reality" where the parameters are learned from finite sets of realizations of that reality
Machine Learning is the disciplines that conceptualizes, studies, and applies those models.
Key Concept
Use the data to learn the parameters of the model
the best way to think about it in the ML context:
a model is a low dimensional representation of a higher dimensionality dataset
6
Linear Regression
WHY?
Fitting a line
ax+b
to data y
WHY?
Fitting a line
ax+b
to data y
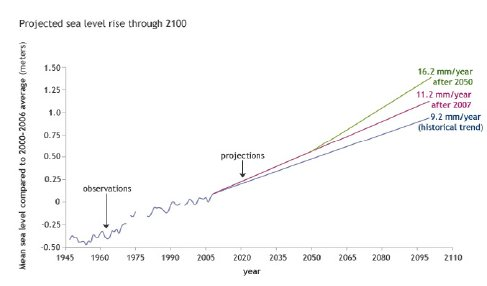
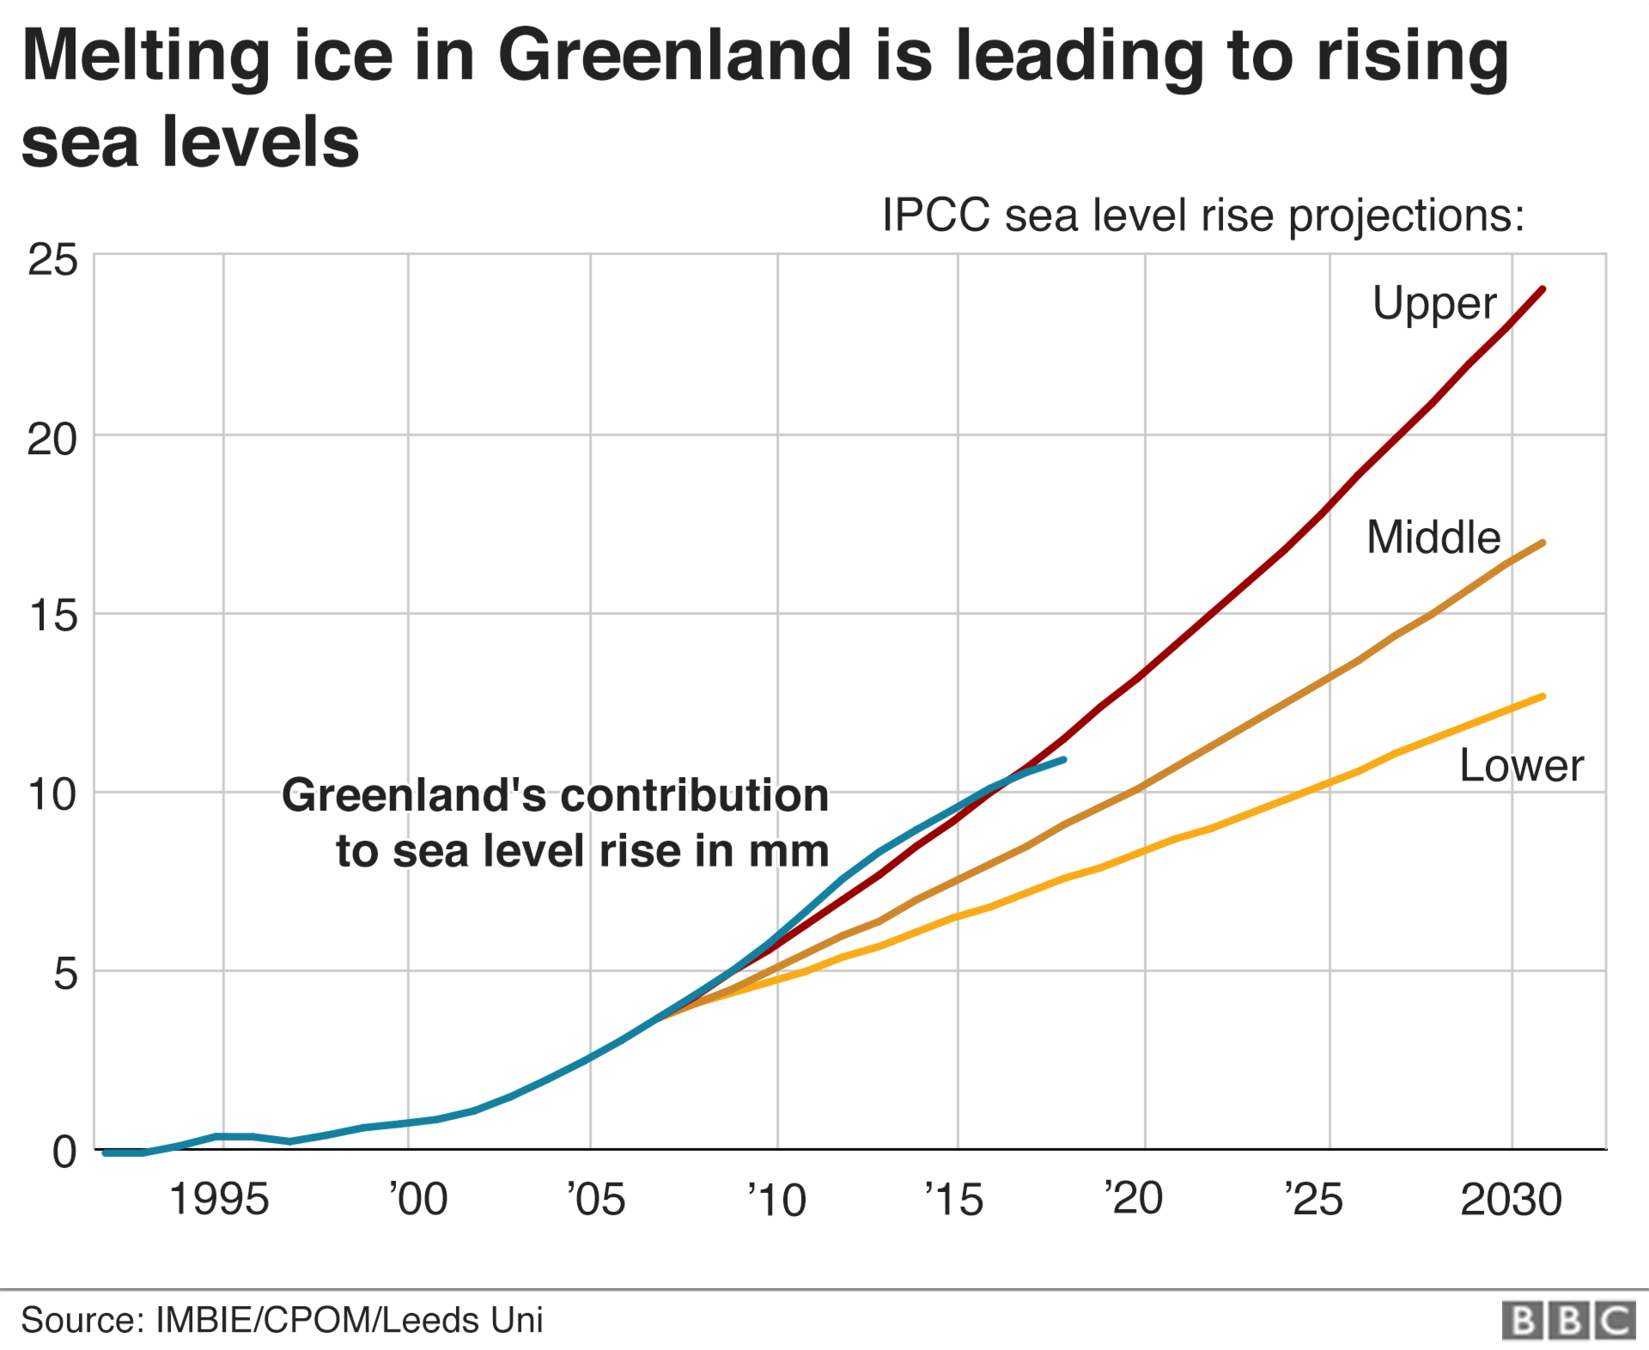
To predict and forecast
time (year)
See level contribution (mm)
Linear Regression
To explain
distance / age of the Universe
Universe's expansion rate
supernova (stellar explosion)
measure the expansion rate at the Universe as a function of time.
Deviation from linear falsify an adiabatically expanding Universe
time (year)
WHY?
Fitting a line
ax+b
to data y
To predict and forecast
See level contribution (mm)
Linear Regression
Key Concept
Model Fitting
We fit models to data in order to:
Predict and forecast: predict the value of the endogenous (dependent) variable at locations of the exogenous (independent, time) variable where we have no observations. This can be within the observed range, or outside of the range, which in time-series means predict the future (forecast)
Explain: relate observed behavior to first principles or behavior of possibly variables to explain the evolution and assess causality.
E.g. fitting a parabola to a bouncing ball demonstrates that gravity (and initial velocity) explains the behavior
analytical solution
6.1
It can be shown that the optimal parameters for a line fit to data without uncertainties is:
X = np.c_[np.ones((len(grbAG) - grbAG.upperlimit.sum(), 1)),
	grbAG[grbAG.upperlimit == 0].logtime]
y = grbAG.loc[grbAG.upperlimit == 0].mag

theta_best = np.linalg.inv(X.T.dot(X)).dot(X.T).dot(y)It can be shown that the optimal parameters for a line fit to data without uncertainties is:
2xN Nx2 2xN Nx1
X = np.c_[np.ones((len(grbAG) - grbAG.upperlimit.sum(), 1)),
	grbAG[grbAG.upperlimit == 0].logtime]
y = grbAG.loc[grbAG.upperlimit == 0].mag

theta_best = np.linalg.inv(X.T.dot(X)).dot(X.T).dot(y)
It can be shown that the optimal parameters for a line fit to data without uncertainties is:
from sklearn.linear_model import LinearRegression
lr = LinearRegression()

X = np.c_[np.ones((len(grbAG) -
	grbAG.upperlimit.sum(), 1)),
	grbAG[grbAG.upperlimit == 0].logtime]
y = grbAG.loc[grbAG.upperlimit == 0].mag
lr.fit(X, y)
lr.coef_, lr.intercept_
We can let sklearn solve the equation for us:
2x1
2xN Nx2 2xN Nx1
X = np.c_[np.ones((len(grbAG) - grbAG.upperlimit.sum(), 1)),
	grbAG[grbAG.upperlimit == 0].logtime]
y = grbAG.loc[grbAG.upperlimit == 0].mag

theta_best = np.linalg.inv(X.T.dot(X)).dot(X.T).dot(y)linear correlation
6.1
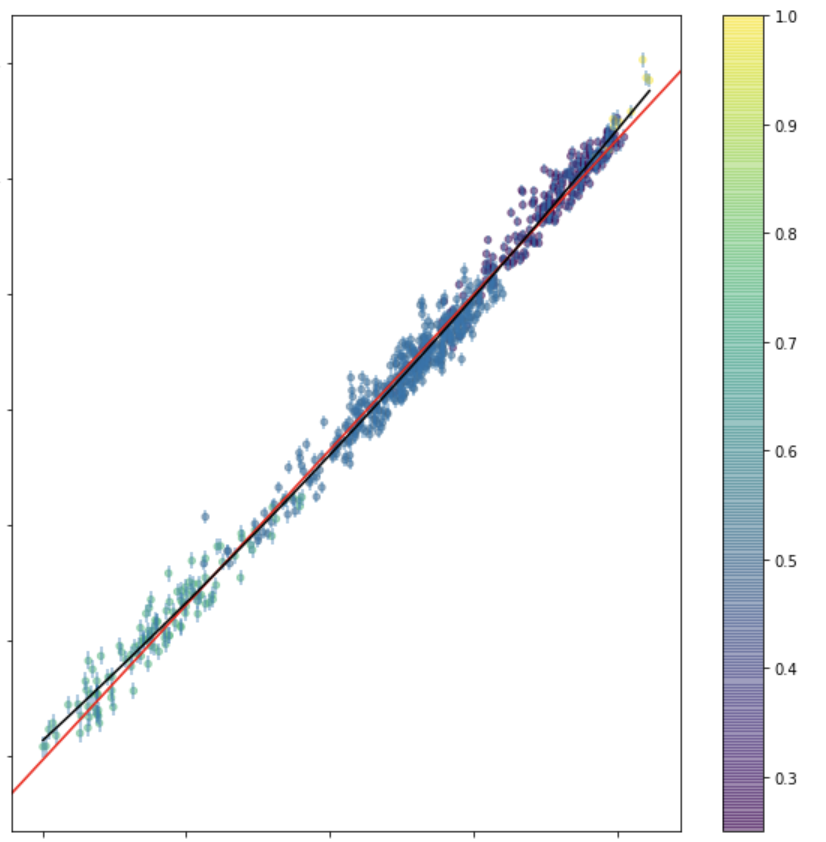
Pearson's correlation
Pearson's correlation measures linear correlation
Pearson's correlation
Pearson's correlation measures linear correlation
correlated
"positively" correlated
Pearson's correlation
Pearson's correlation measures linear correlation
correlated
"positively" correlated
Pearson's correlation
Pearson's correlation measures linear correlation
anticorrelated
"negatively" correlated
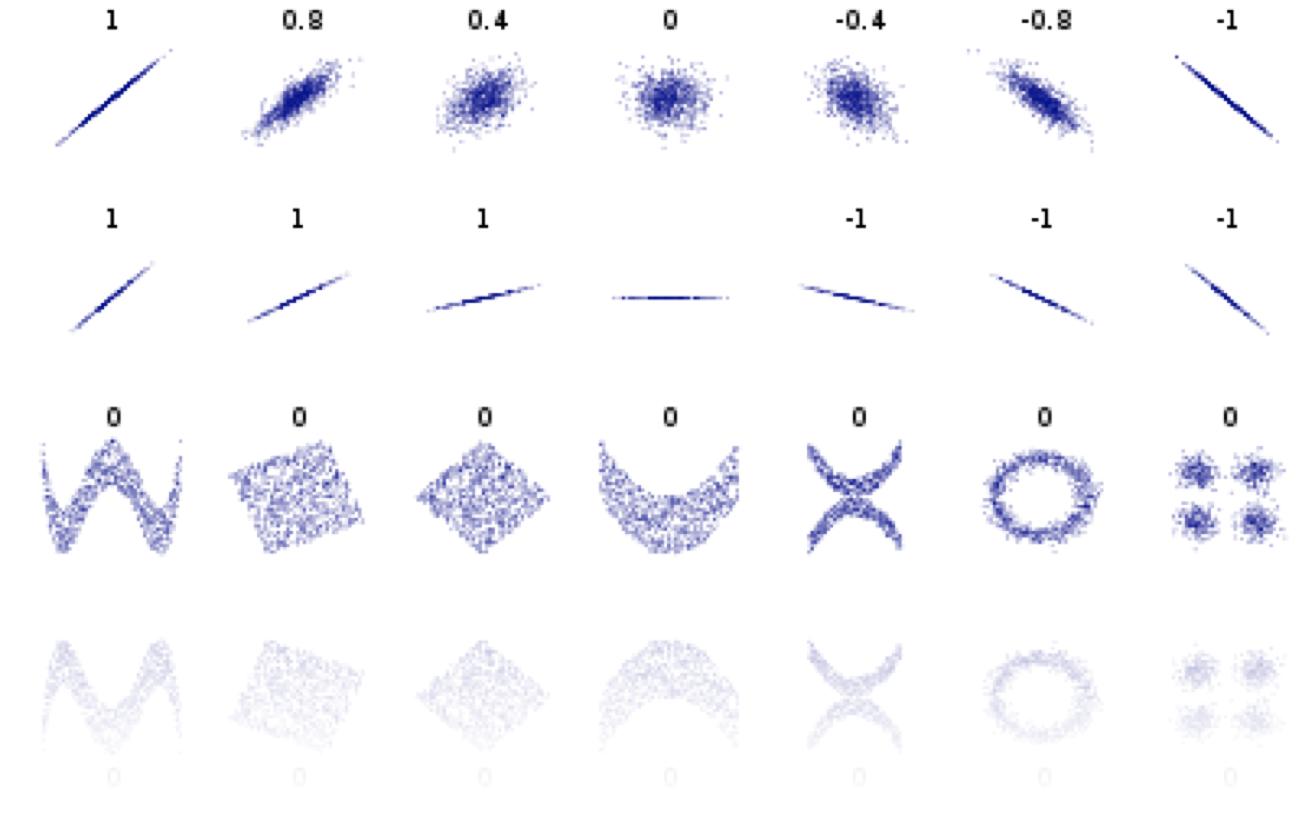
Pearson's correlation
Pearson's correlation measures linear correlation
anticorrelated
"negatively" correlated
Pearson's correlation
Pearson's correlation measures linear correlation
not linearly correlated
Pearson's coefficient = 0
does not mean that x and y are independent!
Pearson's correlation
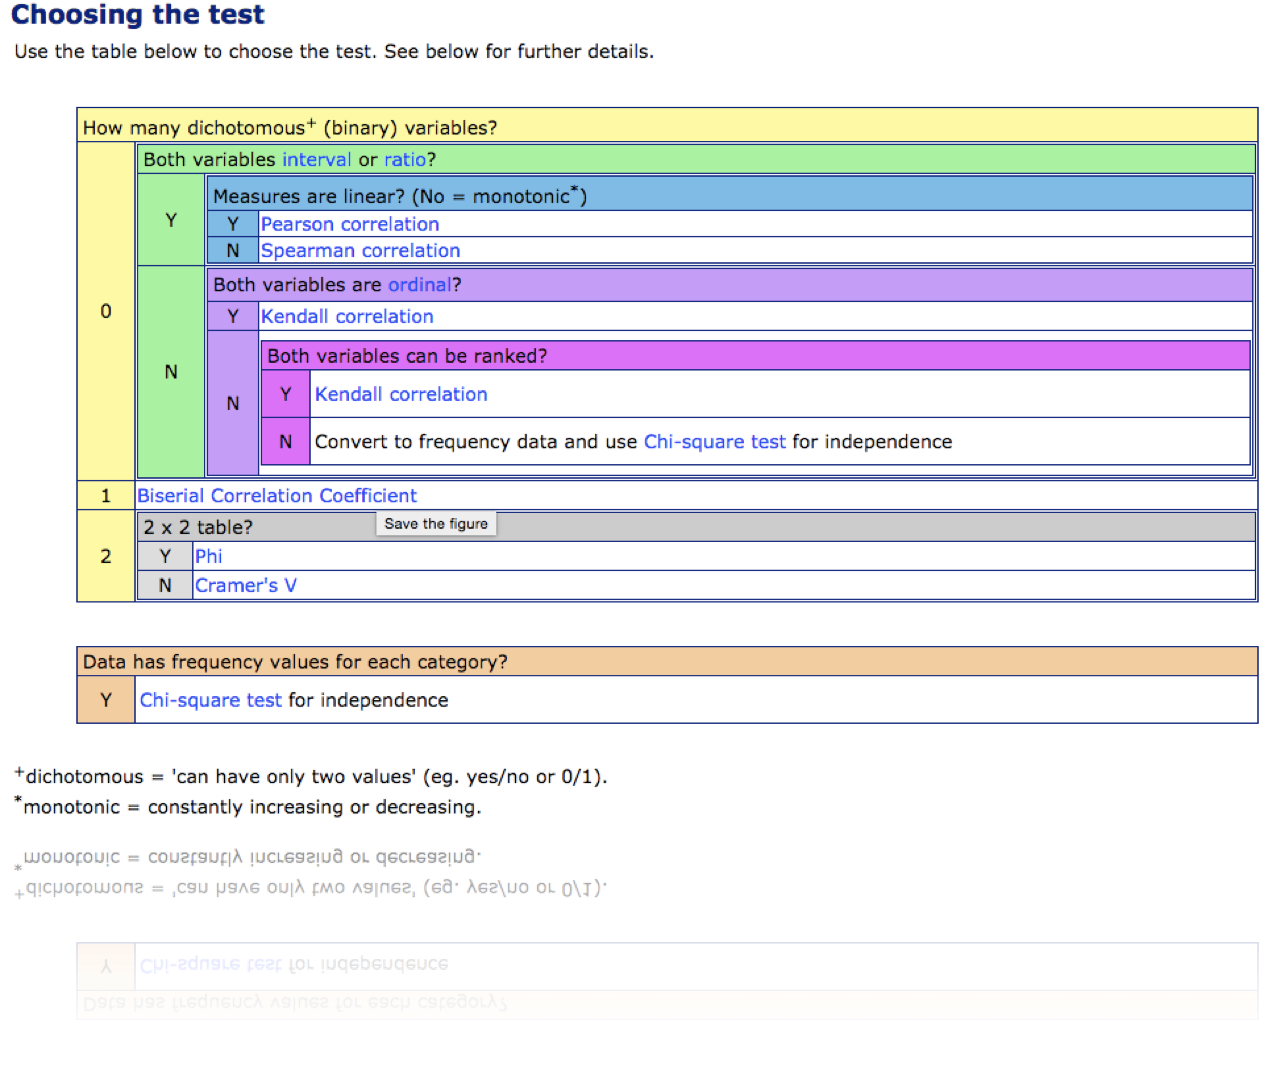
Spearman's test
(Pearson's for ranked values)
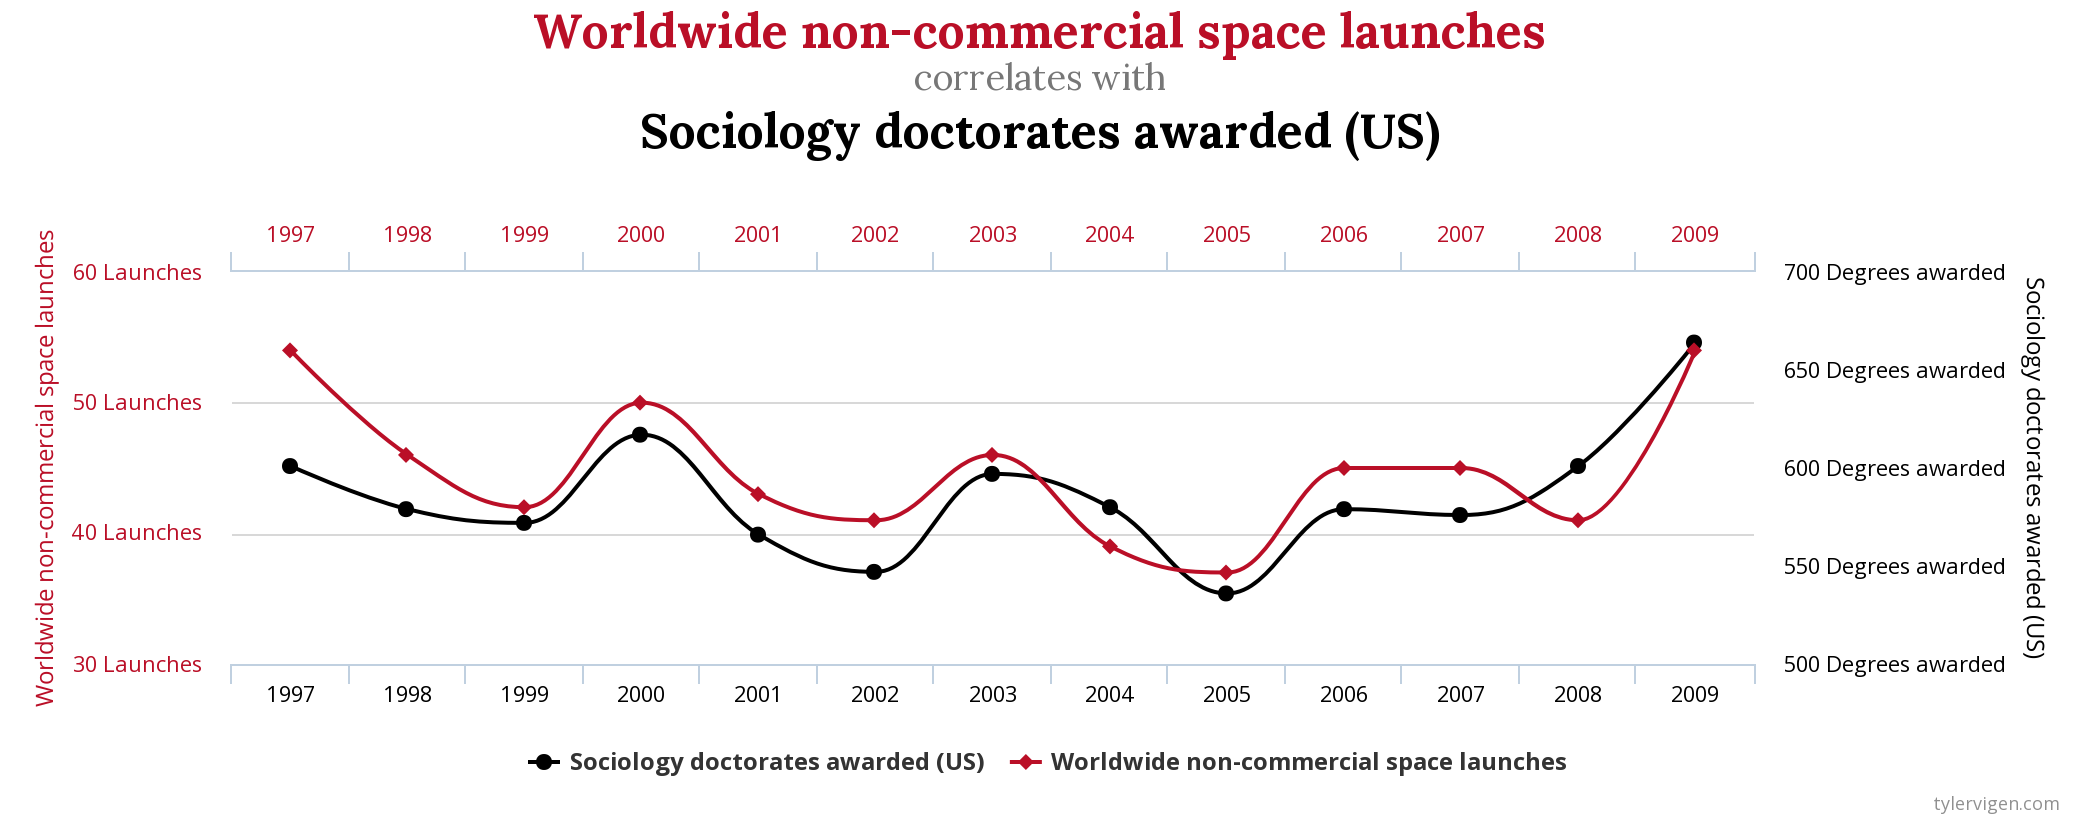
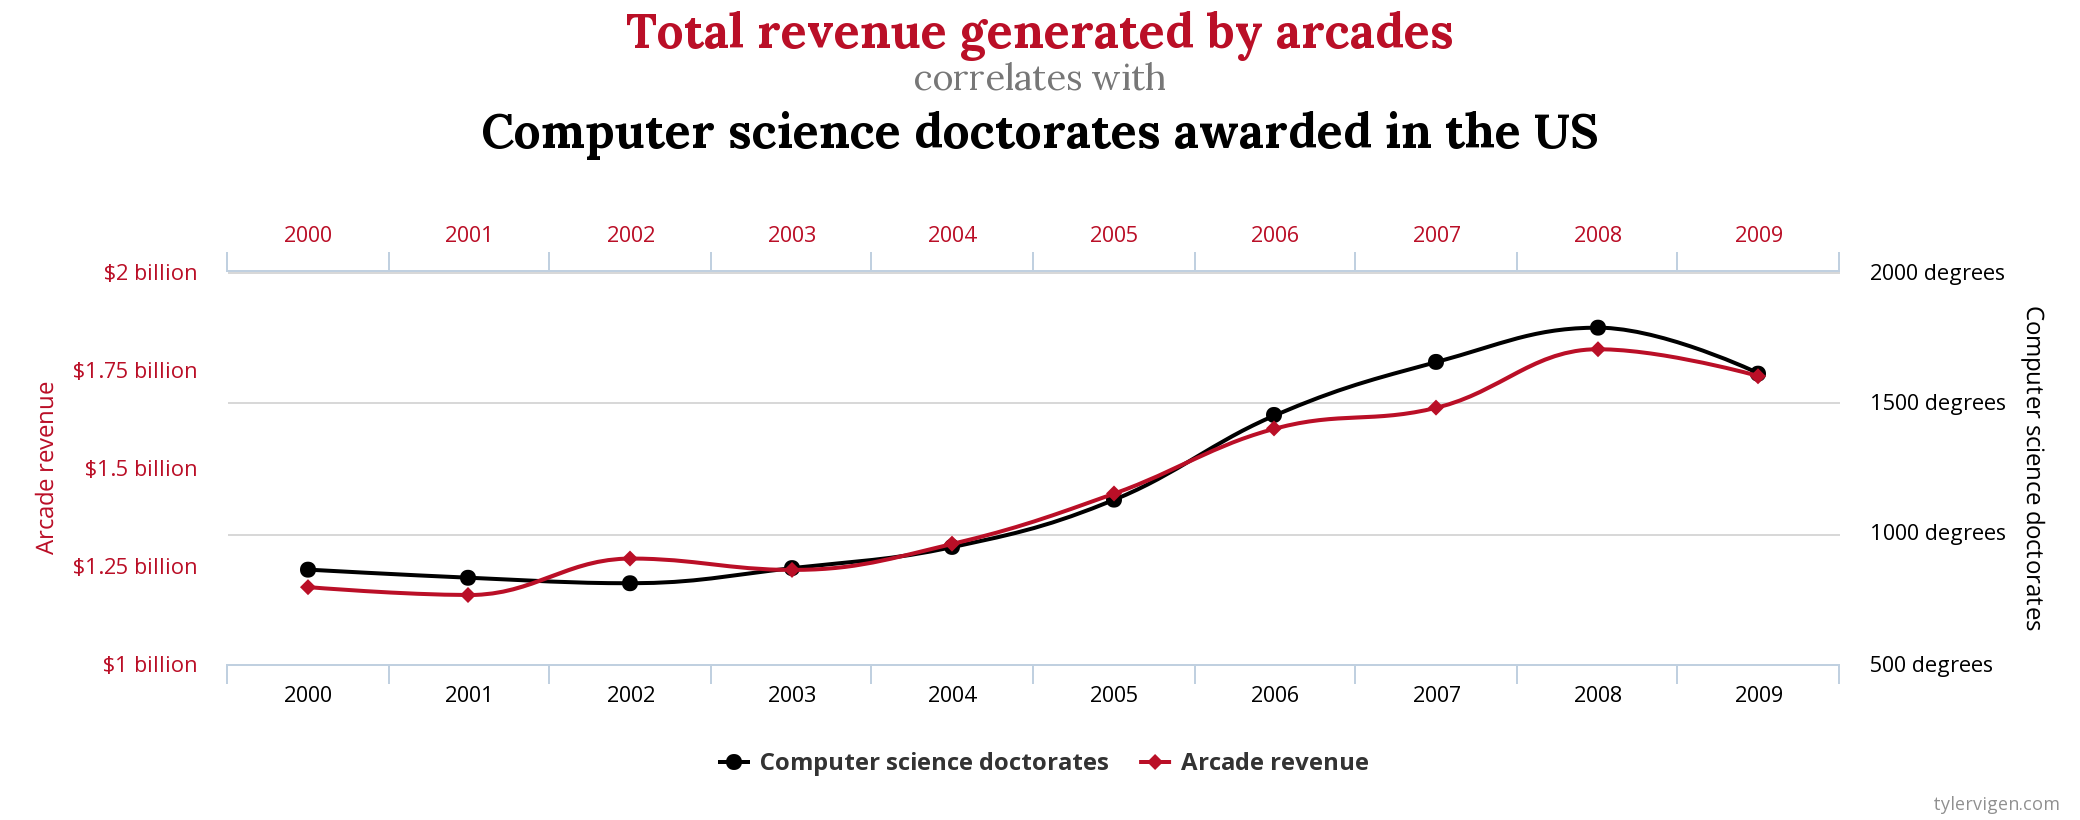
Correlation does not imply causality!!
2 things may be related because they share a cause but not cause each other:
icecream sales with temperature |death by drowning
with temperature
In the era of big data you may encounter truly spurious correlations
divorce rate in Maine | consumption of Margarine
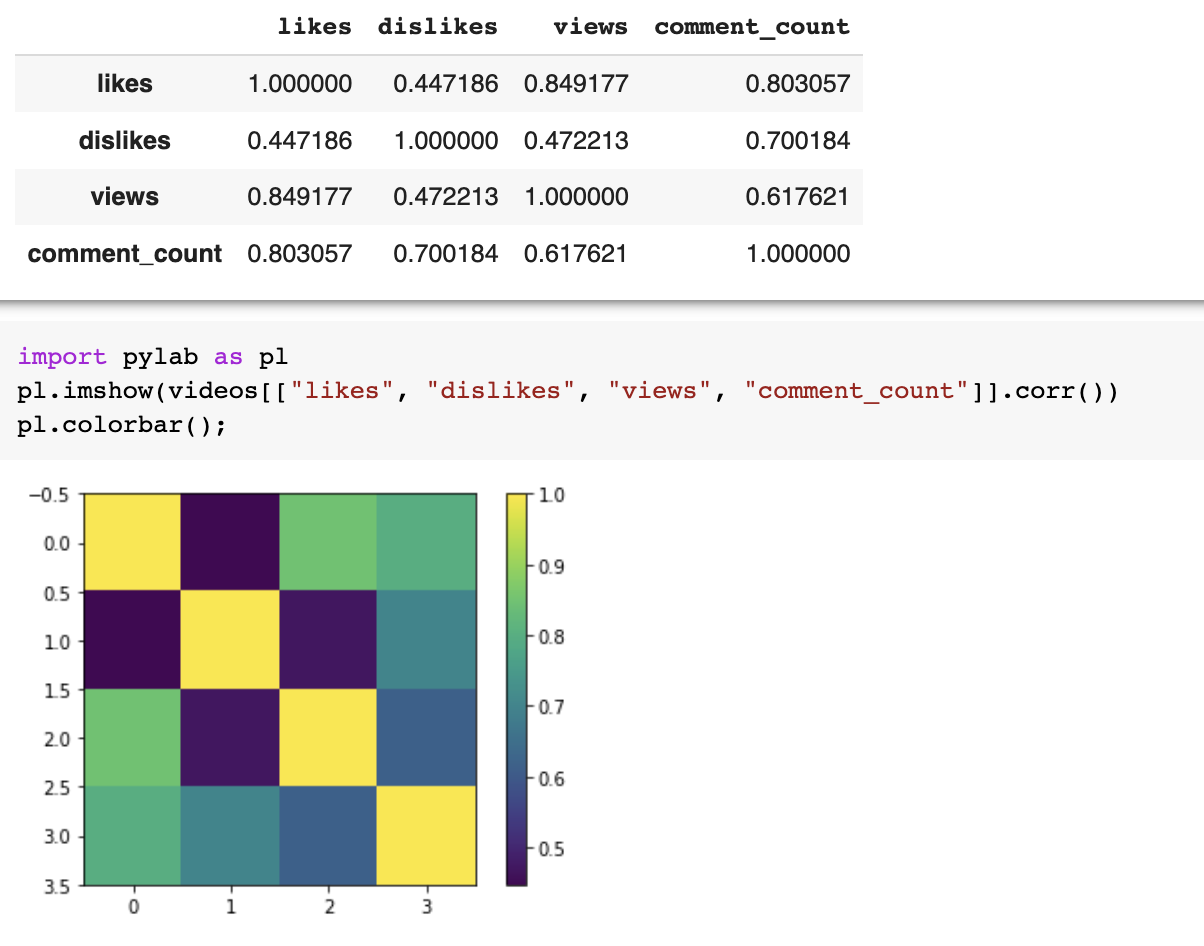
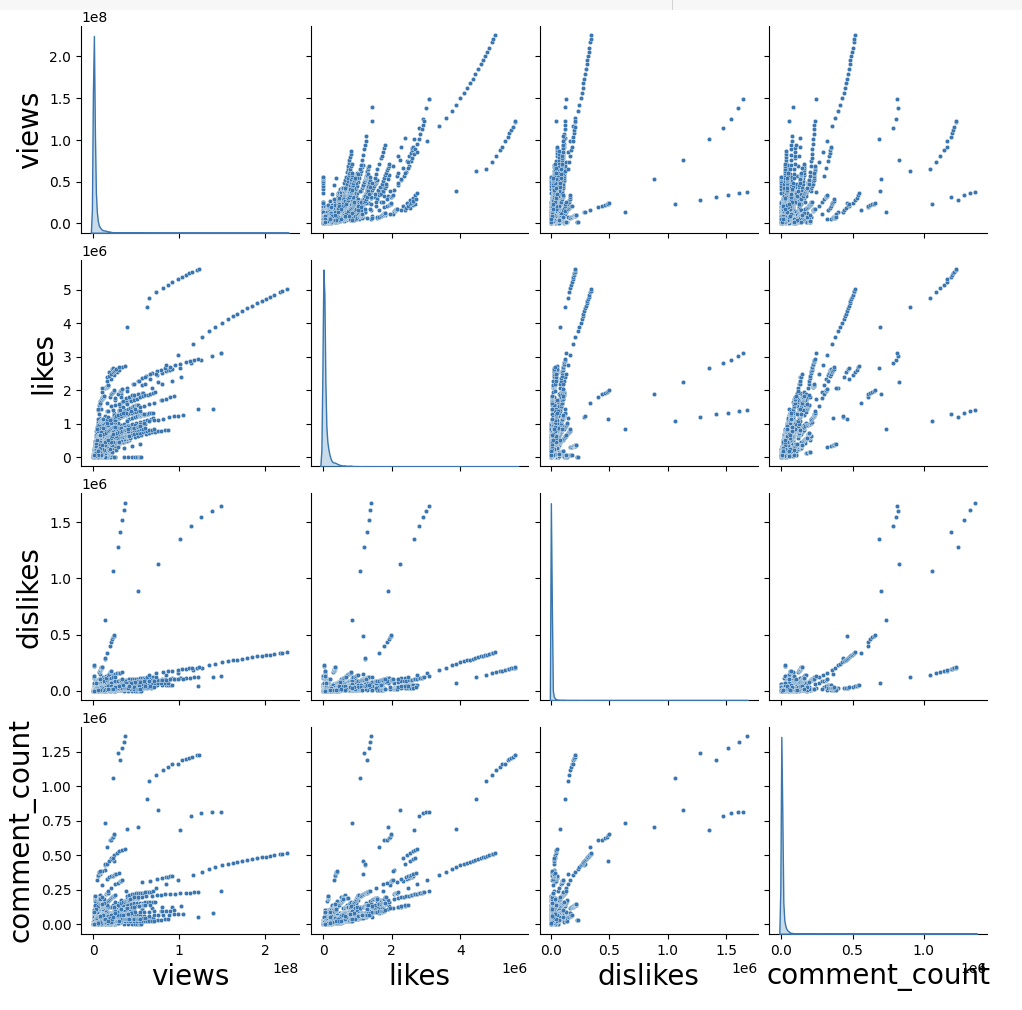
Pearson's correlation
import pandas as pd
df = pd.read_csv(file_name)
df.corr()import pandas as pd
df = pd.read_csv(file_name)
df.corr()pl.imshow(vdf.corr(), clim=(-1,1), cmap='RdBu')
pl.xticks(list(range(len(df.corr()))),
df.columns, rotation=45)
pl.yticks(list(range(len(df.corr()))),
df.columns, rotation=45)
pl.colorbar();<- anticorrelated | correlated ->
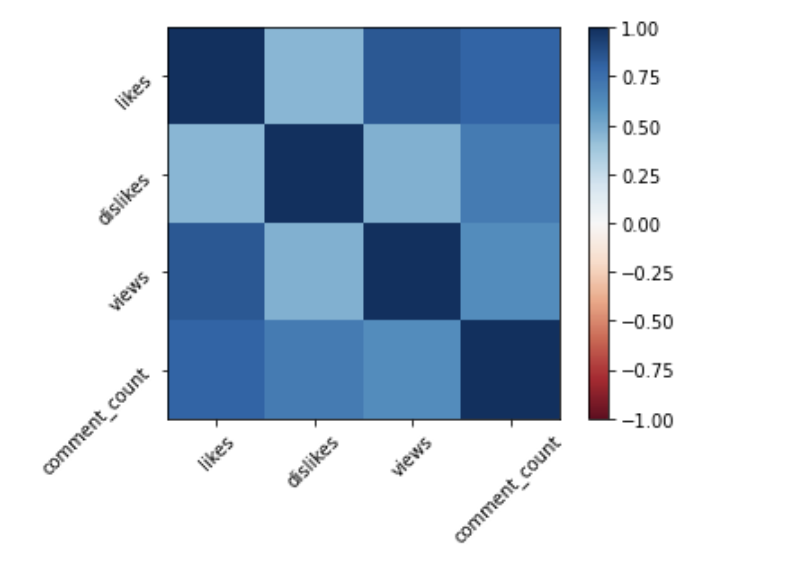
Pearson's correlation
import pandas as pd
df = pd.read_csv(file_name)
df.corr()import pandas as pd
df = pd.read_csv(file_name)
df.corr()pl.imshow(vdf.corr(), clim=(-1,1), cmap='RdBu')
pl.xticks(list(range(len(df.corr()))),
df.columns, rotation=45)
pl.yticks(list(range(len(df.corr()))),
df.columns, rotation=45)
pl.colorbar();objective function
6.2
time
time
time
time
time
time
which is the "best fit" line? A , B, C, D?
A
B
C
D
time
time
time
which is the "best fit" line? A , B, C, D?
A
B
C
D
time
time
time
which is the "best fit" line? A , B, C, D?
A
B
C
D
time
time
time
which is the "best fit" line? A , B, C, D?
A
B
C
D
time
time
time
which is the "best fit" line? A , B, C, D?
A
B
C
D
time
time
time
chi square: relates to the likelihood if the distribution is Gaussian
from scipy.optimize import minimize
def line(x, b, a):
    return a * x + b
def fitfunc(args, x, y):
    a, b = args
    return sum((y - line(a, b, x))**2)

x = grbAG.logtime.values
y = grbAG.mag.values
initialGuess = (10, 1)

fitfunc(initialGuess, x, y)
solution = minimize(fitfunc, initialGuess, args=(x, y))from scipy.optimize import minimize
def line(x, b, a):
return a * x + b
def chi2(args, x, y, s):
a, b = args
return sum((y - line(x, b, a))**2 / s)
x = grbAG.logtime.values
y = grbAG.mag.values
s = grbAG.magerr.values
initialGuess = (10, 1)
fitfunc(initialGuess, x, y)
solution = minimize(chi2, initialGuess, args=(x, y, s))
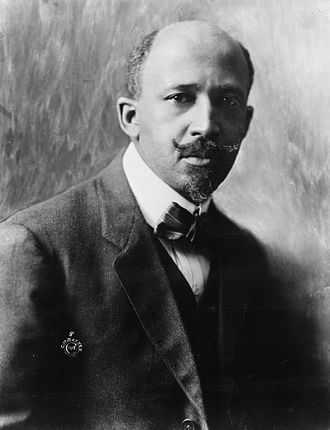
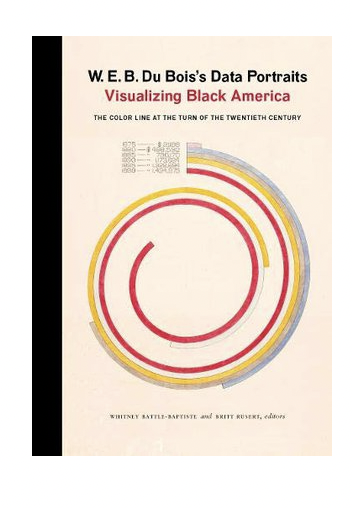
solutionW.E.B. DuBois
W.E.B. Du Bois
February 23, 1868 – August 27, 1963
American sociologist, socialist, historian, civil rights activist, Pan-Africanist, author, writer and editor
https://inspirehep.net/record/1082448/plots
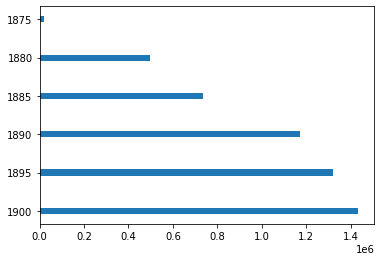
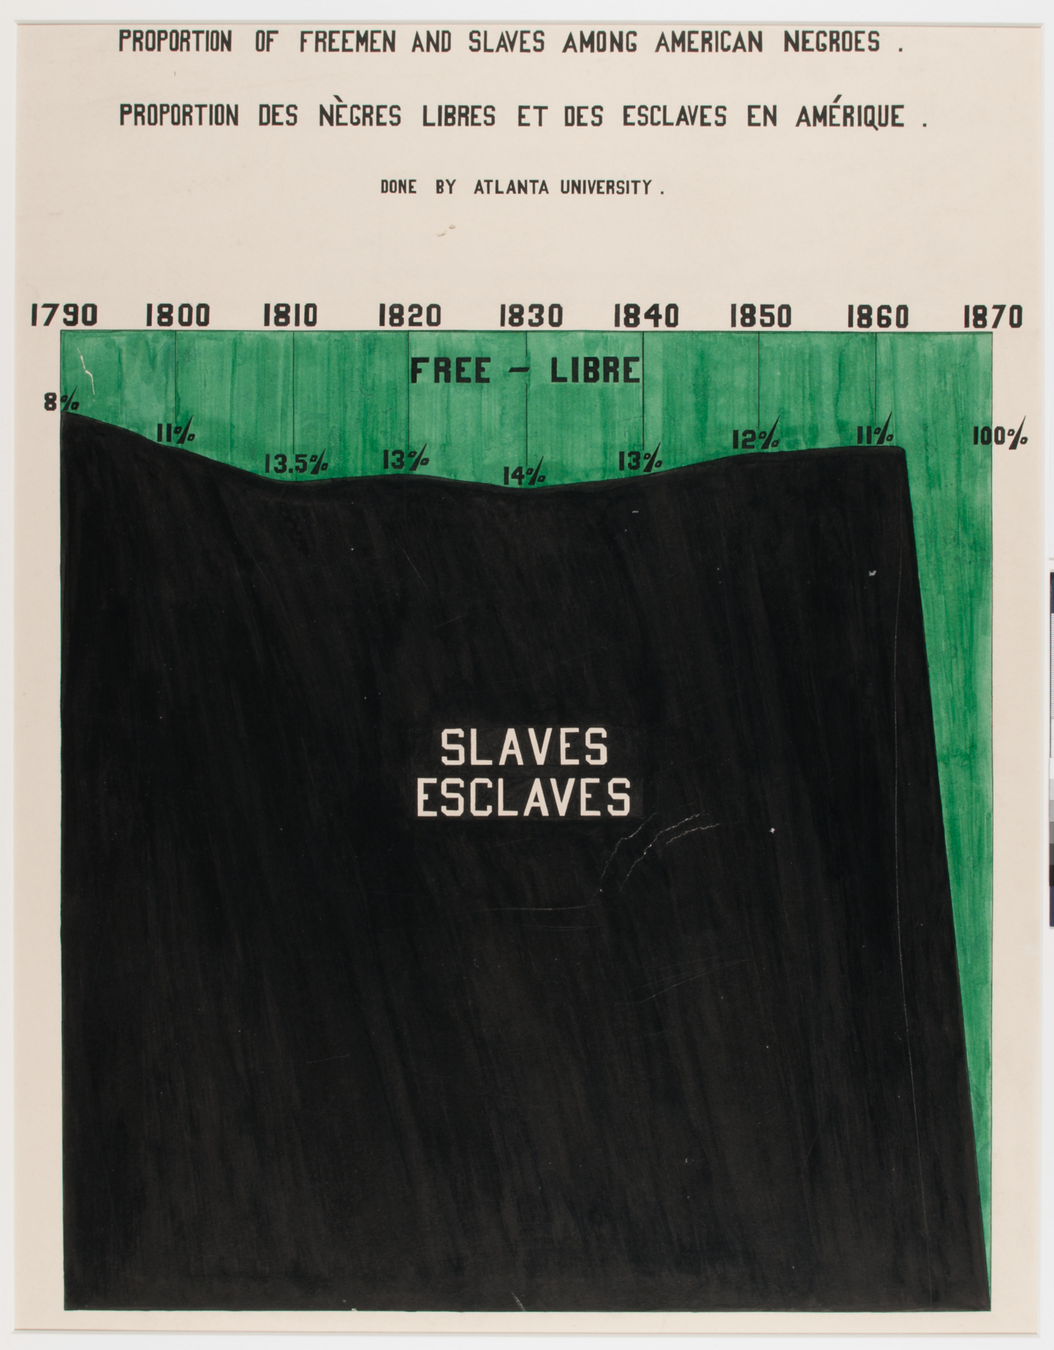
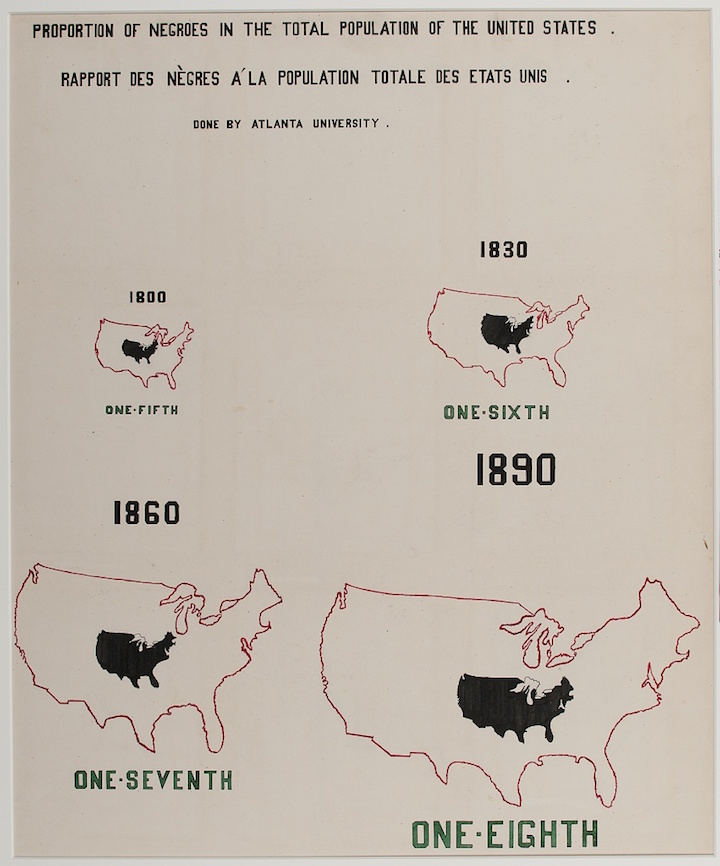
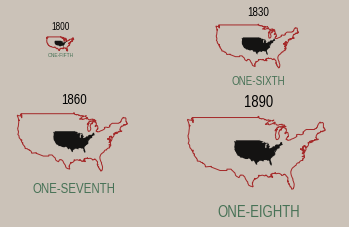
After graduating with a Ph.D. in history from Harvard University, W.E.B. Du Bois, the prominent African-American intellectual, sought a way to process all this information showing why the African disapora in America was being held back in a tangible, contextualized form.
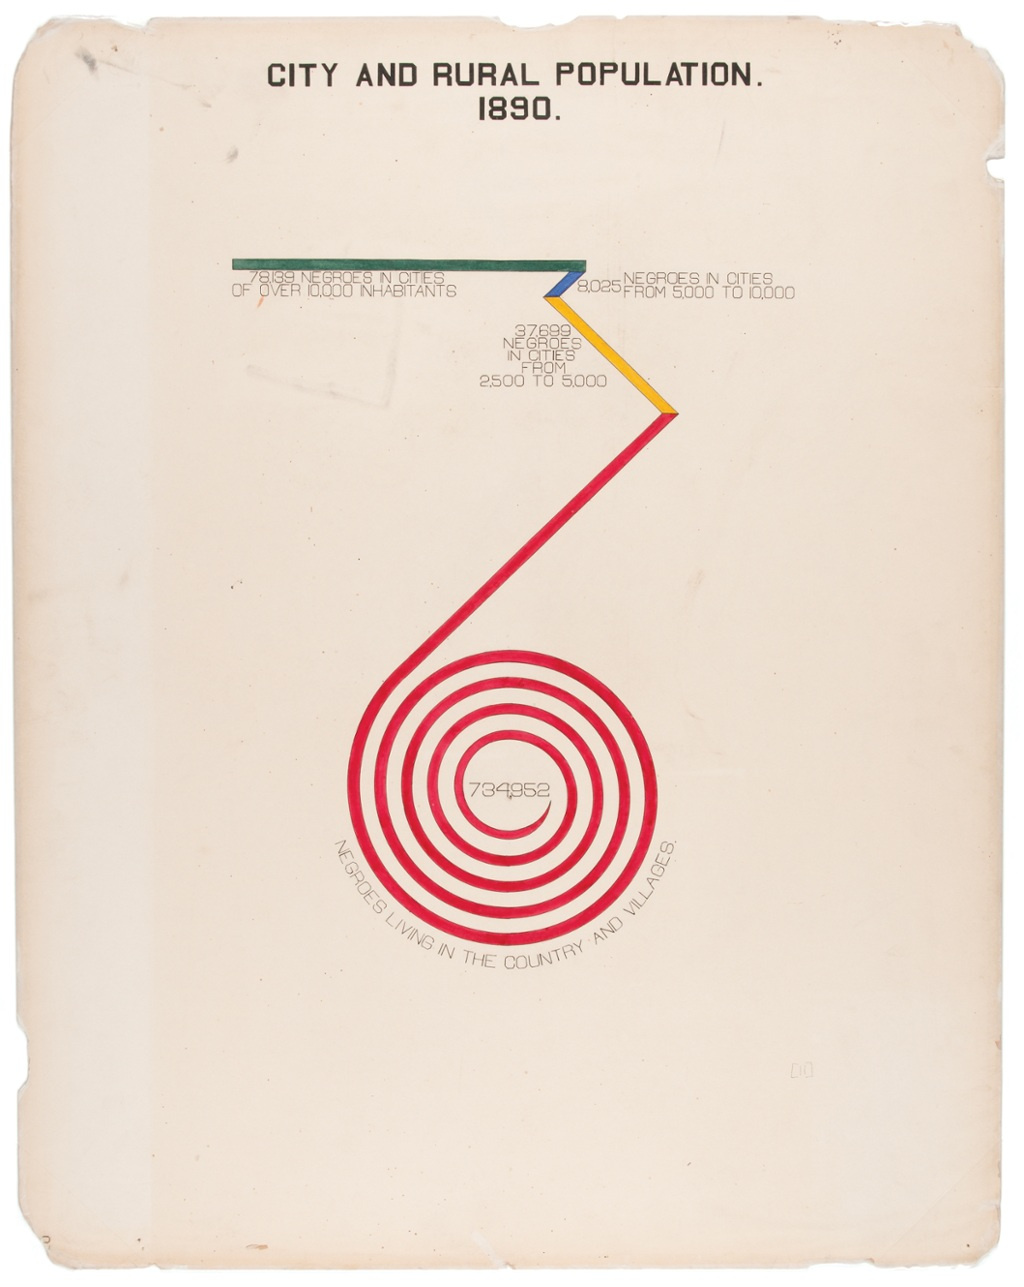
“The colorful charts, graphs, and maps presented at the 1900 Paris Exposition by famed sociologist and black rights activist W. E. B. Du Bois offered a view into the lives of black Americans, conveying a literal and figurative representation of 'the color line'."
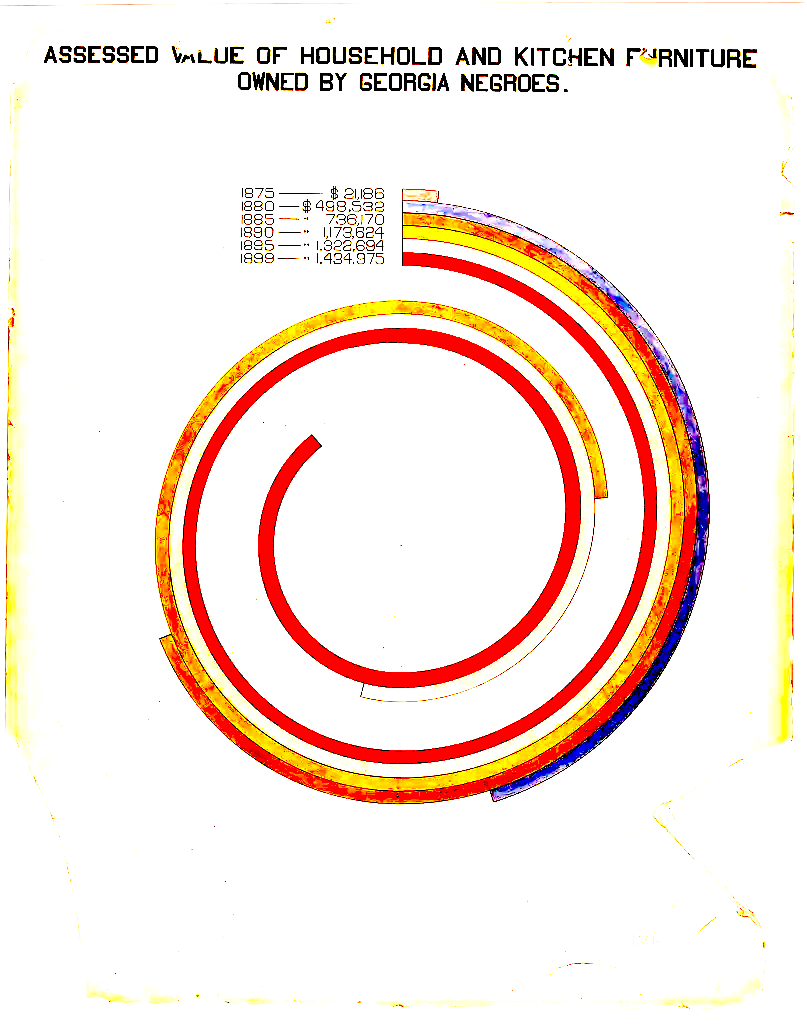
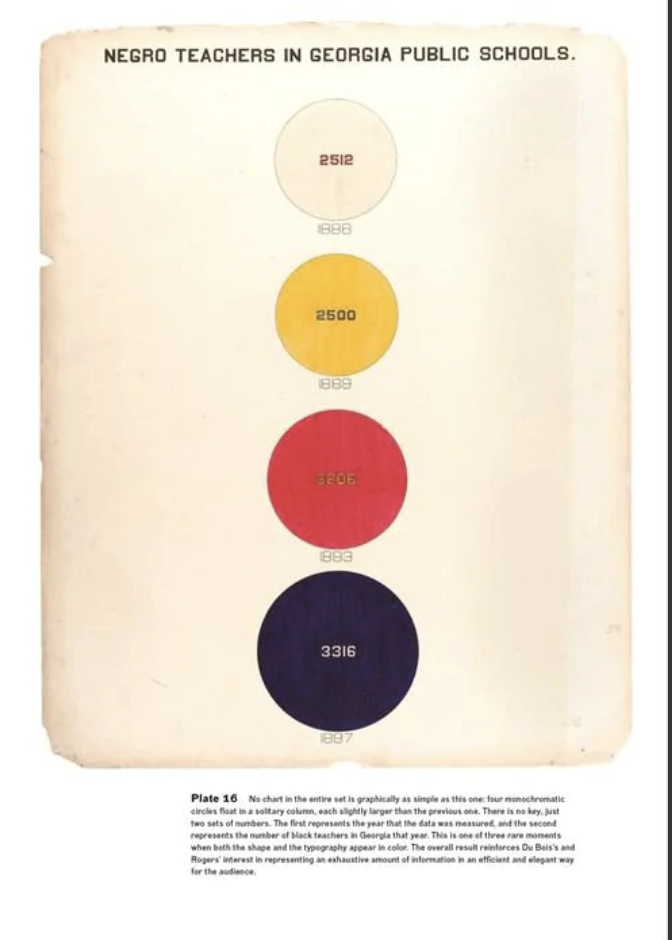
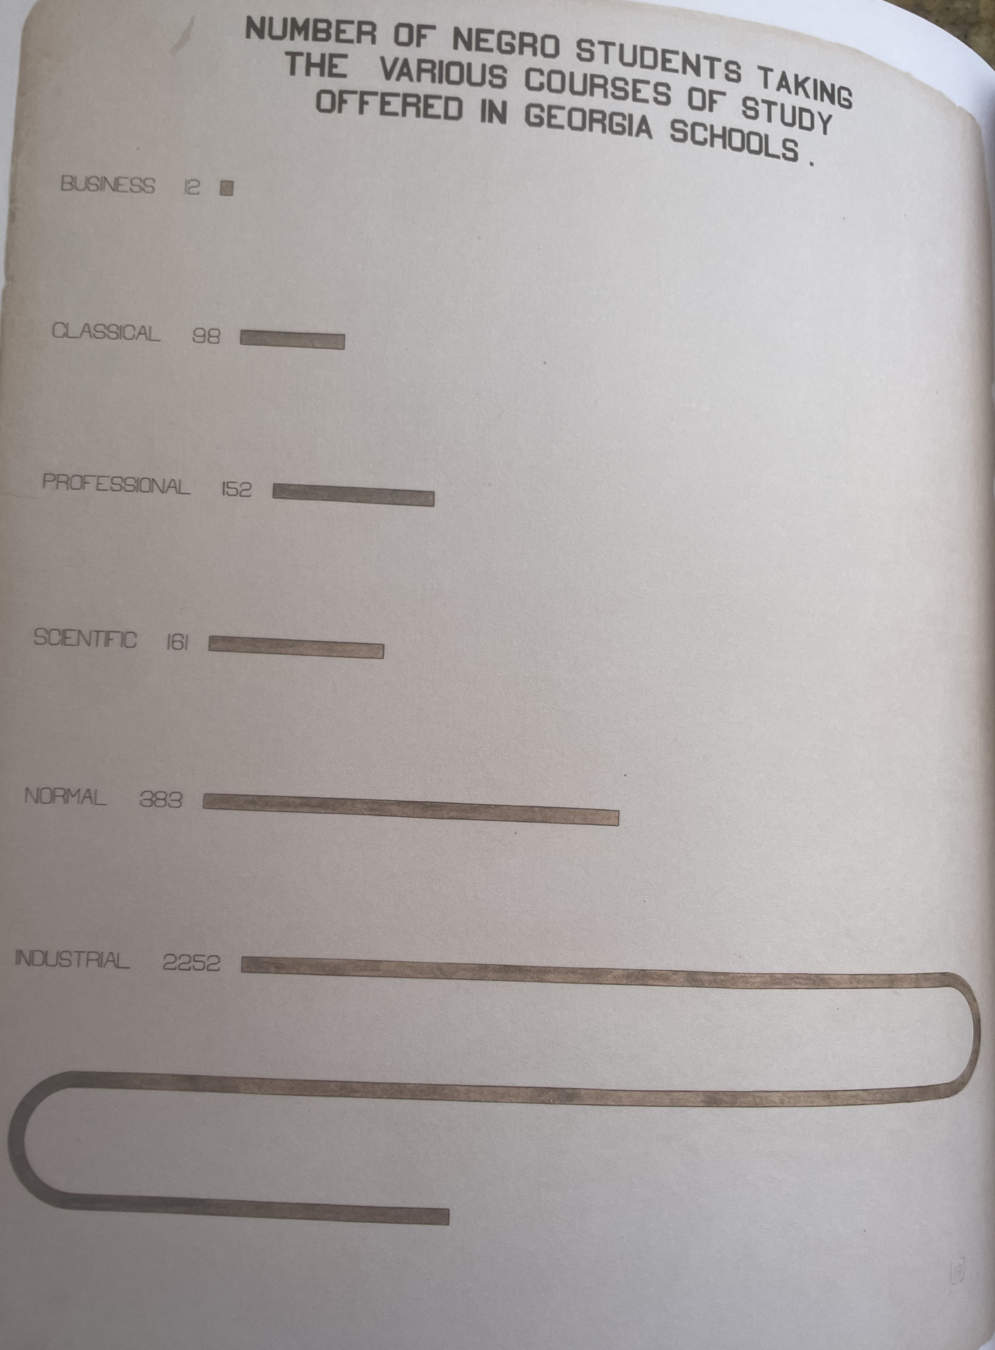
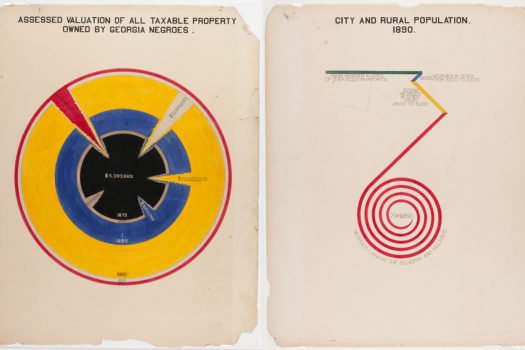
W.E.B. Du Bois 1868-1963, sociologist, black right activist, graphic designer ante litteram
“Du Bois was aware that while unmoving prose and dry presentations of charts and graphs might catch attention from specialists, this approach would not garner notice beyond narrow circles of academics,” Aldon Morris writes in the essay “American Negro at Paris, 1900.” “Such social science was useless to the liberation of oppressed peoples. Breaking from tradition, Du Bois was among the first great American public intellectuals whose reach extended beyond the academy to the masses.”
https://hyperallergic.com/476334/how-w-e-b-du-bois-meticulously-visualized-20th-century-black-america/
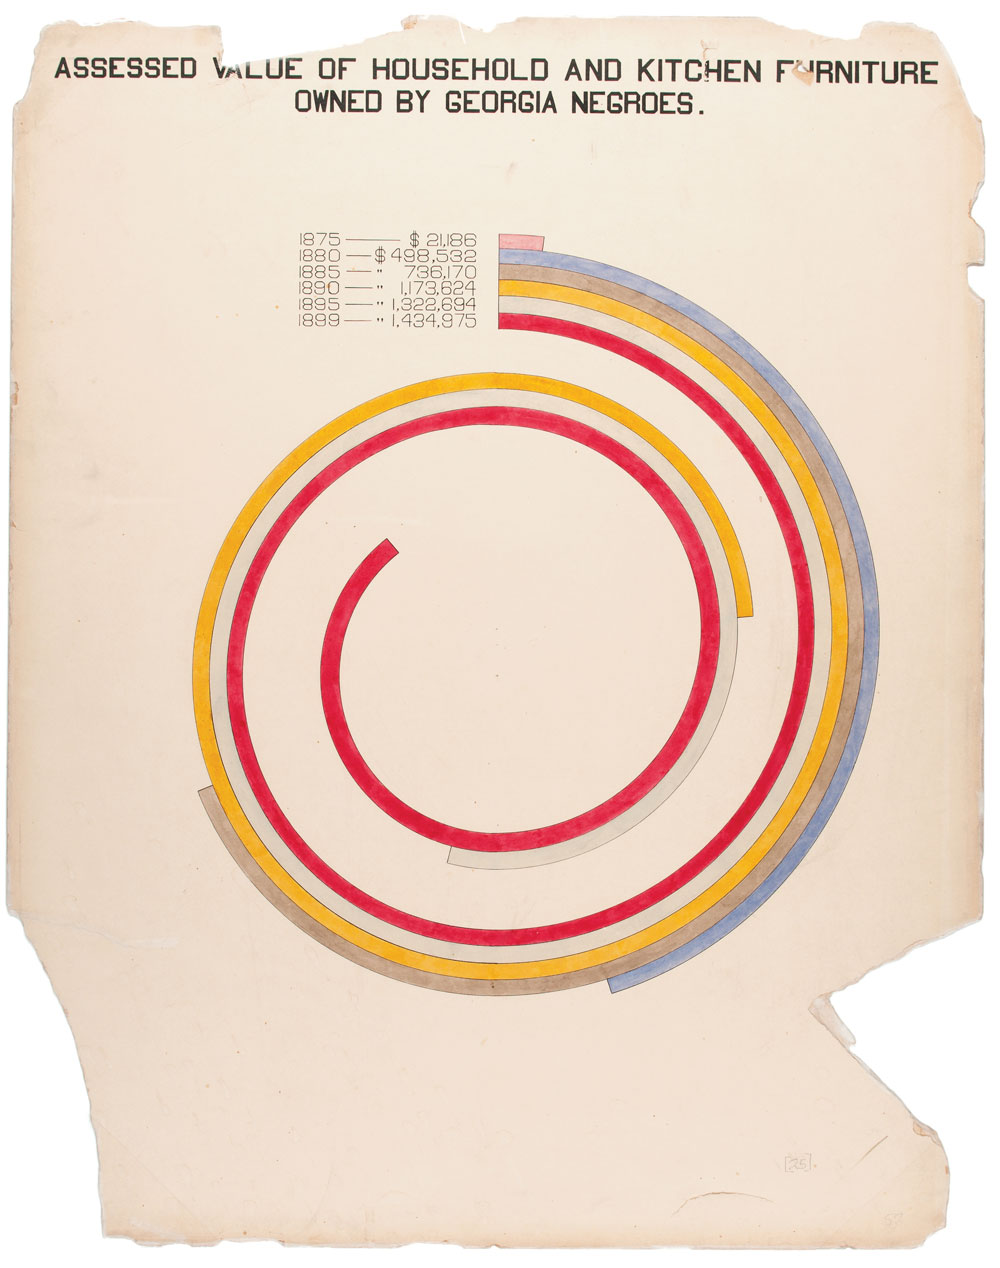
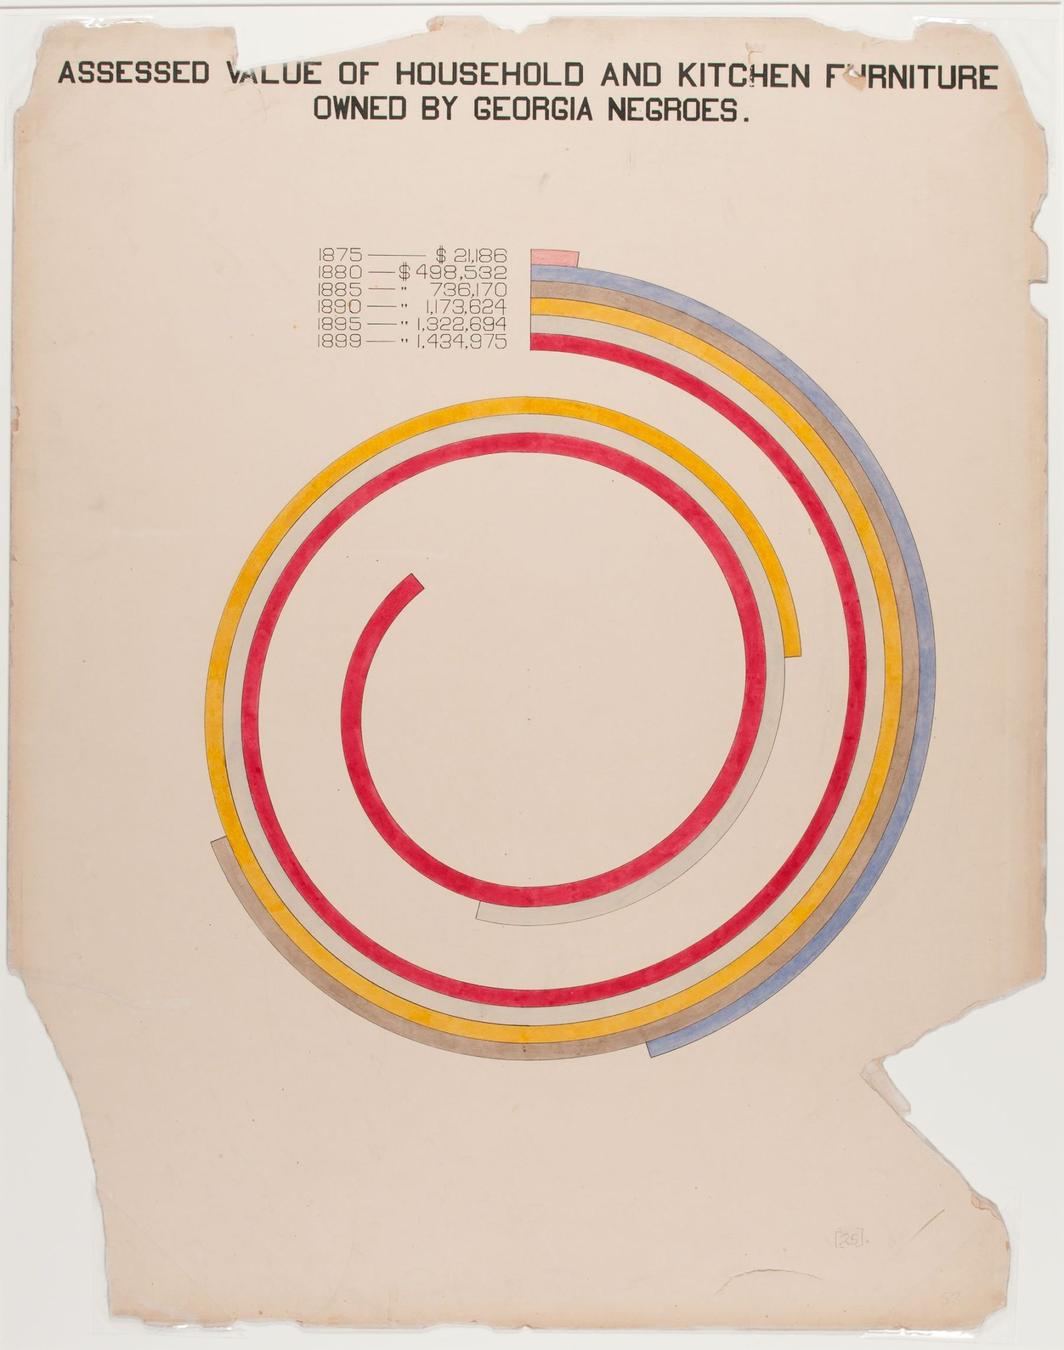
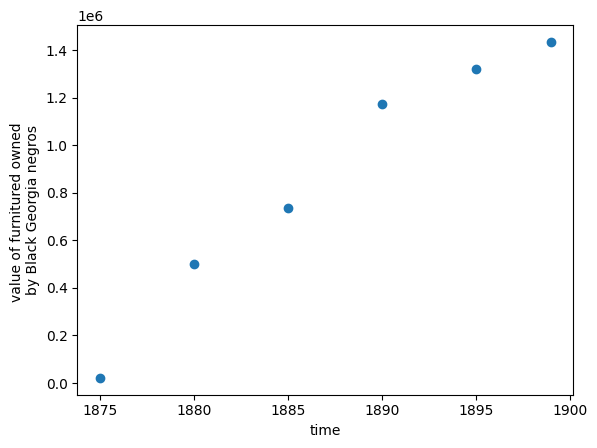
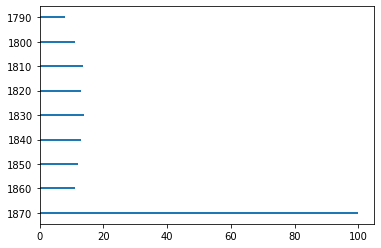
accurate gaphic. but not impactful
accurate gaphic. also not very impactful
"ineffective" use of space?
your visualization should be
- true to the data
- compelling
but compelling may mean different things for different audiences. W.E.B. DuBois was using these graphs for advocacy, not scientific communication.
His plate are mathematically accurate, but emotionally engaging to developed an emotional response (empathy) in the audience.
Reproduciblity: A research product is reproducible if all numbers can be reproduced exactly be applying the same code to the same raw data. It is the responsibility of the researcher to provide the data and code that make a research product reproducible
What is special about time series? Time series are series of exogenous-endogenous variable pairs where the exogenous variable is time, and therefore it is a sequential quantity with a specific direction of evolution.
What is Machine Learning? Machine Learning models are parametrized representations of "reality" where the parameters are learned from finite sets of realizations of that reality. Machine Learning is the discipline that conceptualizes, studies, and applies those models.
Model selection: Choosing a model i.e. a mathematical formula which we expect to be a simplified representation of our observations.
Objective Functions and optimization: To find the best model parameters we define a function of the data and parameters f(data, parameters) to be minimized or maximized.
Model fitting: Determining the best set of parameters to fit the observations within a chosen model.
Intro and Chapter 1; pages 1-8
D. Hogg et al. https://arxiv.org/abs/1008.4686
Lots of details about how to properly treat outliers, uncertainties, assumptions in fitting a line to data. Witty comments make it entertaining. Exercise it make it very helpful
Falisifiability: A theory can be said to be scientific if it makes falsifiable predictions. Experiments should be designed to falsify the predictions
Reproduciblity: A research product is reproducible if all numbers can be reproduced exactly be applying the same code to the same raw data. It is the responsibility of the researcher to provide the data and code that make a research product reproducible
What is special about time series? Time series are series of exogenous-endogenous variable pairs where the exogenous variable is time, and therefore it is a sequential quantity with a specific direction of evolution.
What is Machine Learning? Machine Learning models are parametrized representations of "reality" where the parameters are learned from finite sets of realizations of that reality. Machine Learning is the discipline that conceptualizes, studies, and applies those models.
Model selection: Choosing a model i.e. a mathematical formula which we expect to be a simplified representation of our observations.
Objective Functions and optimization: To find the best model parameters we define a function of the data and parameters f(data, parameters) to be minimized or maximized.
Model fitting: Determining the best set of parameters to fit the observations within a chosen model.
D. Hogg et al. https://arxiv.org/abs/1008.4686 - lots of details about how to properly treat outliers, uncertainties, assumptions in fitting a line to data. Witty comments make it entertaining. Exercise it make it very helpful
AstroML Chapter 10 - Intro
HOMLwSKLKerasTF Chapter 4 pages 111-117
Elements of Statistical Learning Chapter 3 Section 1 and 2
By federica bianco
intro to time series and regression


