


Florian Dambrine
I am a Freelance DevOps Engineer graduated from UTC (University of Technology of Compiègne) in 2014. I am a DevOps enthusiast embracing Cloud computing technologies to build automated infrastructure at large scale.
@DambrineF
Florian Dambrine - Senior DevOps Engineer - @ GumGum
Florian Dambrine
DevOps Engineer @ GumGum
Joined GumGum 5+ years ago
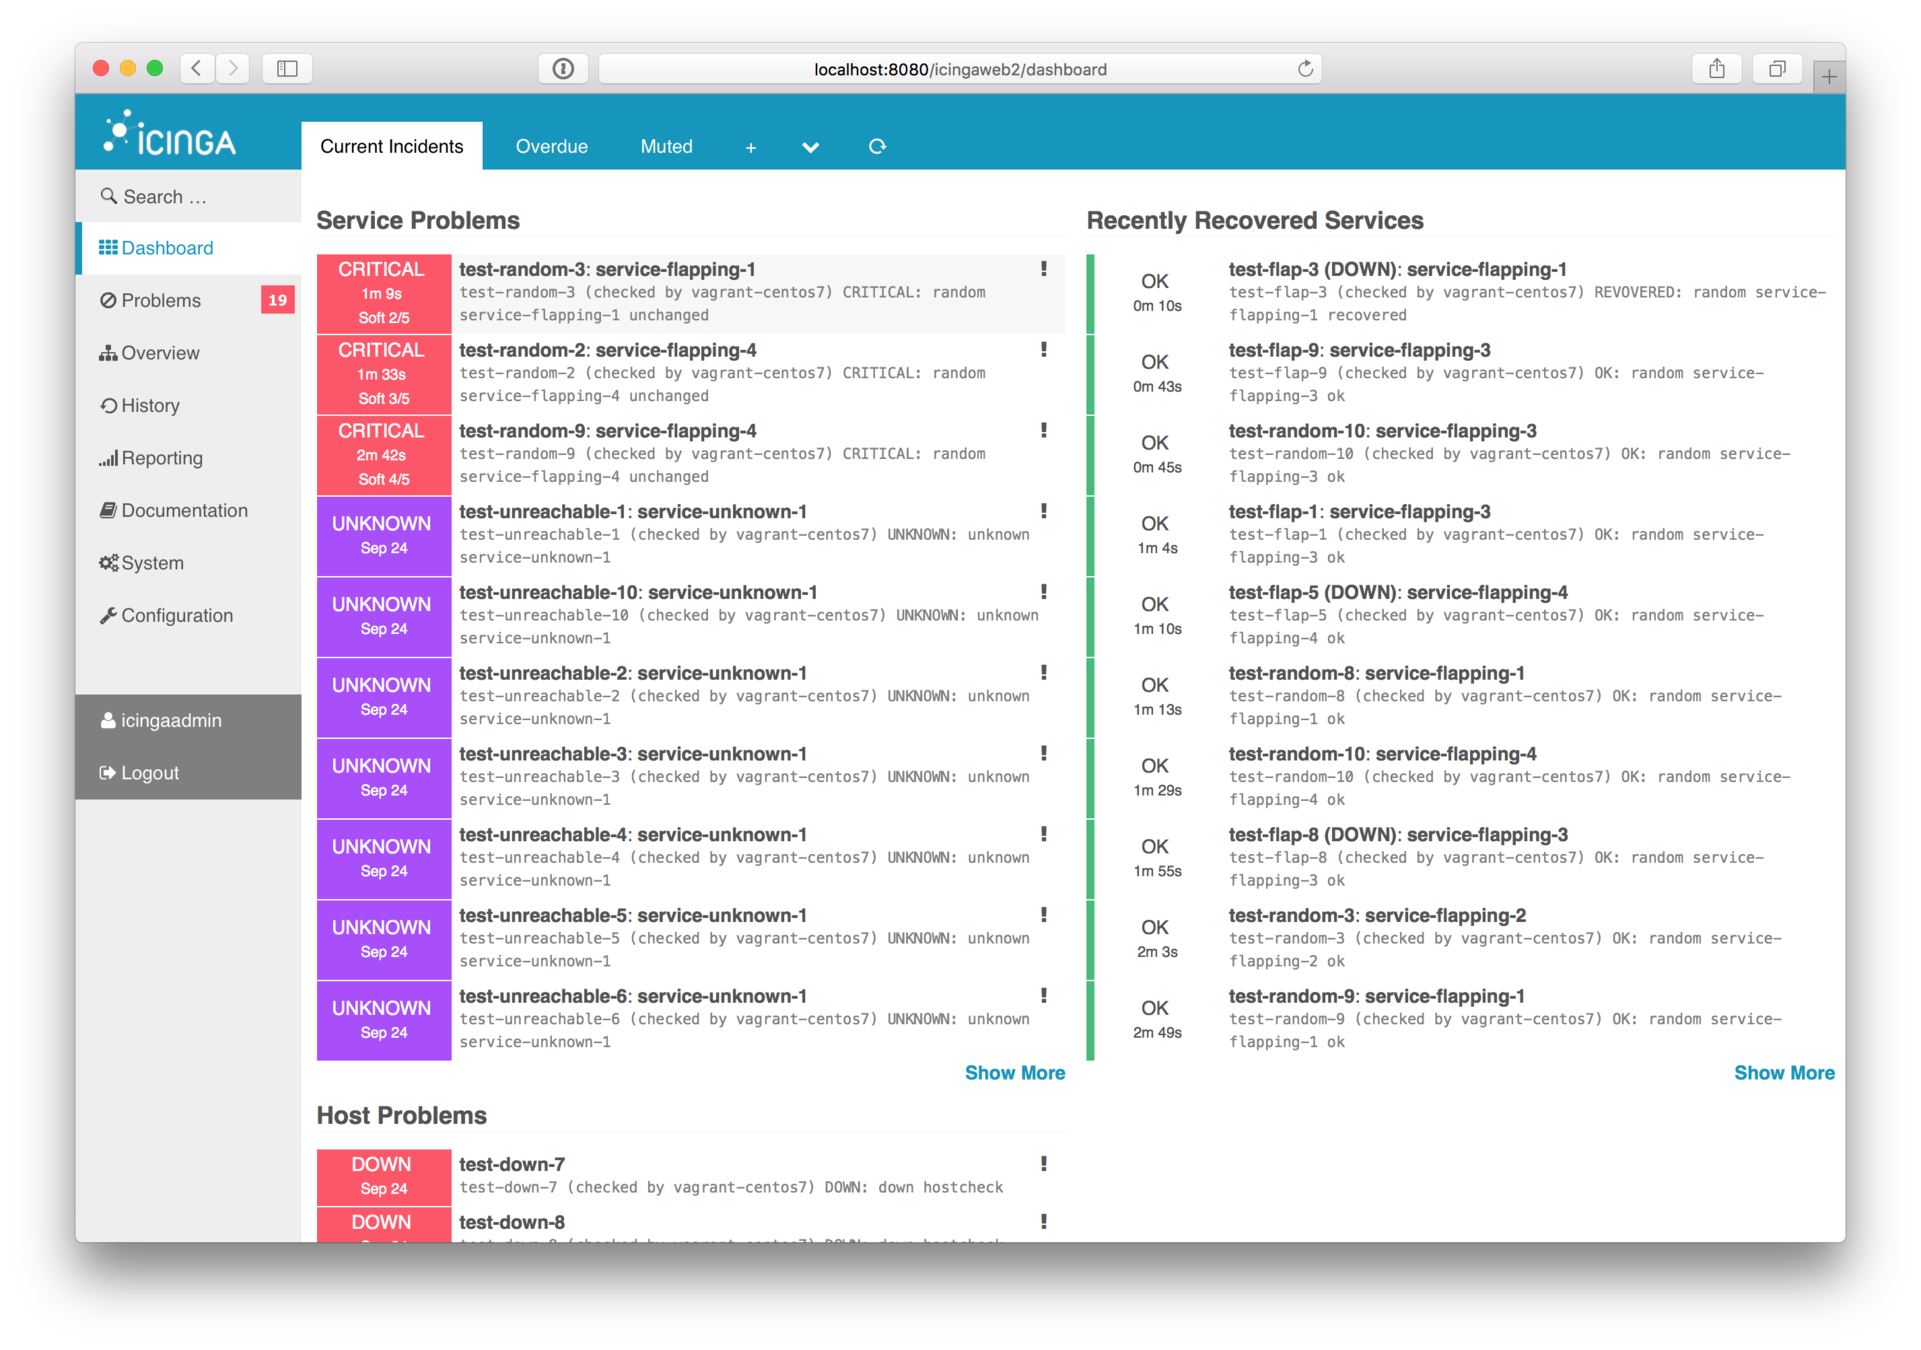
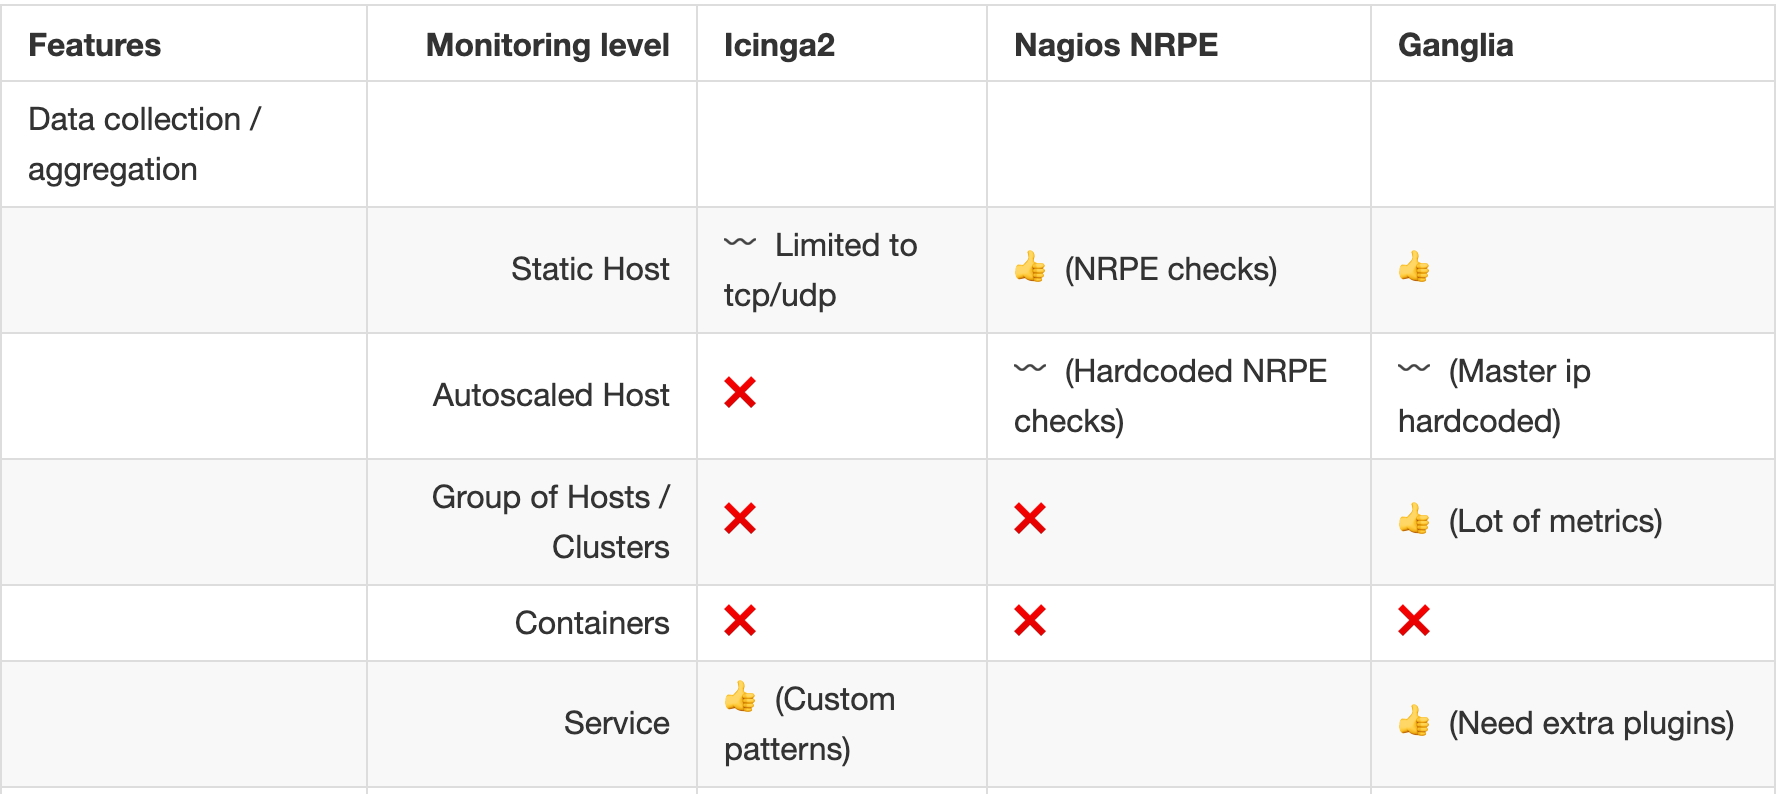
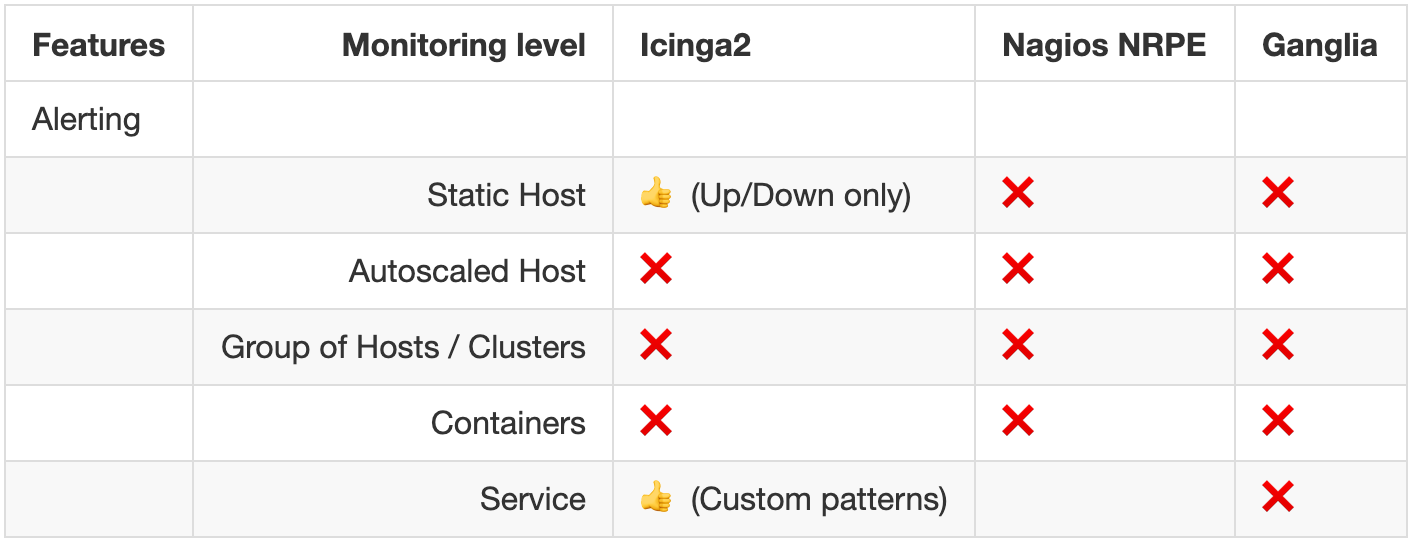
The one who set up a legacy monitoring...
......
# NOTE:
# The following commands might be overriden in conf.d/*.cfg files
#
command[check_users]=/usr/lib/nagios/plugins/check_users -w 5 -c 10
command[check_root_disk]=/usr/lib/nagios/plugins/check_disk -w 20% -c 10% -p /
command[check_mnt_disk]=/usr/lib/nagios/plugins/check_disk -w 20% -c 10% -R '^/mnt'
command[check_zombie_procs]=/usr/lib/nagios/plugins/check_procs -w 5 -c 10 -s Z

# Defines total_procs and load values based on the instance type:
#---- Load ----|------------- Tot. Procs ------------
# Crit    Warn | Crit  Warn
#   +2   1 + 4 |  +20   150 = 30 *  1 + 120 =  1 core
#   +2   2 + 4 |  +20   150 = 30 *  2 + 90  =  2 cores
#   +2   4 + 4 |  +20   210 = 30 *  4 + 90  =  4 cores
#   +2   8 + 4 |  +20   240 = 30 *  8       =  8 cores
#   +2  16 + 4 |  +20   480 = 30 * 16       = 16 cores
#   +2  32 + 4 |  +20   960 = 30 * 32       = 32 cores
#   +2  36 + 4 |  +20  1080 = 30 * 36       = 32 cores

# 2 cores instance
command[check_total_procs]=/usr/lib/nagios/plugins/check_procs -w 300 -c 400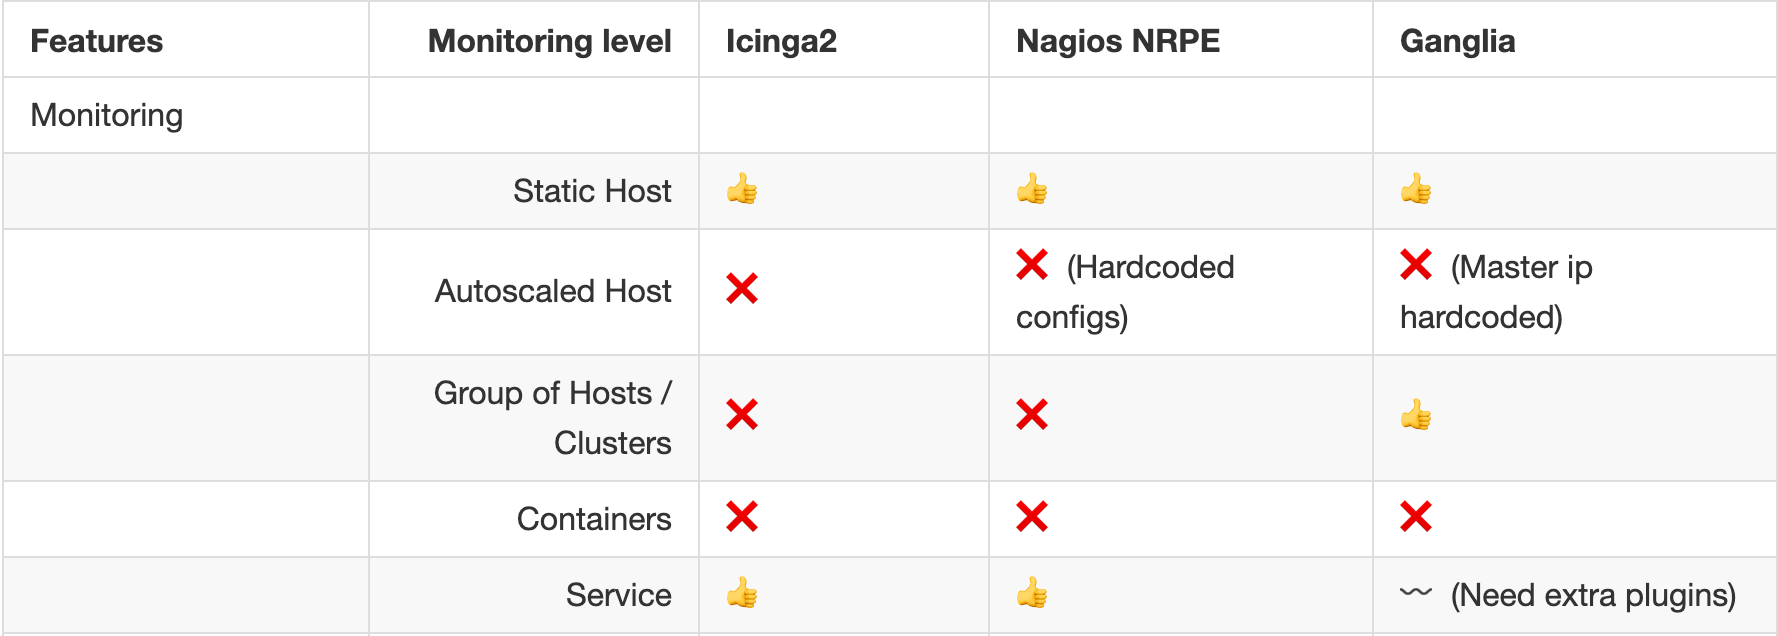
command[check_load]=/usr/lib/nagios/plugins/check_load -w 10,8,6 -c 14,12,10Icinga 2
Nagios
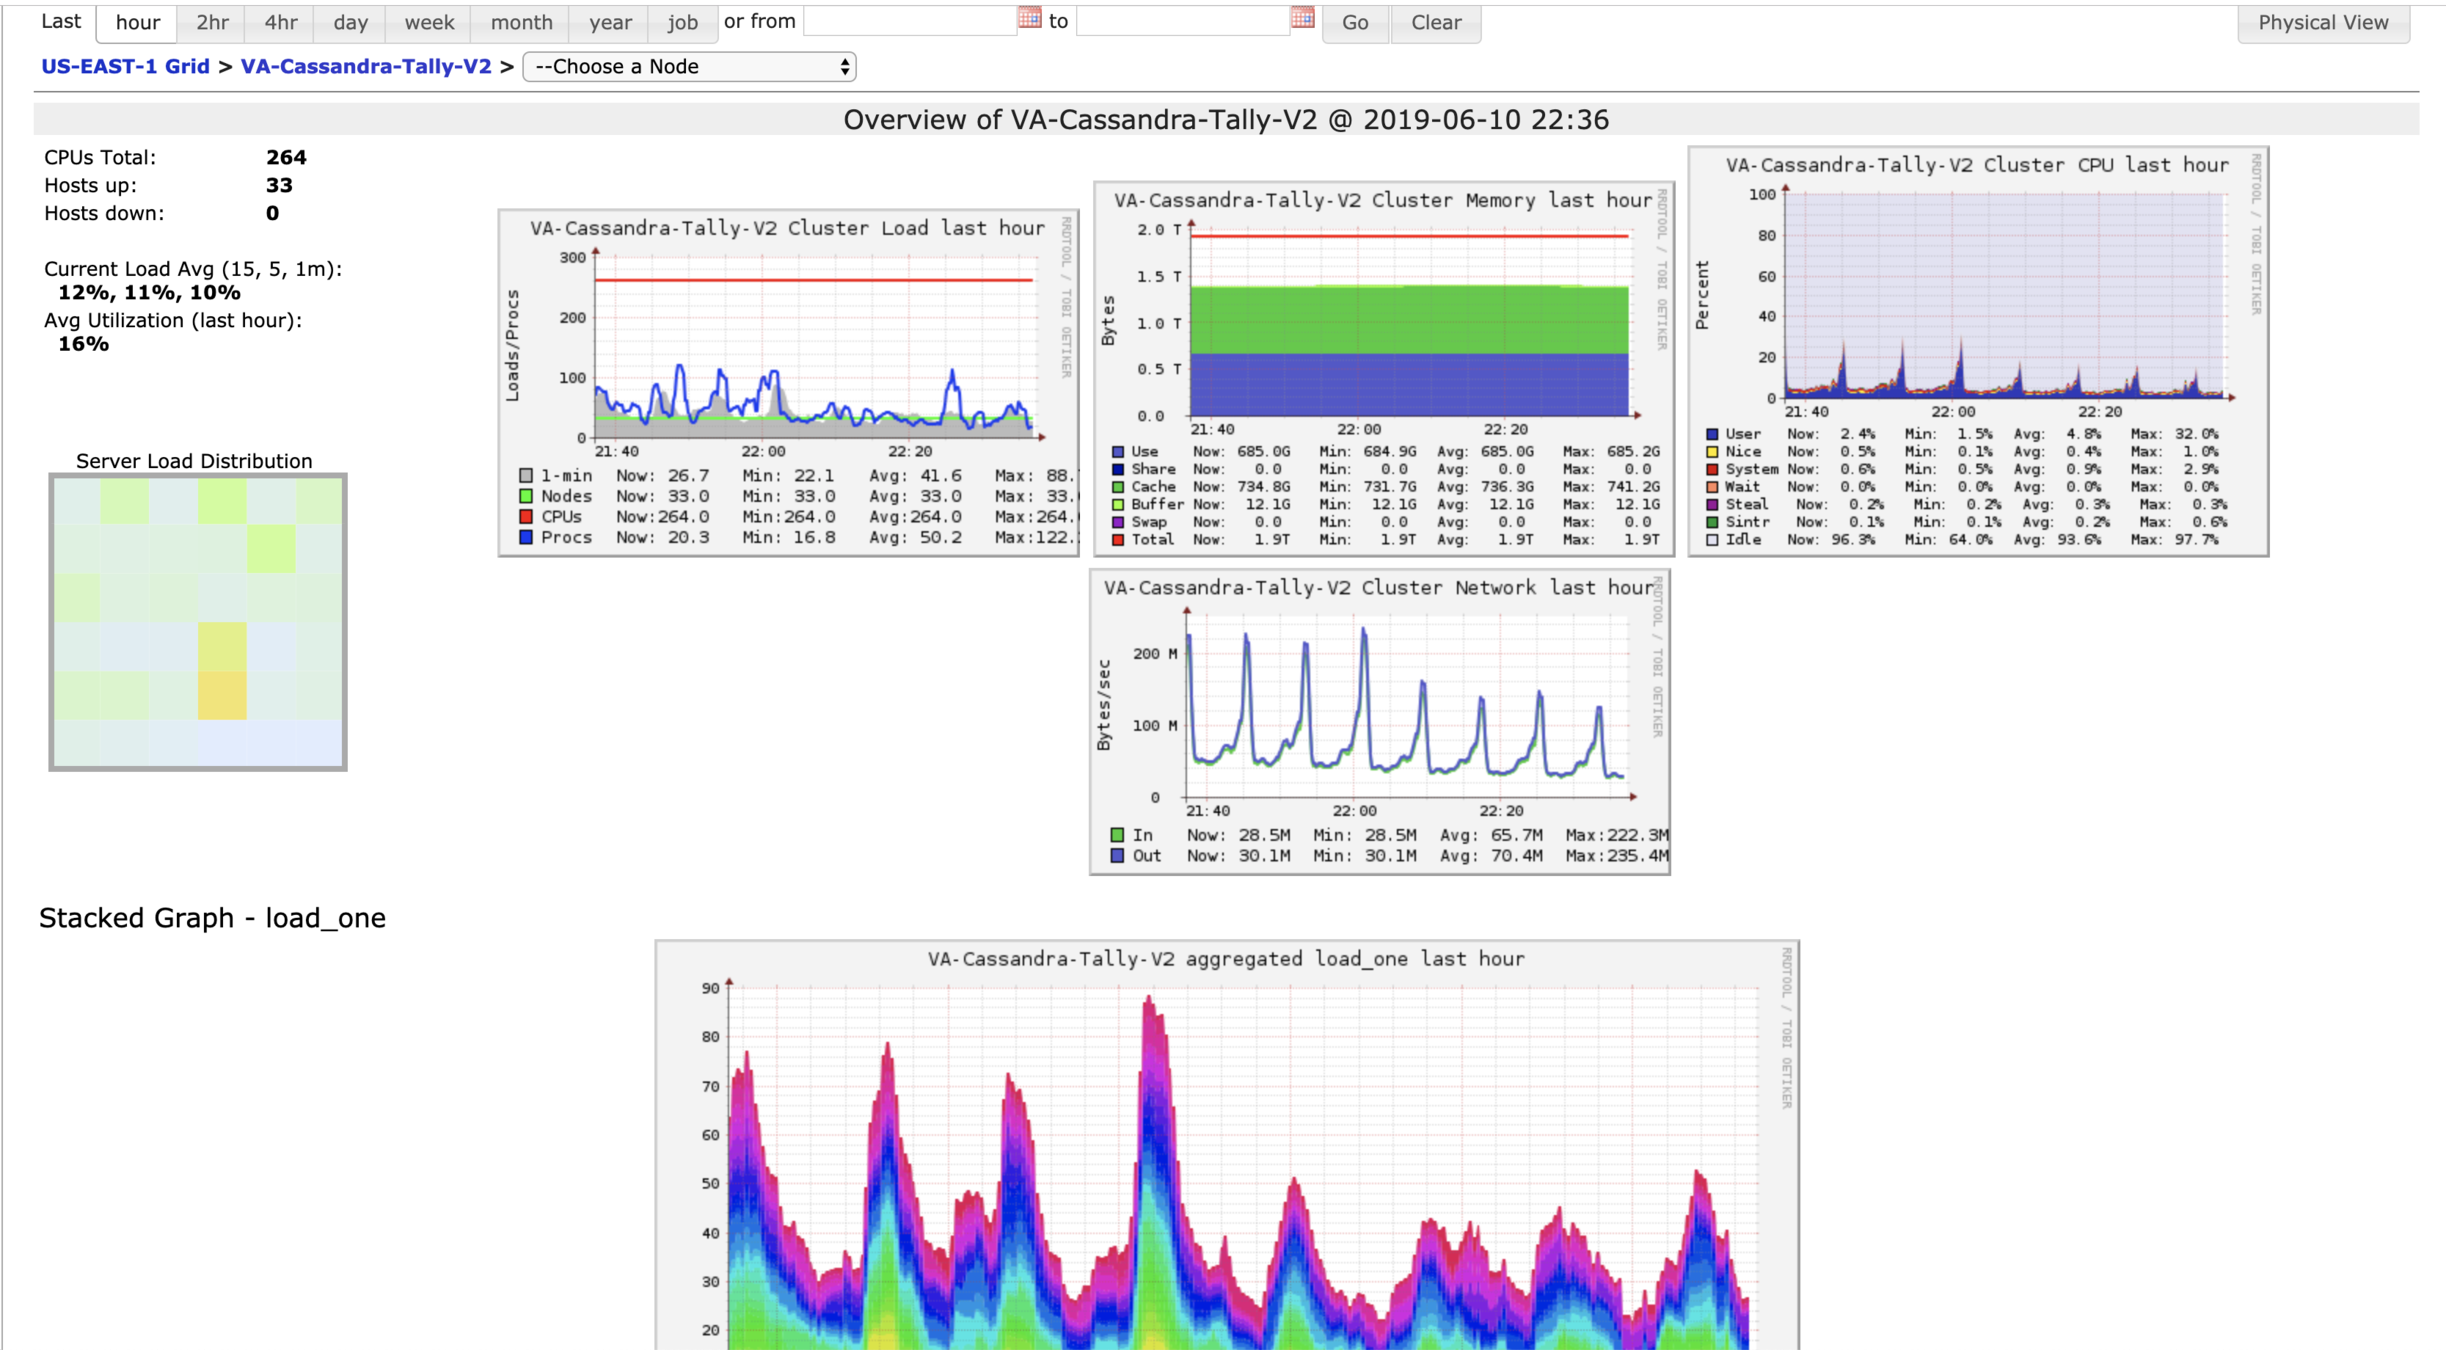
Ganglia
External Services / APIs
Containers
Static Hosts
Autoscaled Hosts
Clusters / Group of hosts
### Global configs
global:
scrape_interval: 15s # Set the scrape interval to every 15 seconds. Default is every 1 minute.
evaluation_interval: 15s # Evaluate rules every 15 seconds. The default is every 1 minute.
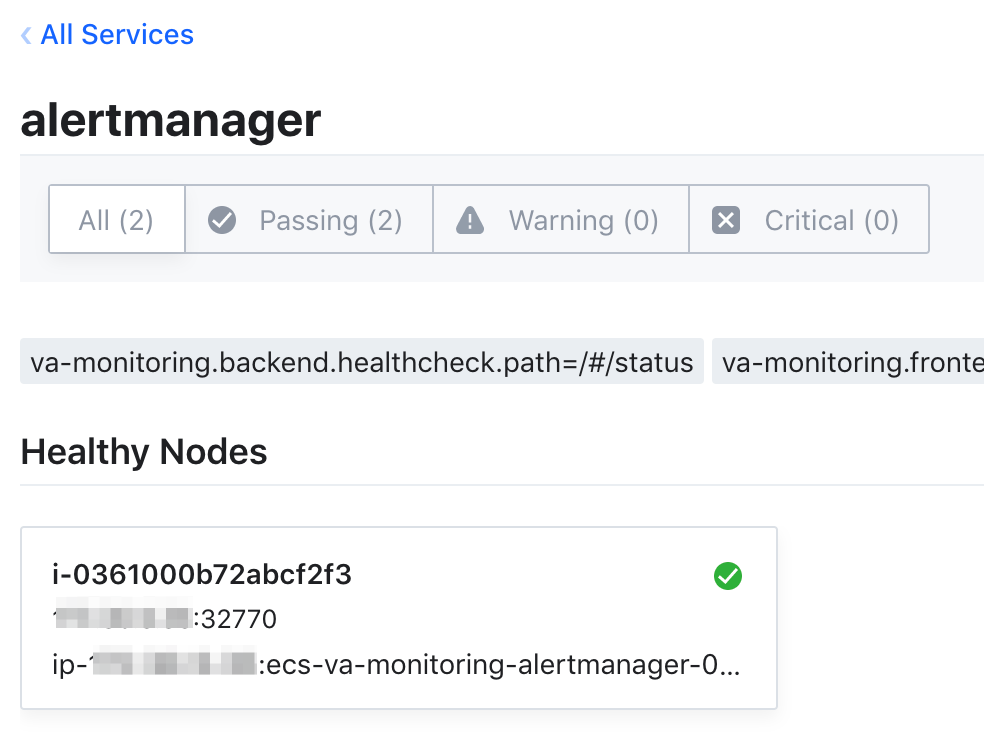
### Alertmanager configuration
alerting:
alertmanagers:
- scheme: http
consul_sd_configs:
- server: 169.254.1.1:8500
datacenter: us-east-1
services: [ 'alertmanager' ]
rule_files:
- 'rules/*'
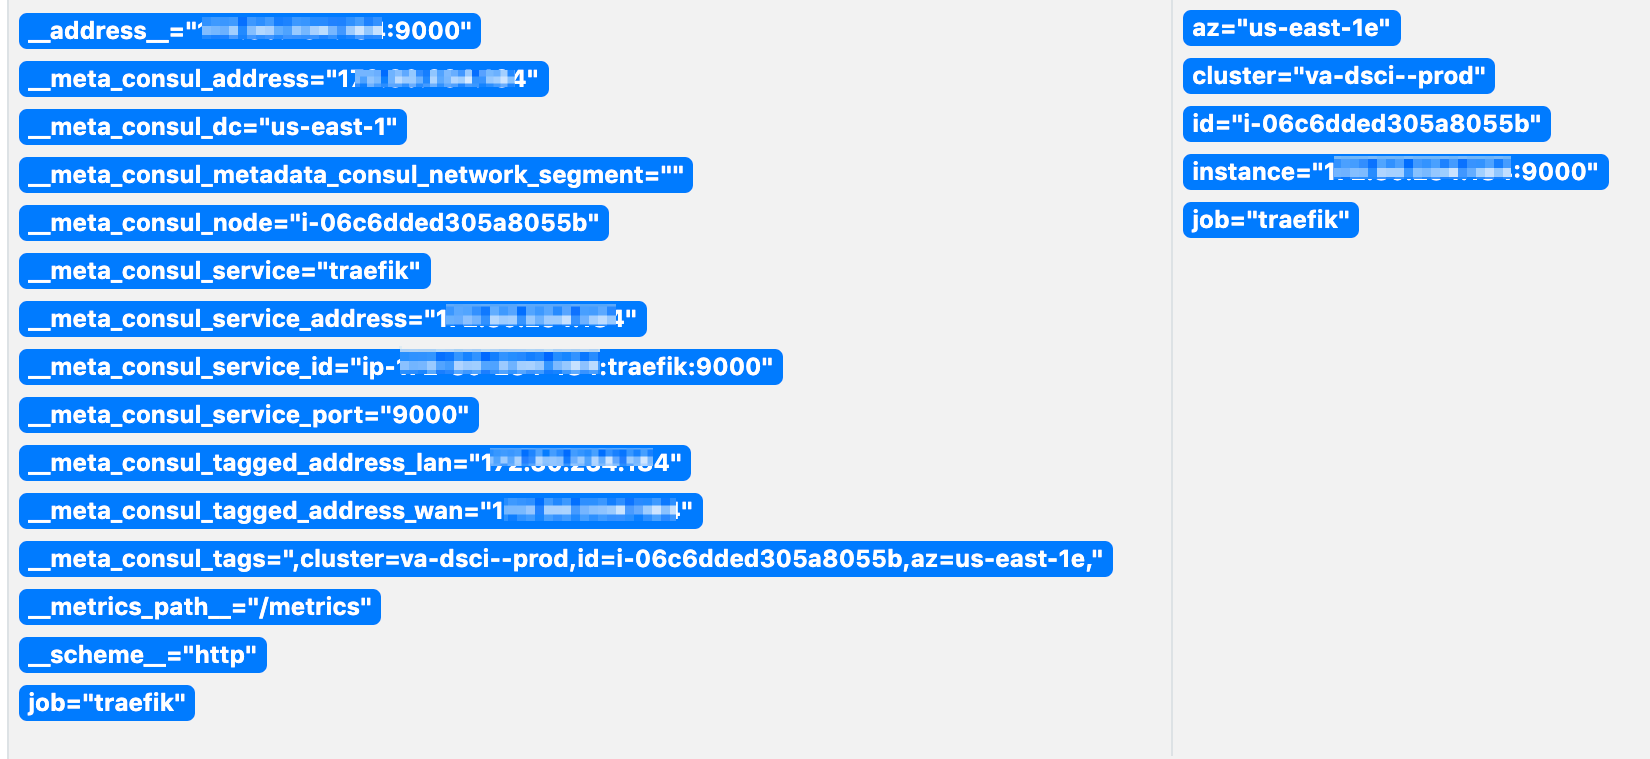
### Target Scrape Configs
scrape_configs:
# The job name is added as a label `job=<job_name>` to any timeseries scraped from this config.
- job_name: prometheus
consul_sd_configs:
- server: 169.254.1.1:8500
datacenter: us-east-1
services: [ 'prometheus' ]
relabel_configs:
- source_labels: [ __meta_consul_tags ]
regex: ',(?:[^,]+,){0}([^=]+)=([^,]+),.*'
replacement: '${2}'
target_label: '${1}'
- ...
- ...$ vim prometheus.yml
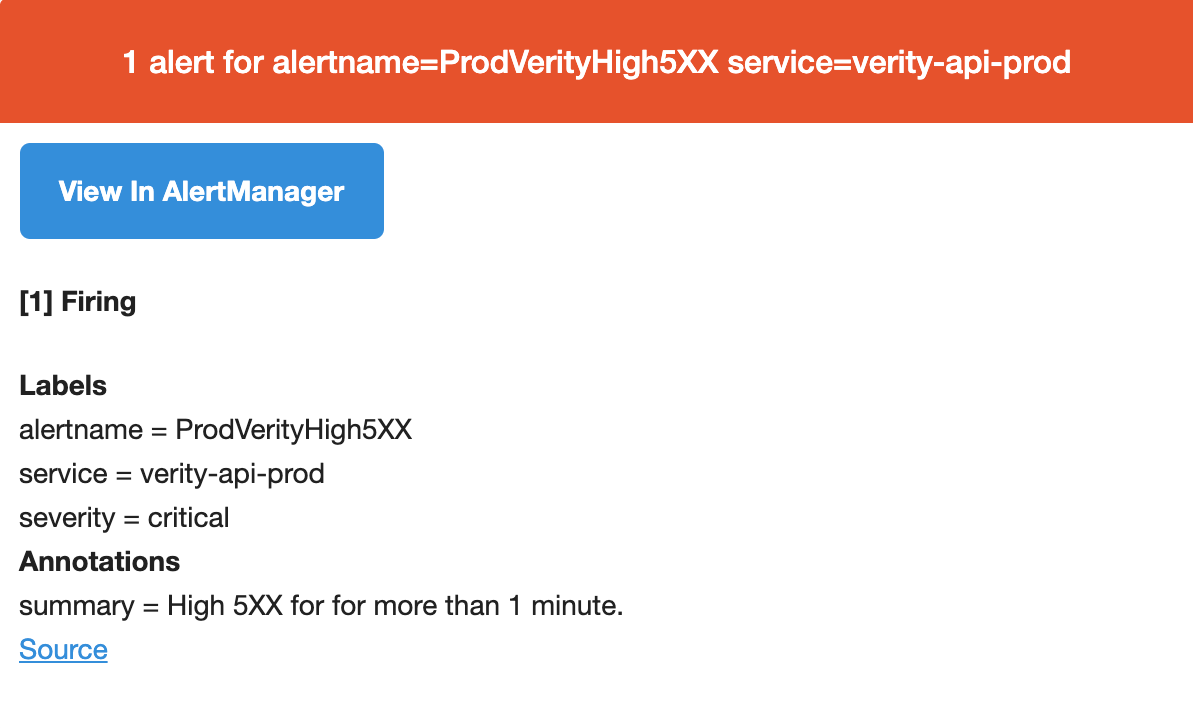
groups:
  - name: verity
    rules:
    - alert: ProdVerityHigh5XX
      expr: sum(
        increase(
            traefik_backend_requests_total{cluster="va-verity-ecs--prod",
                                           backend=~"backend-verity-api__.*",
                                           code=~"5.*"}[1m]))
        > 20
      for: 1m
      labels:
        severity: critical
        service: verity-api-prod
      annotations:
        summary: "High 5XX for {{ $labels.service }} for more than 1 minute."
$ vim rules/app.yml
Alertmanager
# The root route on which
# each incoming alert enters.
route:
  group_by: ['alertname', 'service', 'backend']
  # Wait before sending first alert.
  group_wait: 30s
  # When first alert sent, wait to send a batch
  # (FOR DIFFERENT ALERT BUT SAME GROUP)
  group_interval: 15m
  # If alert sent, wait before resending
  repeat_interval: 30m

  # Child route trees.
  - match:
      service: verity
      receiver: verity
receivers:
- name: 'ops'
# SLACK INTEGRATION
slack_configs:
- send_resolved: true
api_url: https://hooks.slack.com/services/...
chanel: '@CHANEL_NAME'
# PAGER DUTY INTEGRATION
# (Escalation policy service key):
pagerduty_configs:
- send_resolved: true
service_key: ...
- name: 'verity'
# EMAIL INTEGRATION
email_configs:
- send_resolved: true
to: ops@gumgum.com
from: noreply@gumgum.cominhibit_rules:
- source_match:
severity: 'critical'
target_match:
severity: 'warning'
# Apply inhibition if...
equal: ['alertname',
'service',
'backend']
$ vim alertmanager.yml
$ wget \
-qO wlad-0003.pdf \
https://bit.ly/2wP3GeZ \
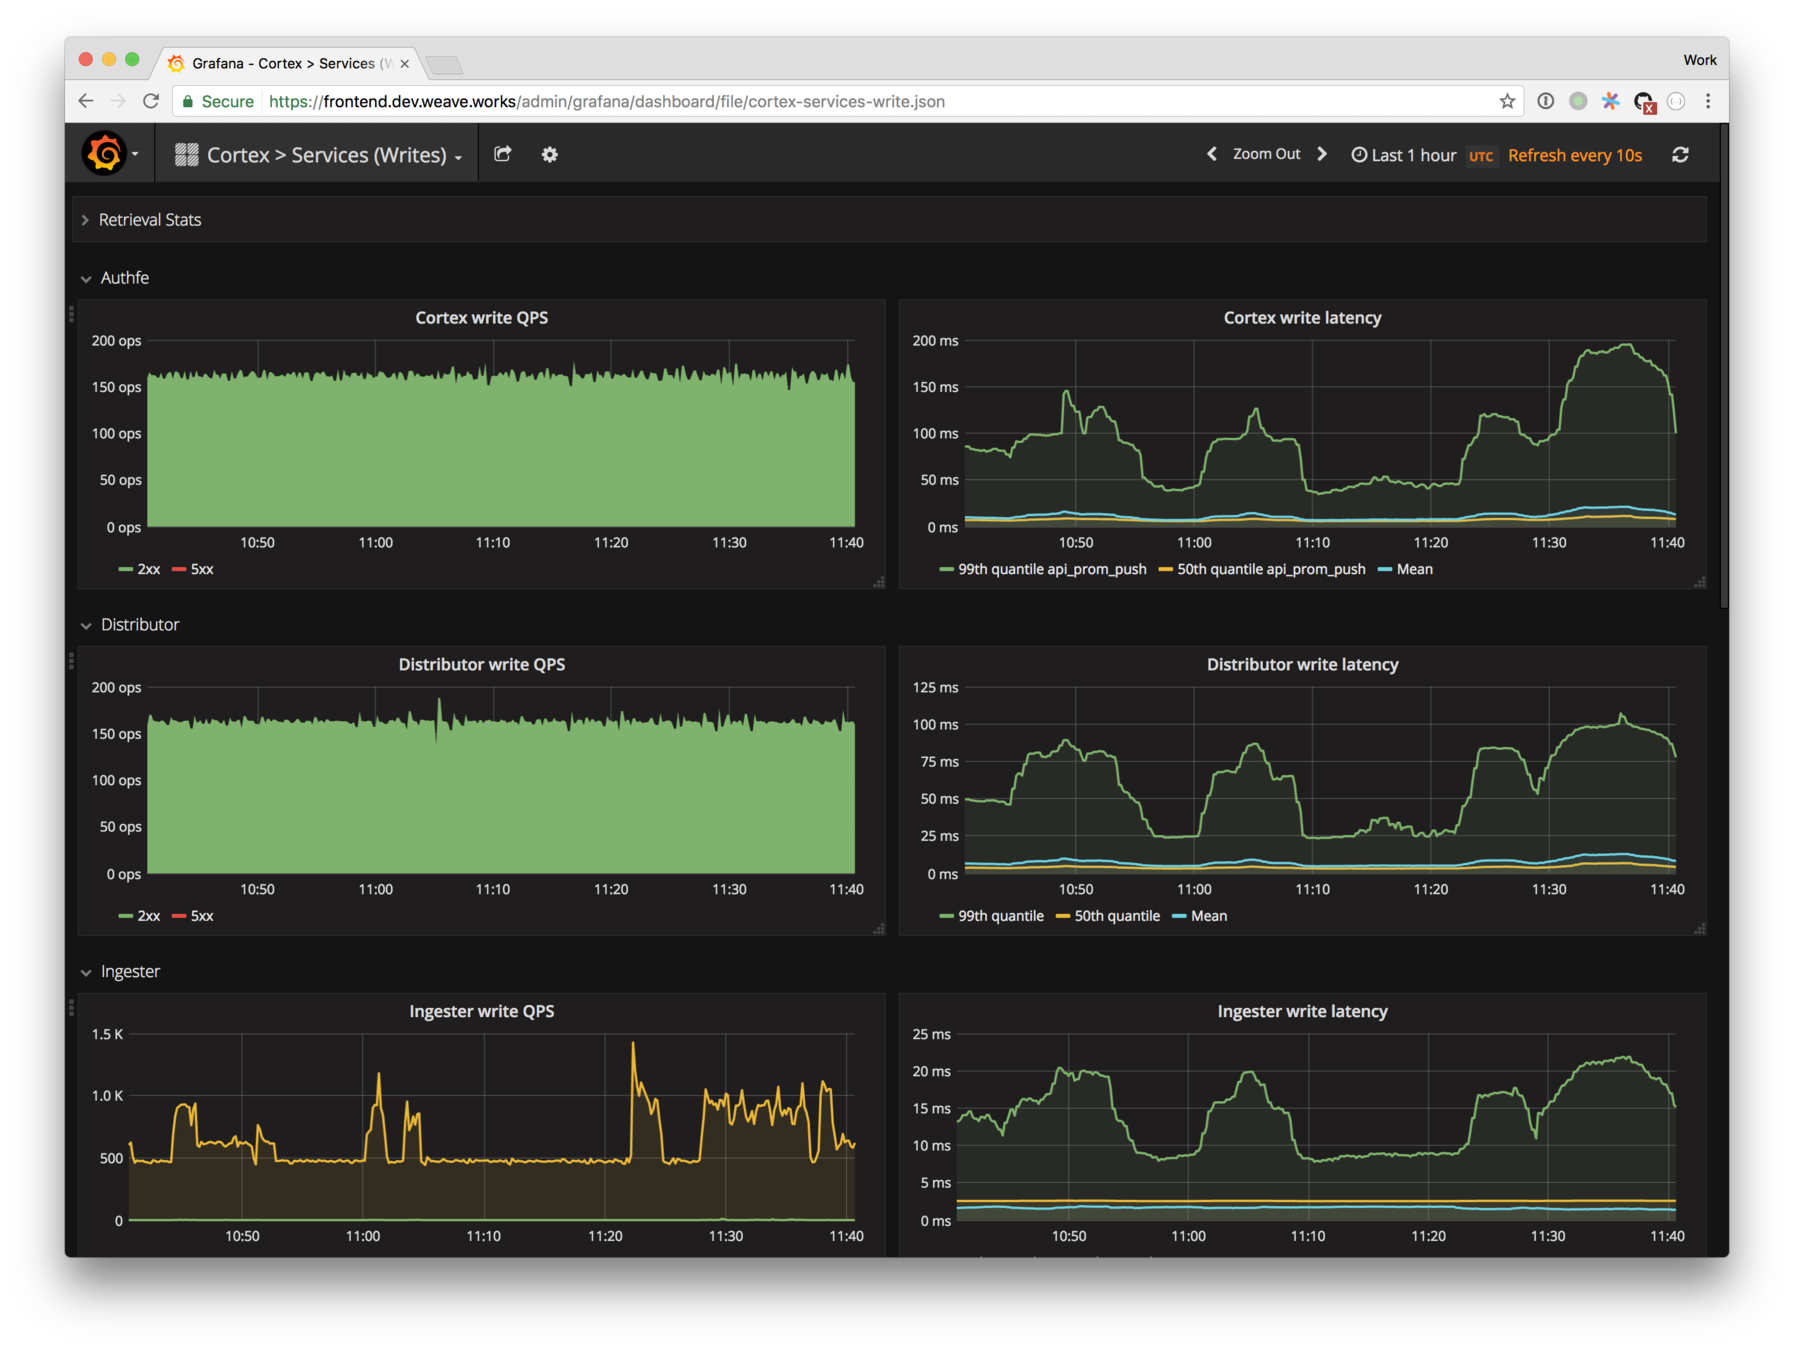
&& open wlad-0003.pdfPssssst: It's about USE & RED method to build relevant Grafana Dashboards
USE: Utilization Saturation and Errors RED: Rate Errors and Duration
By Florian Dambrine
Learn how we ditched our legacy monitoring systems at @GumGum and how we transitioned to a modern / flexible monitoring solution based on Prometheus eco-system. We will spend time going over today's monitoring challenges and see how a Prometheus / Consul / Grafana eco-system can help you monitor a modern stack.


