Collecting and Visualizing COVID-19 Case Count Data from Multiple Open Sources
Ryan Hafen
- EIOS is a collaboration between various public health stakeholders around the globe, led by WHO
- Mission is early detection, verification and assessment of public health risks and threats using open source information
- Aimed at consolidating a wide array of endeavors and platforms to build a strong public health intelligence (PHI) community supported by robust, harmonized and standardized PHI systems and frameworks across organizations and jurisdictions
Epidemic Intelligence from Open Sources (EIOS)
COVID-19 Case Counts
- Confirmed cases and deaths at different levels of geographic resolution, as provided by health departments, ministries of health, etc.
- EIOS aims to provide analysts with the ability to:
- Quickly understand trajectories of counts and related statistics at different levels of geography
- Observe discrepancies between different data sources
- Case count considerations
- Methods for counting vary by health care system
- Level of testing varies geographically and over time
Case Count Sources
- Global (country-level)
- United States (state and county-level)
Challenges of Data Standards in Open Data Communities
- Often not much thought is given to standards
- When it is, everyone has a different idea of "standard"
- Often little incentive to adhere to someone else's standard
It's hard to expect strict adherence to a standard for a given type of data, but ideally we would all adhere to some best practices
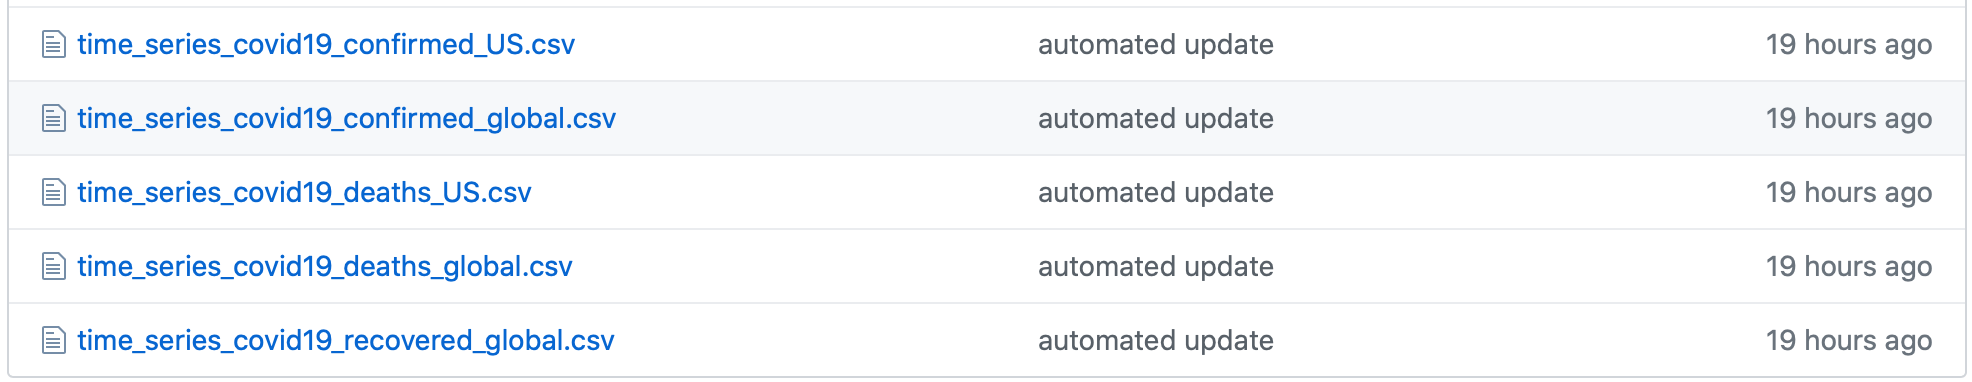
Example of Bearable Practices - JHU

Example of Bearable Practices
1. Wide format
Prefer tidy format
- Each variable is a column
- Each observation (or case) is a row
Why not wide format?
- Not suitable for analysis
- Not ideal for version control (every line changes every time, can't tell what changed, bloat)
Example of Bearable Practices
2. Non-standard date format
Use ISO 8601

Example of Bearable Practices
3. Using country names as geographic identifiers
Make it difficult to merge with other data
More prone to error (even when using provided lookup table - things can change)
Should use a country code standard such as ISO 3166-1 alpha-2
Example of Bearable Practices
4. Mix of country and state/province data
Australia, Canada, and China are broken into provinces while everything else is country-level
- Should be consistent and well-documented
- Different files for different geographic levels
Example of Bearable Practices
5. Three files for three variables (cases, deaths, recovered)
These need to be joined to get an analysis dataset
All variables would ideally be in one file, one column per variable - back to tidy data principles
Example of Bearable Practices
6. Ambiguous terms of use and no standard open license
- Non-standard and too-restrictive terms can impede the progress of science
- Ideally for open data should use a standard license such as Creative Commons International 4.0 license

Example of Bearable Practices - JHU
- Wide format - not tidy
- Ambiguous / difficult to parse date format
- Country names used for geographic identifiers
- Mix of country and state data
- Different file for each variable
Example of Bearable Practices
Ambiguous terms of use and no standard open license
- Non-standard and too-restrictive terms can impede the progress of science
- Ideally for open data should use a standard license such as Creative Commons International 4.0 license
Example of Best Practices - New York Times

- Tidy format
- ISO 8601 date format
- Standard geocodes for admin 1 and 2 data (FIPS)
- State and county-level data are in separate files
- License is co-extensive with the Creative Commons Attribution-NonCommercial 4.0 International license
Building a Tool for Case Count Data
- Pull country-level case counts every 5 minutes from the following sources
- WHO
- JHU
- ECDC
- Worldometer
- Roll up counts to WHO Region, continent, and global levels
- Compute statistics of interest for each geographic entity
- Day-to-day and week-to-week change in new cases / deaths
- Case fatality rate (# deaths / # of cases)*
- Attack rate (# cases / population)
- Etc.
*Does not take time to onset of death into account
Provide a set of visualizations for each geographic entity for the user to interact with


With Trelliscope these can be navigated interactively

COVID-19 Data Registry
Efforts exist for pulling multiple sources of COVID-19 data together, e.g.
We are working toward a set of data registry tools that enable the open data community to register datasets in a way that conforms to standards but doesn't require the original data provider to change the way they are publishing their data

Potential Future Work
- Standard schemas and transformers for new data types
- Mobility data
- Administrative statistics (capacity, vulnerability, demographics, etc.)
- Models (IHME, Imperial College, Amherst, etc.)
- Augmenting interfaces to incorporate this information in insightful ways
Thank You
rhafen@gmail.com
Collecting and Visualizing COVID-19 Case Count Data from Multiple Open Sources
By Ryan Hafen


