OpenLayers
vs
Leaflet


What are Openlayers & Leaflet?
- Open source Javascript libraries used to build web mapping applications
- Supports most mobile and desktop platforms, supporting HTML5 and CSS3
- 2-clause FreeBSD license


Map data
Map server
JS library
Browser
- Released in June 2006 by MetaCarta Labs
- Latest stable release 3.10.1 (October 9, 2015)
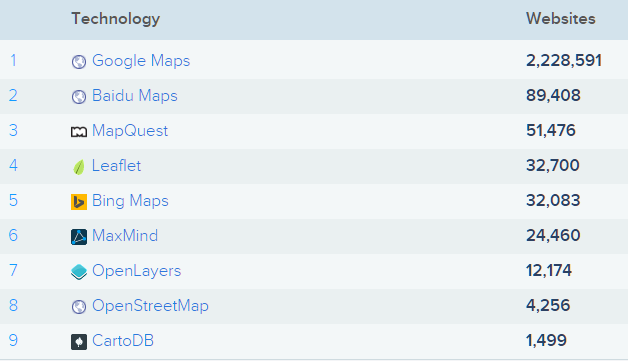
- Used by ~12,000 websites around the world*
- Released in May 2011 by Vladimir Agafonkin
- Latest stable release 0.7.7 (October 26, 2015)
- Used by ~32,000 websites around the world*
About & Statistics
An opensource javascript library to load, display and render maps from multiple sources on web pages
An Open-Source JavaScript Library for Mobile-Friendly Interactive Maps


Comparisons
Javascript
Size of minified JS file
Number of classes/namespaces
Unminified file
465.3 KB
163
3.5 MB*
126.5 KB
52
223.6 KB
*due to dependency to Closure Library
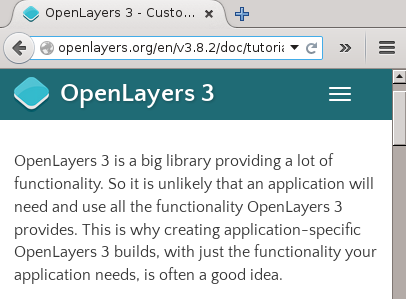
- A lot of built in stuff
- Very few plugins
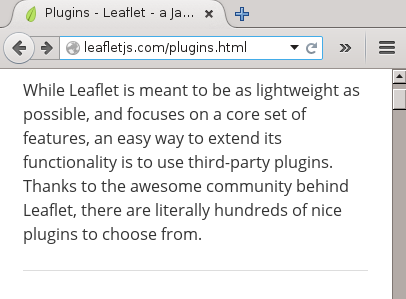
- Very few built in stuff
- A lot of plugins
Example
Require plugins
Leaflet.Omnivore (data formats)
Leaflet.draw
Leaflet.markercluster
Leaflet.MapboxVectorTile
Built-in
Library & Plugins
General Concept
- A wrapper over HTML elements
-
L.GridLayer is a grid of <div>s or <canvas>s or <img>s
- A model of "classic" GIS
- ol.Feature has a ol.geom which can be a ol.geom.LinearRing or ol.geom.MultiPoint or any Simple Features Specification type
Coding Patterns
Basic Map Display
<!DOCTYPE html>
<html>
  <head>
    <title>Simple Openlayers Map</title>
    <link rel="stylesheet" href="http://openlayers.org/en/v3.12.1/css/ol.css" type="text/css">
    <script src="http://openlayers.org/en/v3.12.1/build/ol.js"></script>
  </head>
  <body>
    <div id="map" class="map"></div>
    <script>
      var map = new ol.Map({
  	layers: [
    	new ol.layer.Tile({
      	source: new ol.source.OSM() })
  	],
  		target: 'map',
  		view: new ol.View({
		projection: ol.proj.get('EPSG:4326'),
    		center: [101.4603,2.9588],
    		zoom: 10})
	});
    </script>
  </body>
</html>
<!DOCTYPE html>
<html>
<head>
<title>Simple Leaflet Map</title>
<link rel="stylesheet" href="http://cdn.leafletjs.com/leaflet-0.7/leaflet.css"/>
<script src="http://cdn.leafletjs.com/leaflet-0.7/leaflet.js"></script>
</head>
<body>
<div id="map" style="width: 600px; height: 400px"></div>
<script>
var map = L.map('map').setView([2.9588,101.4603], 10);
mapLink = '<a href="http://openstreetmap.org">OpenStreetMap</a>';
L.tileLayer(
'http://{s}.tile.openstreetmap.org/{z}/{x}/{y}.png', {
attribution: 'Map data © ' + mapLink,
maxZoom: 18,
}).addTo(map);
</script>
</body>
</html>Basic Map Display
var map = new ol.Map({
layers: [
new ol.layer.Tile({
  source: new ol.source.OSM() })
  ],
      target: 'map',
      view: new ol.View({
      projection: ol.proj.get('EPSG:4326'),
      center: [101.4603,2.9588],
      zoom: 10})
});
var map = L.map('map').setView([2.9588,101.4603], 10);
mapLink = '<a href="http://openstreetmap.org">OpenStreetMap</a>';
L.tileLayer(
'http://{s}.tile.openstreetmap.org/{z}/{x}/{y}.png', {
attribution: 'Map data © ' + mapLink,
maxZoom: 18,
}).addTo(map);class constructors style
object factories style
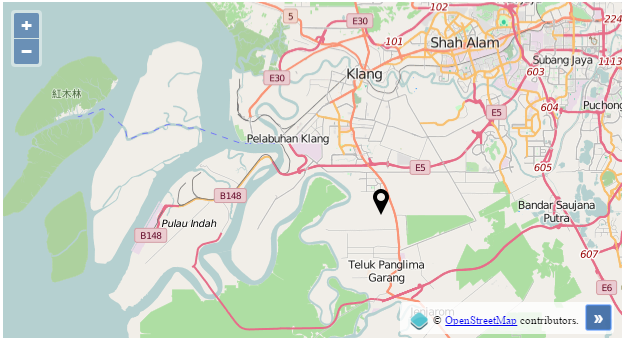
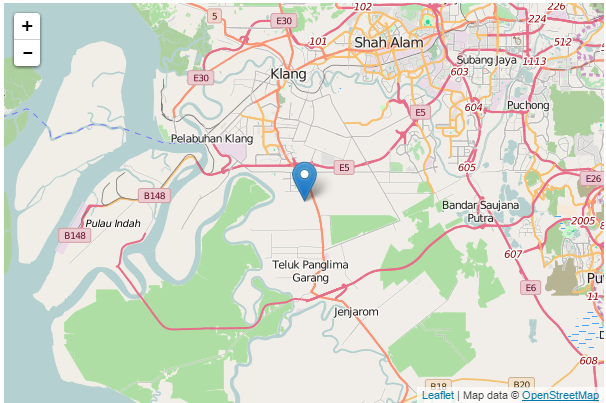
Add a Simple Marker
var iconFeature = new ol.Feature({
    geometry: new ol.geom.Point([101.4603,2.9588]),
});

var iconStyle = new ol.style.Style({
    image: new ol.style.Icon( ({
    src: 'http://dev.openlayers.org/releases/OpenLayers-2.13.1/examples/img/mobile-loc.png'
    }))
});

iconFeature.setStyle(iconStyle);
var vectorSource = new ol.source.Vector({
    features: [iconFeature]
});

var vectorLayer = new ol.layer.Vector({
    source: vectorSource
});

var map = new ol.Map({
    layers: [
    new ol.layer.Tile({
    source: new ol.source.OSM() }),
	vectorLayer
	],
  	target: 'map',
  	view: new ol.View({
	projection: ol.proj.get('EPSG:4326'),
    	center: [101.4603,2.9588],
    	zoom: 10})
});
var map = L.map('map').setView([2.9588,101.4603], 10);
mapLink = '<a href="http://openstreetmap.org">OpenStreetMap</a>';
L.tileLayer(
'http://{s}.tile.openstreetmap.org/{z}/{x}/{y}.png', {
attribution: 'Map data © ' + mapLink,
maxZoom: 18,
}).addTo(map);
var marker = L.marker([2.9588,101.4603])
.addTo(map);- No control for styling/labeling
- But can be achieved using various plugins
- More control over styling
- But need to understand feature/classes and how it works
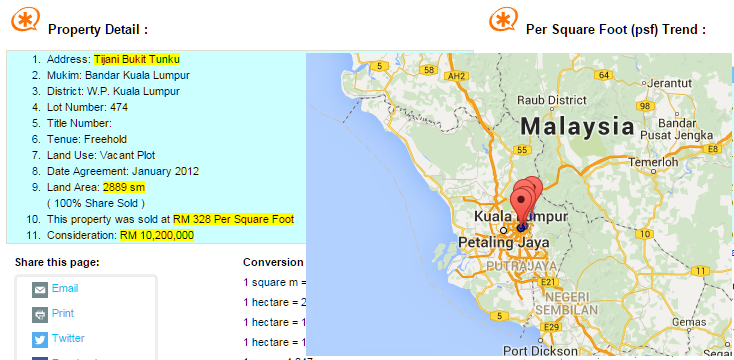
Add a popup to marker
// create icon feature
// 2 lines of codes

// define style for icon
// 3 lines of codes
// set icon style

// create popup div element for popup
// 10 lines of codes
// define style for popup
// 5-10 lines of codes
// define popup behavior (show, hide, close etc)
// 10-15 lines of codes

// bind popup to icon
// 3 lines of codes

// create and set vector layer for icon
// 4 lines of codes

var map = new ol.Map({
    layers: [
    new ol.layer.Tile({
    source: new ol.source.OSM() }),
	vectorLayer
	],
  	target: 'map',
  	view: new ol.View({
	projection: ol.proj.get('EPSG:4326'),
    	center: [101.4603,2.9588],
    	zoom: 10})
});
var map = L.map('map').setView([2.9588,101.4603], 10);
mapLink = '<a href="http://openstreetmap.org">OpenStreetMap</a>';
L.tileLayer(
'http://{s}.tile.openstreetmap.org/{z}/{x}/{y}.png', {
attribution: 'Map data © ' + mapLink,
maxZoom: 18,
}).addTo(map);
var marker = L.marker([2.9588,101.4603])
.addTo(map)
.bindPopup("<b>Hello!</b><br>I am a popup!")
.openPopup();Documentations
- Concise API reference
- Manually maintained HTML
- Not consistent
- Easily out of sync
- 5 examples (official)
- Verbose API reference
- Auto-generated JSDoc
- Consistent
- Always sync
- 125+ examples (official)
How to decide?
- Simple map display application
- various plugins to provide pretty UI
- easy to understand coding pattern
- Lightweight application for mobile apps
- only compile required plugins
-
Customized & complex GIS web application
- low level API access
- better support for OGC standards
- GIS layer/geom model
-
Require integration with various map formats or projections
- native support for CSV, KML & WKT - easy to handle interaction between map functions
- native support for reprojection
Trivia
- TMOM still use OpenLayers 2.X
- Leaflet doesn't support Mapguide 2.X tiled maps
- No Leaflet plugins yet
- Using Mapguide WMS will be too slow
- OpenLayers 3.X complete redesign of the mapping library, including removal of native support for Mapguide & use of Canvas renderer making it unable to work in IE8
- TMOM Web Mobile starts using OL3
Quiz
Customer requests assistance to display Smartmap API on their website with marker pointing location of their stores. Which map library should be sufficient to fulfill the requirement?
Question 1
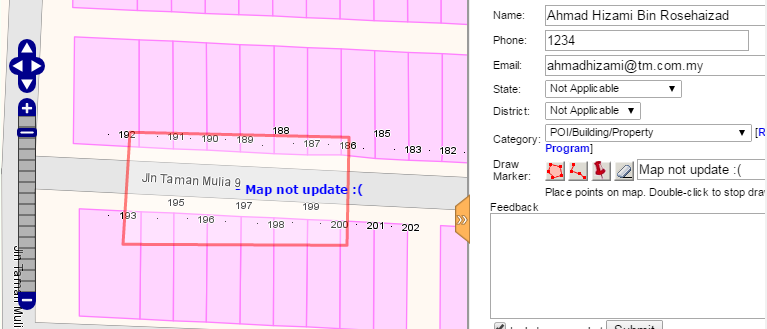
The new TMOM Mobile would like to implement similar feedback function like TMOM Web which allow users to draw point, line or polygon on a desired area. Which map library should be sufficient to fulfill the requirements?
Question 2
OL vs L
By hizumi