Grafana & You
Bringing it all together
A few points to explore in Grafana
Time range
Variables
Explore
Time Range
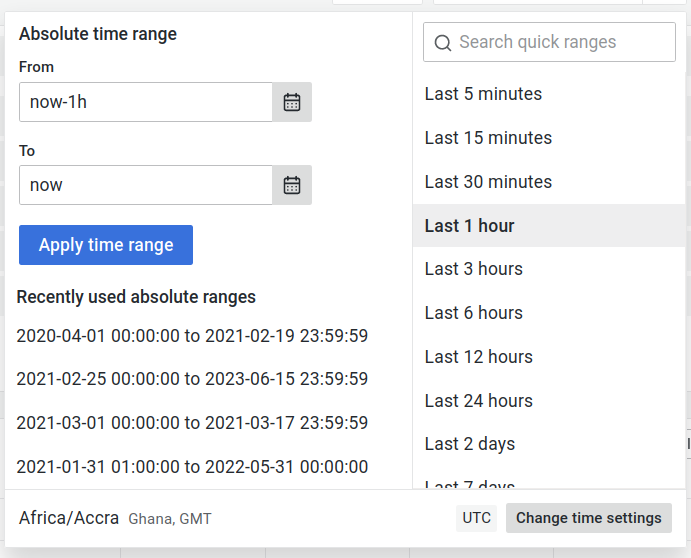
Grafana has a global (dashboard specific) time range that allows you to specify what range of data you want to observe at that time.
These parameters can be accessed both from SQL (in filtering by time) and Javascript in Plotly.
Variables
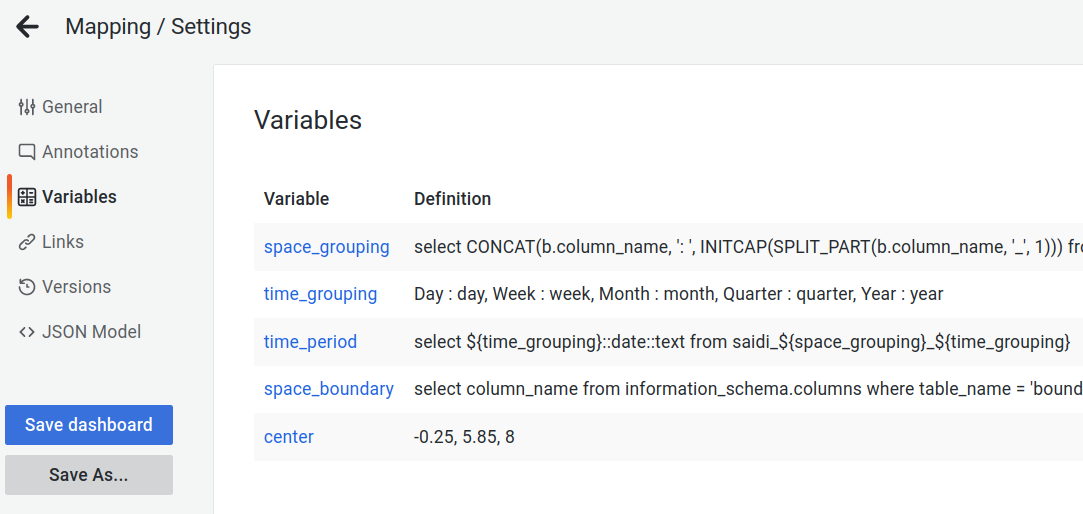
Variables are dashboard specific parameters that can exist in a few different forms (text, array, key/value) and provide dynamic values for SQL/Javascript to interpret.
They can also be the result of SQL queries as well!
Explore
A really nice way to check our TImescale/Postgres DB queries.
Systems involved
We pull our cached data from our db (Postgres) with queries in SQL
1
SQL
Formatting the data so to be parsed by Plotly is done in Javascript
2
Javascript
Plotly.js consumes the objects that we generate (data, layout, config) to update the Plotly graph
3
Plotly
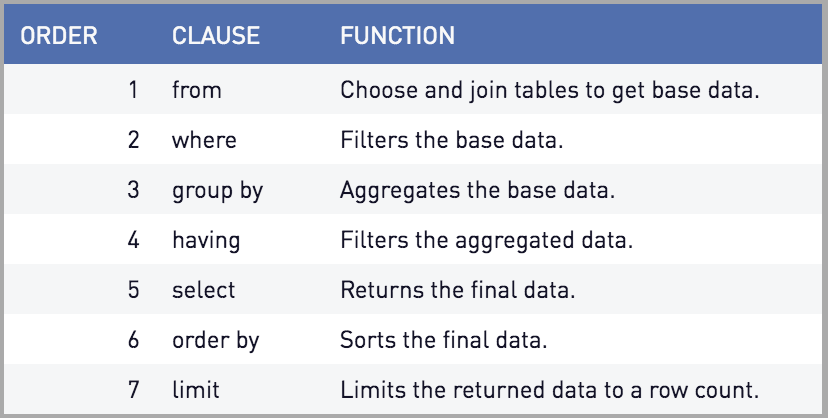
SQL is a tricky language, but essentially follows an order of execution.
Here's a nice resource for some of the more common operations in SQL and examples.
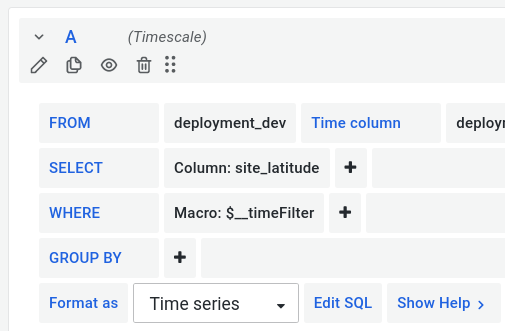
In initially editing SQL, you may see this version of the query builder.
To switch to the text editor of the query, click "Edit SQL". This allows us to modify the query directly.
There are a few unique elements to SQl queries in Grafana
-
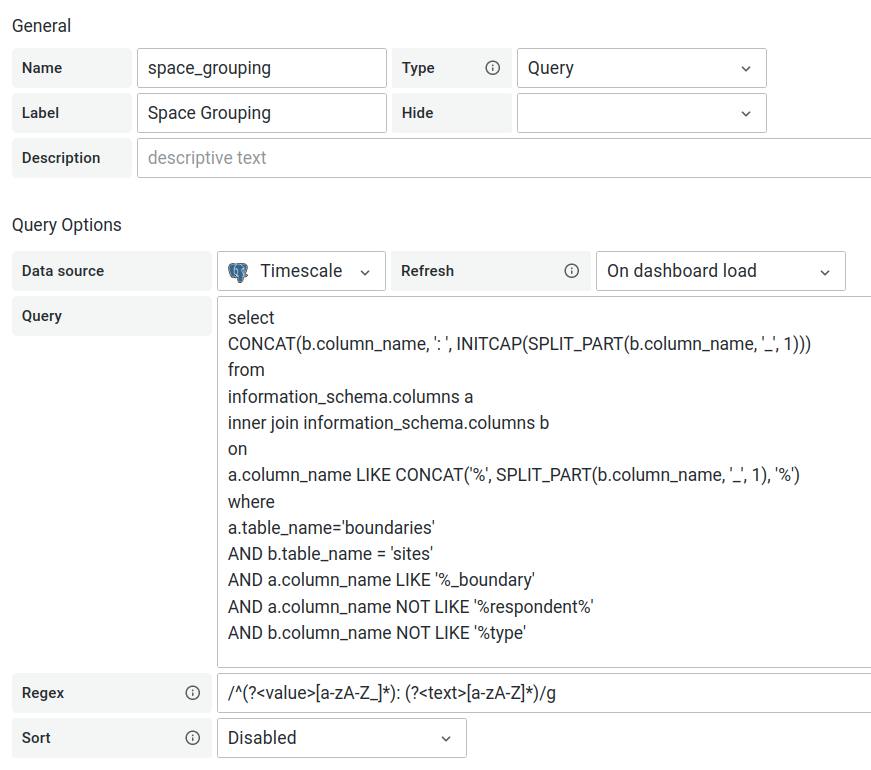
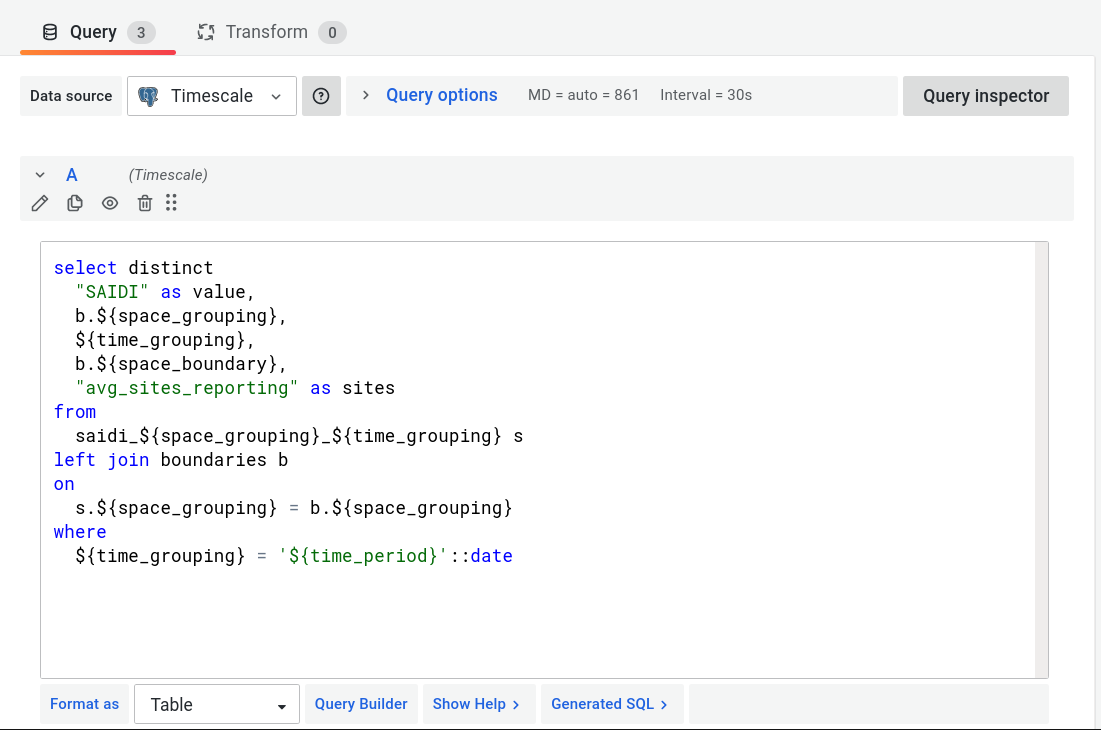
Variable names can be referenced with ${var} where var is the variable name
- This way you can add them as tables and columns, like saidi_${space_grouping}_${time_grouping}
-
Due to the way Plotly interprets variables from Grafana, we aren't able to use the "Time series formatting option in the "Format as" option
-
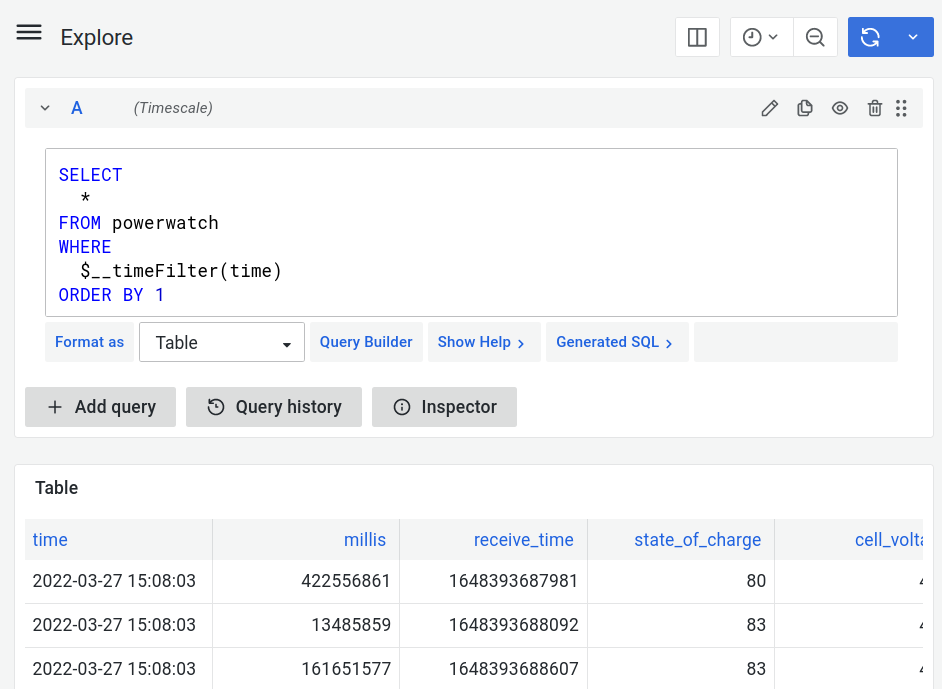
We can still get the same effect by filtering it ourselves with the "Table" option. This looks like ... WHERE $__timeFilter(time) ...
- "time" being the time column
-
We can still get the same effect by filtering it ourselves with the "Table" option. This looks like ... WHERE $__timeFilter(time) ...
SQL in Grafana
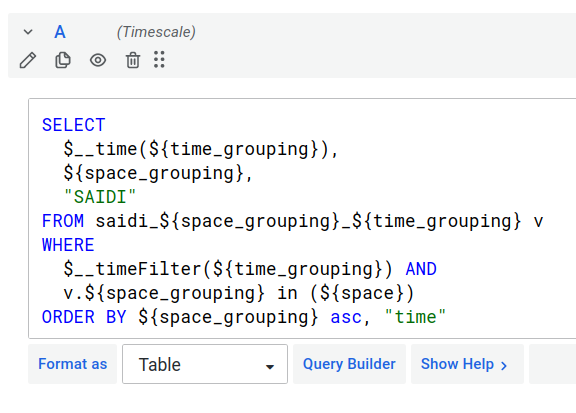
Example of filtering by time
In the time series plot for SAIDI, we can filter using Grafana's special `$__timeFilter()` function that gives us the window of time we have selected in Grafana's time range control
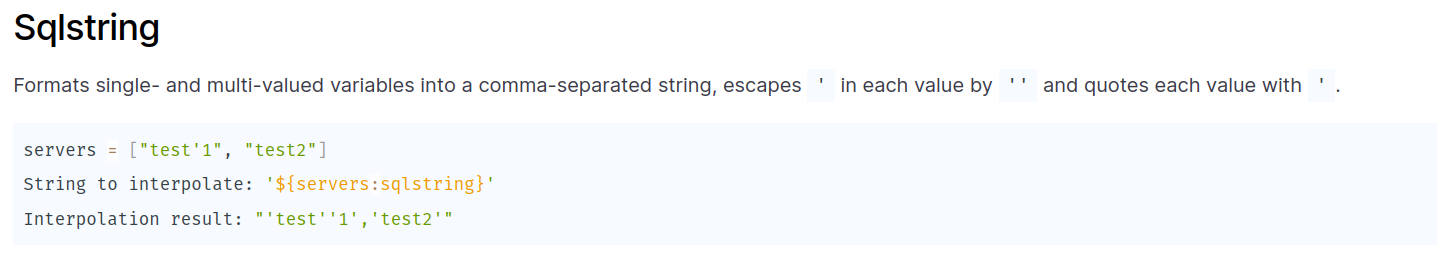
Formatting variables
Grafana also has it's own variable converters for various use cases. See here for Grafana's docs.
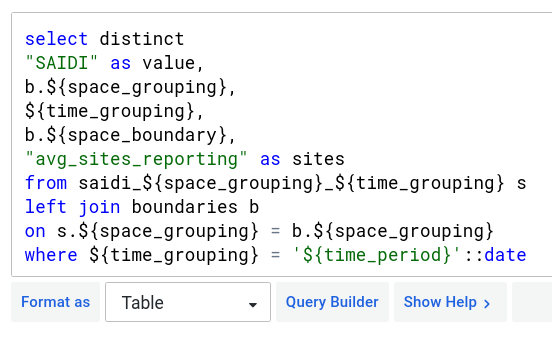
Within our SQL queries it is sometimes needed to cast a variable as a type like date. This is apart of Postgres, not Grafana. See here for more info.
The notation is `column::type`
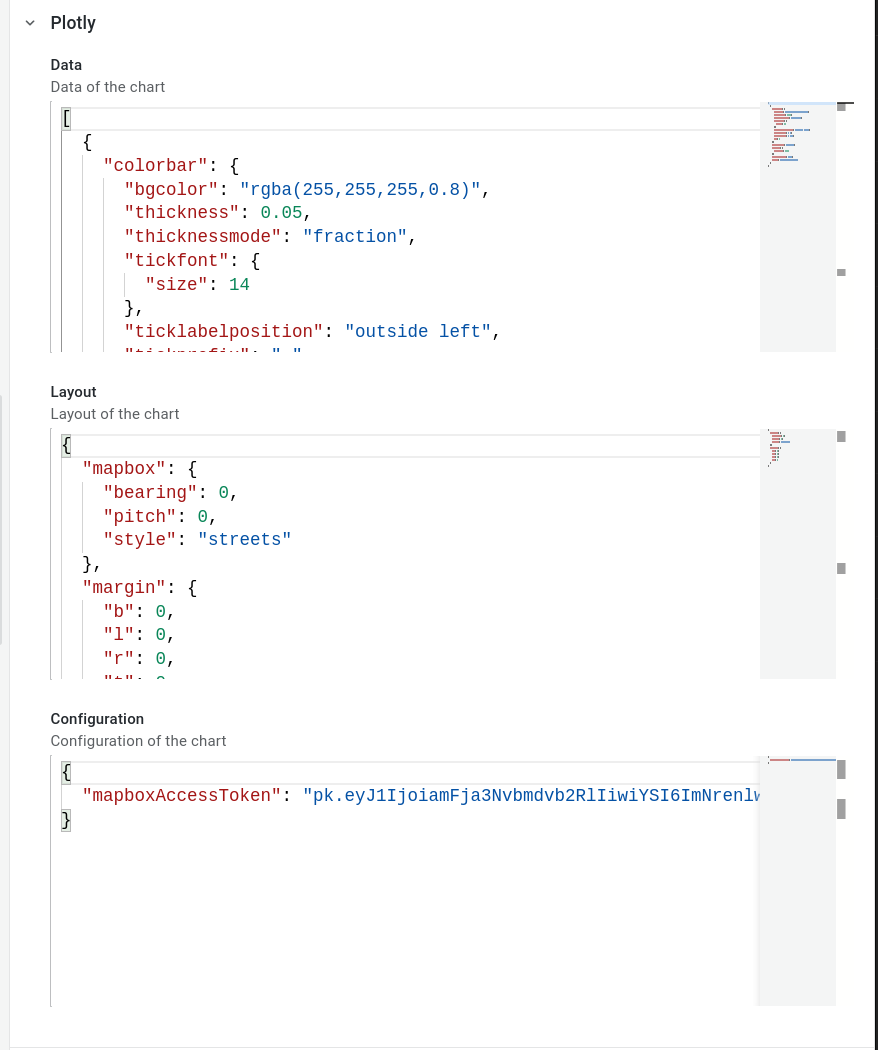
Javascript in the Plotly panel
Three major sections:
-
Plotly
- Data
- Layout
- Configuration
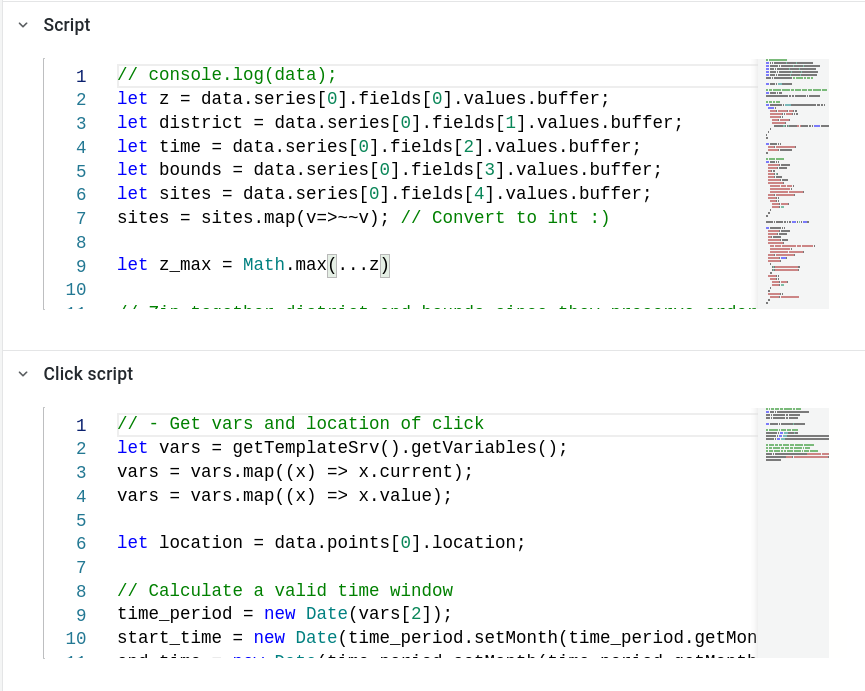
- Script
- Click script
The Plotly sections are actually just JSON objects and need to be formatted as such while the Script and Click script. However, all of the dict objects can be passed in through the Script. Let's see how!
Lots of tiny editors...
My suggestion: We only use the Script panel and move content from Data, Layout and Config to Script (instead of partitioning)
Variables from SQL are accessed via
`let z = data.series[0].fields[0].values.buffer;`
Where series 0 is the first SQL query and fields 0 is the first column returned in the SQL Select.
A single return must come at the end of the script like `return { data: [trace1, trace2], layout: layout, config: config};` The Data object can contain multiple plots, called traces, and they are packed within a single array while returned.
Miscellaneous Plotly
Thank You!
Questions?
Grafana & You
By jacksongoode


