


Karl Ho
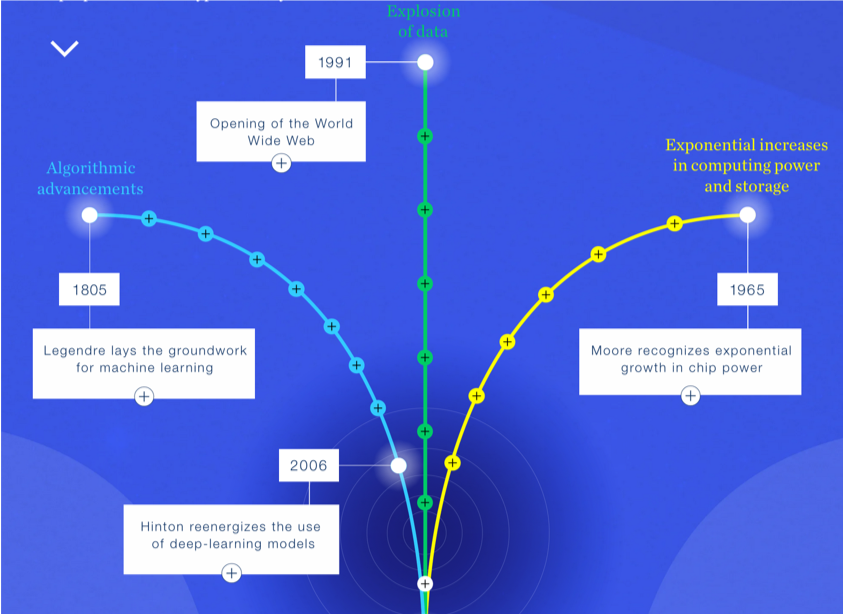
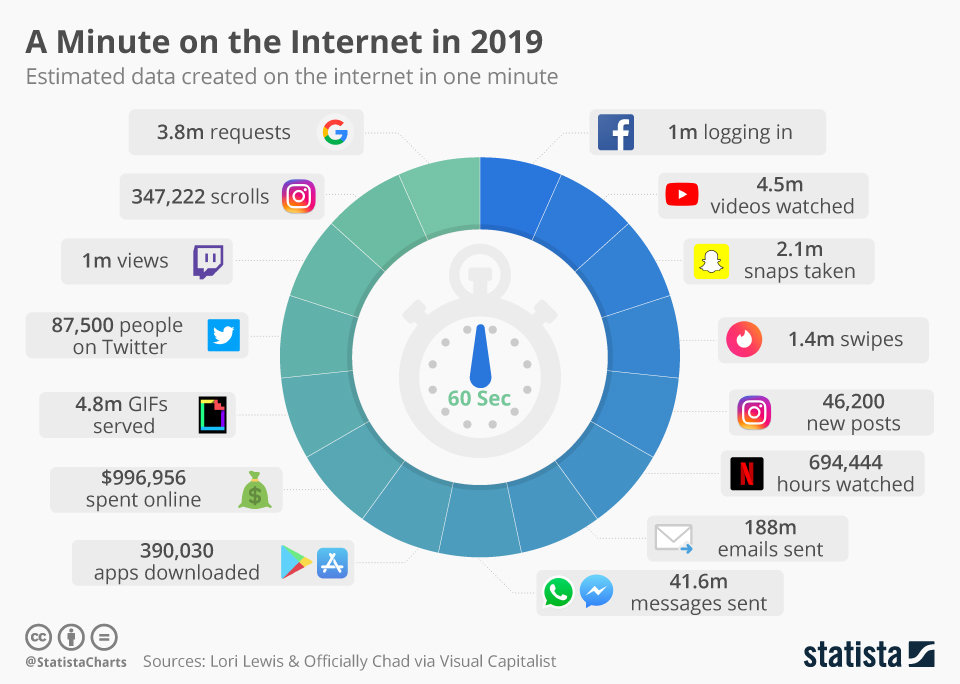
Data Generation datageneration.io
Karl Ho
School of Economic, Political and Policy Sciences
University of Texas at Dallas
NCHU+UT Dallas Data Science Short Course Series
The certificate program is composed of short courses introducing students to data science and applications. Each course is delivered in three hours, giving overview and survey in subfields of data science with illustrations and hands-on practices. Students should follow pre-class instructions to prepare materials and own device before coming to class.
This introductory course is an overview of Data Science. Students will learn:
Recommended software and IDE’s
Cloud websites/accounts:
Optional software and IDE’s:
Text editor of own choice (e.g. Visual Studio Code, Sublime Text, Bracket)
McKinsey & Co., An Executive’s Guide to AI
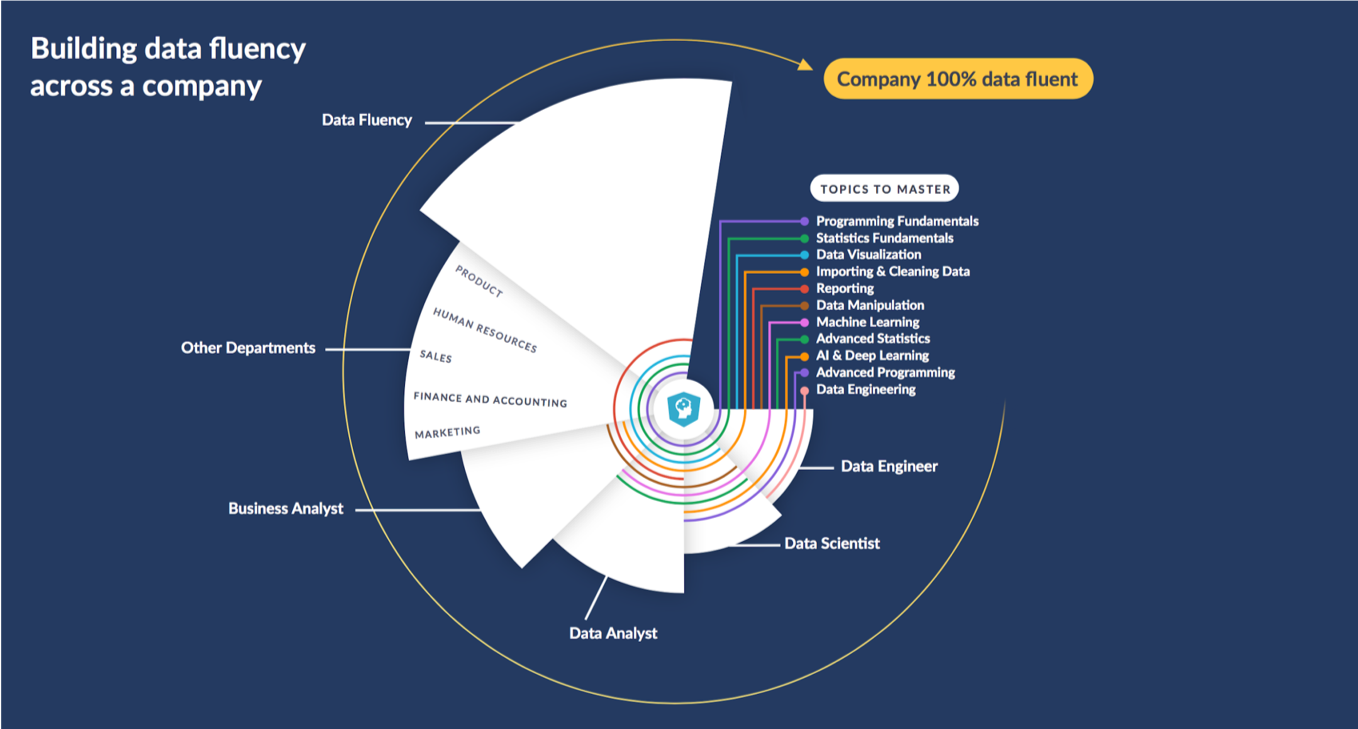
Hugo Bowne-Anderson. 2019. "What 300 L&D leaders have learned about building data fluency"
Hugo Bowne-Anderson. 2019. "What 300 L&D leaders have learned about building data fluency"
Hugo Bowne-Anderson. 2019. "What 300 L&D leaders have learned about building data fluency"
Data fluency
Everybody has the data skills and literacy to understand and perform data driven documents and tasks
Danger of immature data fluency
Introduction - Data theory
Data methods
Statistics
Programming
Data Visualization
Information Management
Data Curation
Spatial Models and Methods
Machine Learning
NLP/Text mining
metadata, paradata
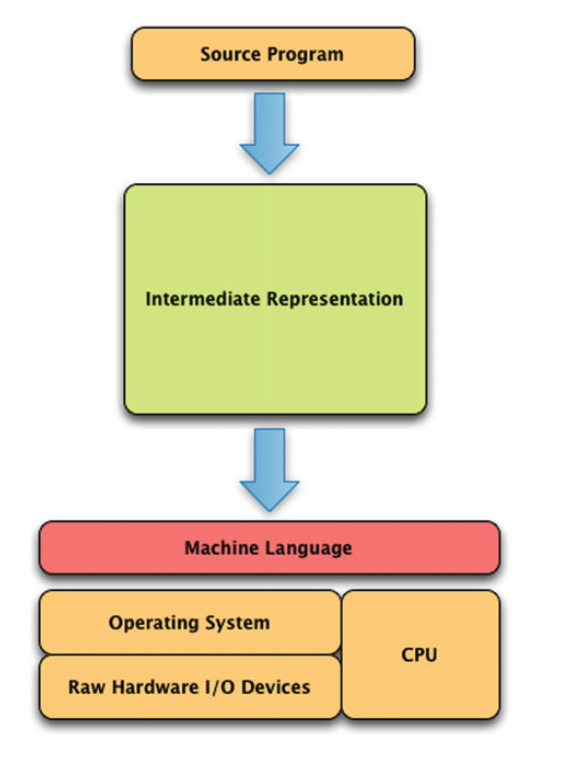
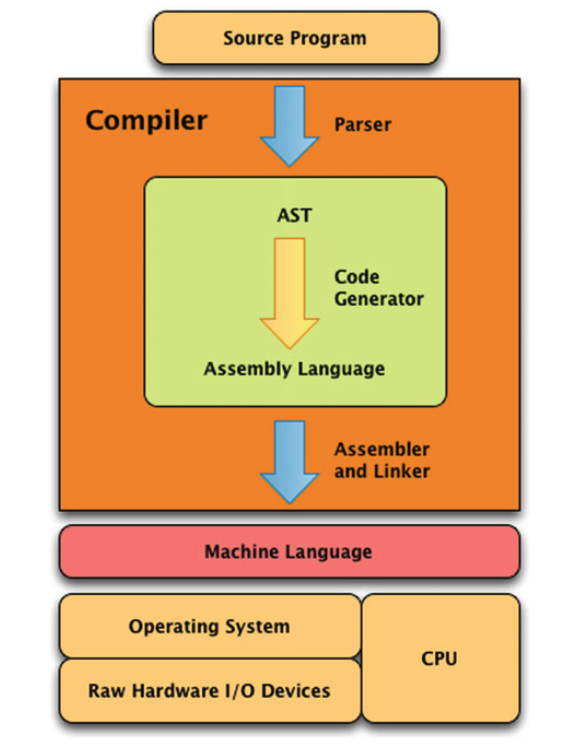
Data programming
}
- Maribel Fernandez 2014
# Create preload function
# Check if a package is installed.
# If yes, load the library
# If no, install package and load the library

preload<-function(x)
{
  x <- as.character(x)
  if (!require(x,character.only=TRUE))
  {
    install.packages(pkgs=x,  repos="http://cran.r-project.org")
    require(x,character.only=TRUE)
  }
}
learning how to program can significantly enhance how social scientists can think about their studies, and especially those premised on the collection and analysis of digital data.
- Brooker 2019:
Chances are the language you learn today will quite likely not be the language you'll be using tomorrow.
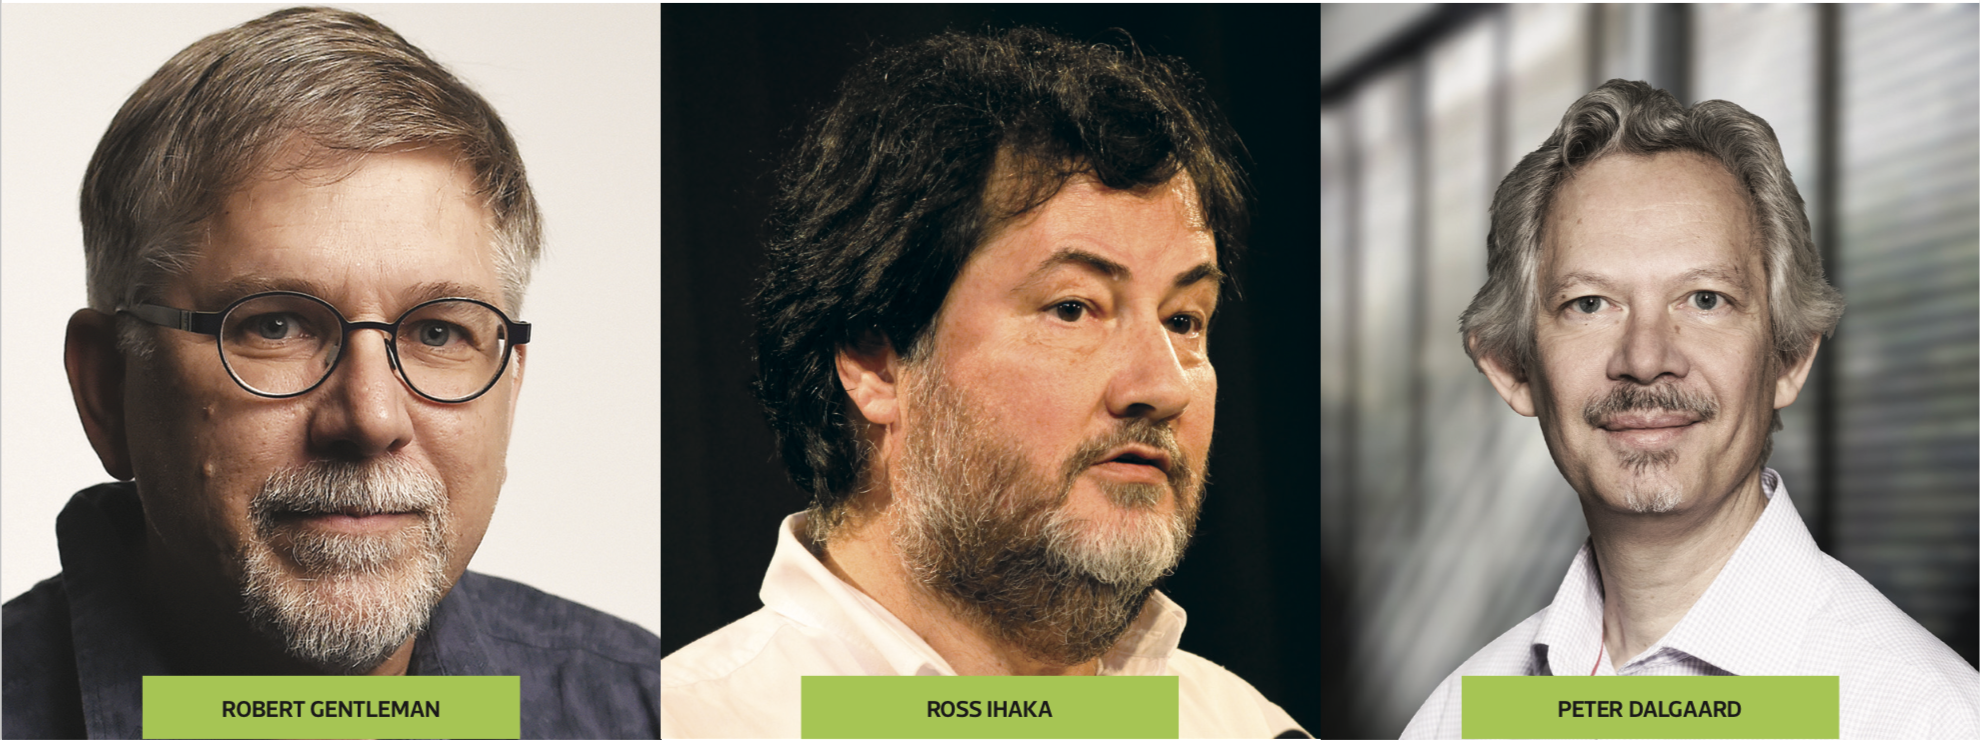
- Venables, Smith and the R Core team
Source: Nick Thieme. 2018. R Generation: 25 years of R https://rss.onlinelibrary.wiley.com/doi/10.1111/j.1740-9713.2018.01169.x
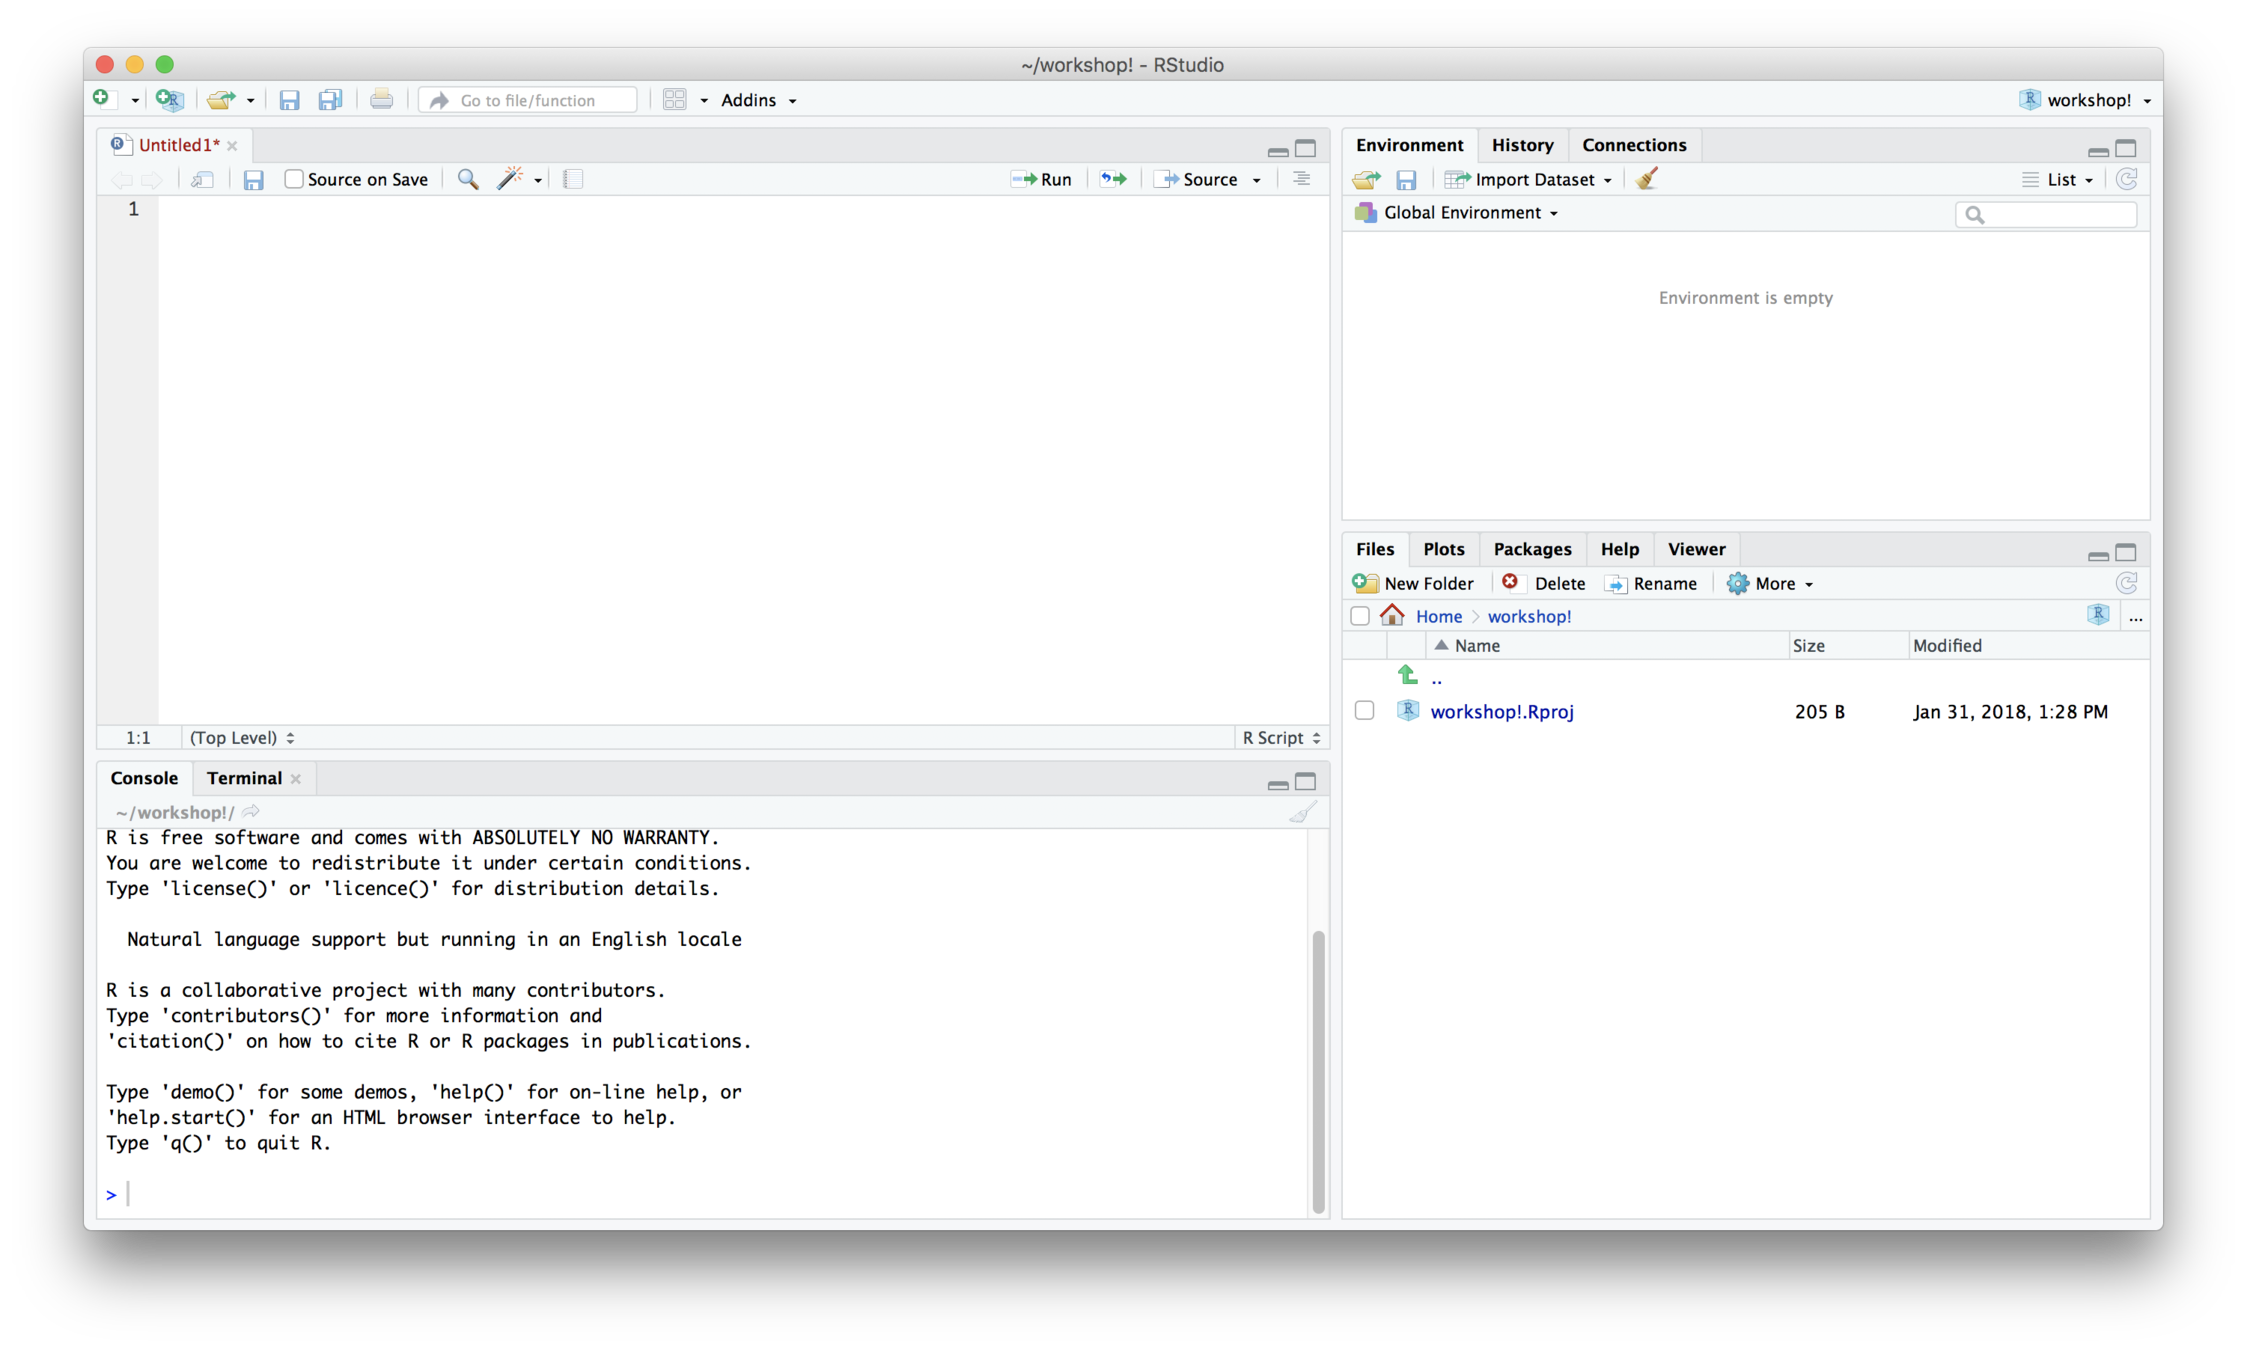
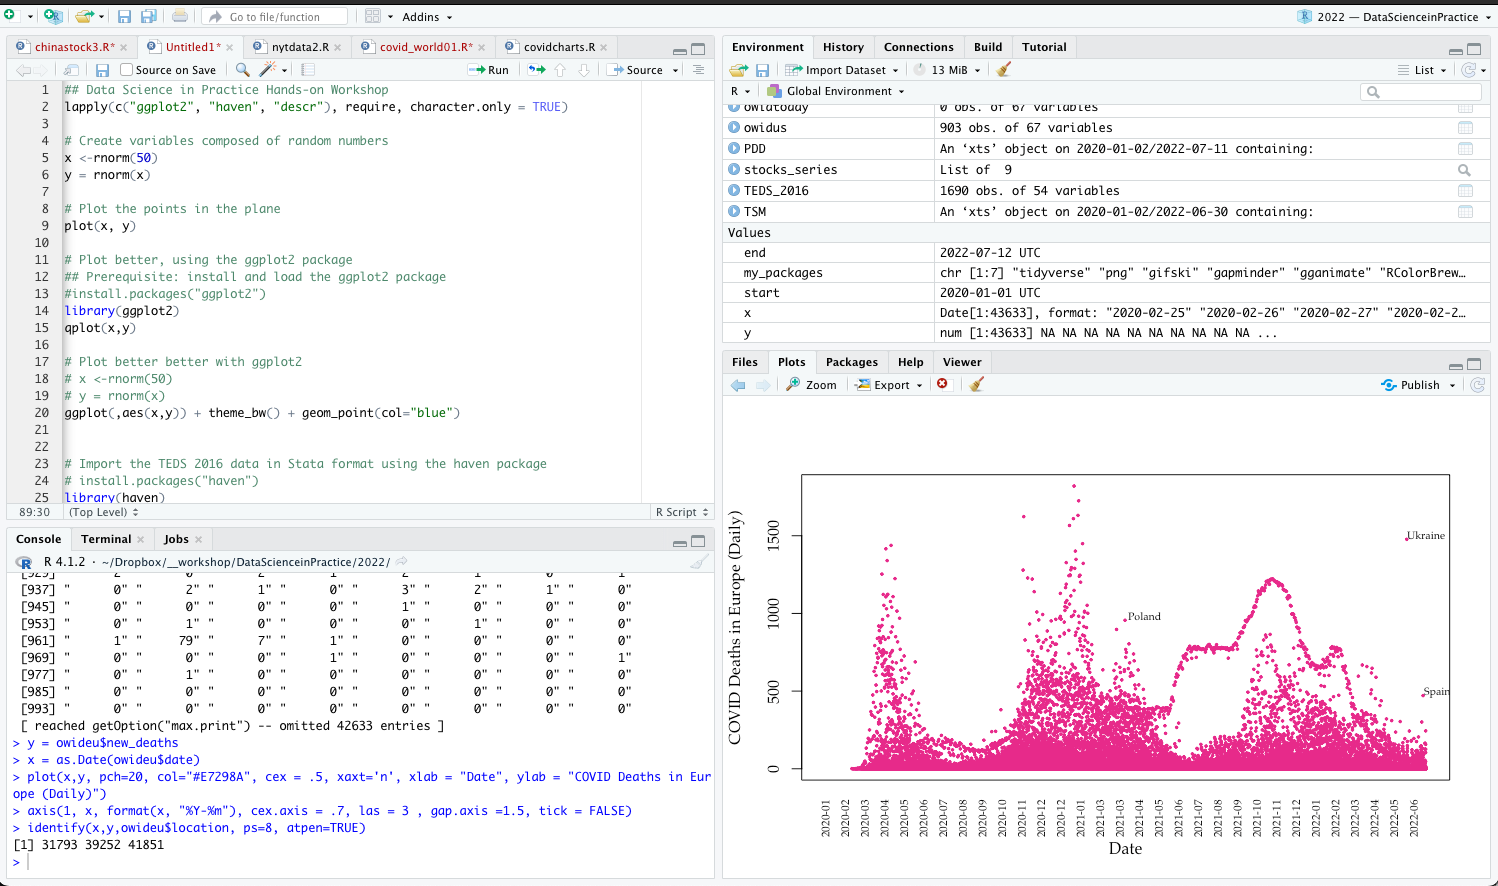
The script window:
You can store a document of commands you used in R to reference later or repeat analyses
Environment:
Lists all of the objects
Console:
Output appears here. The > sign means R is ready to accept commands.
Plot/Help:
Plots appear in this window. You can resize the window if plots appear too small or do not fit.
mydata <- read.csv(“path”,sep=“,”,header=TRUE)
mydata.spss <- read.spss(“path”,sep=“,”,header=TRUE)
mydata.dta <- read.dta(“path”,sep=“,”,header=TRUE)
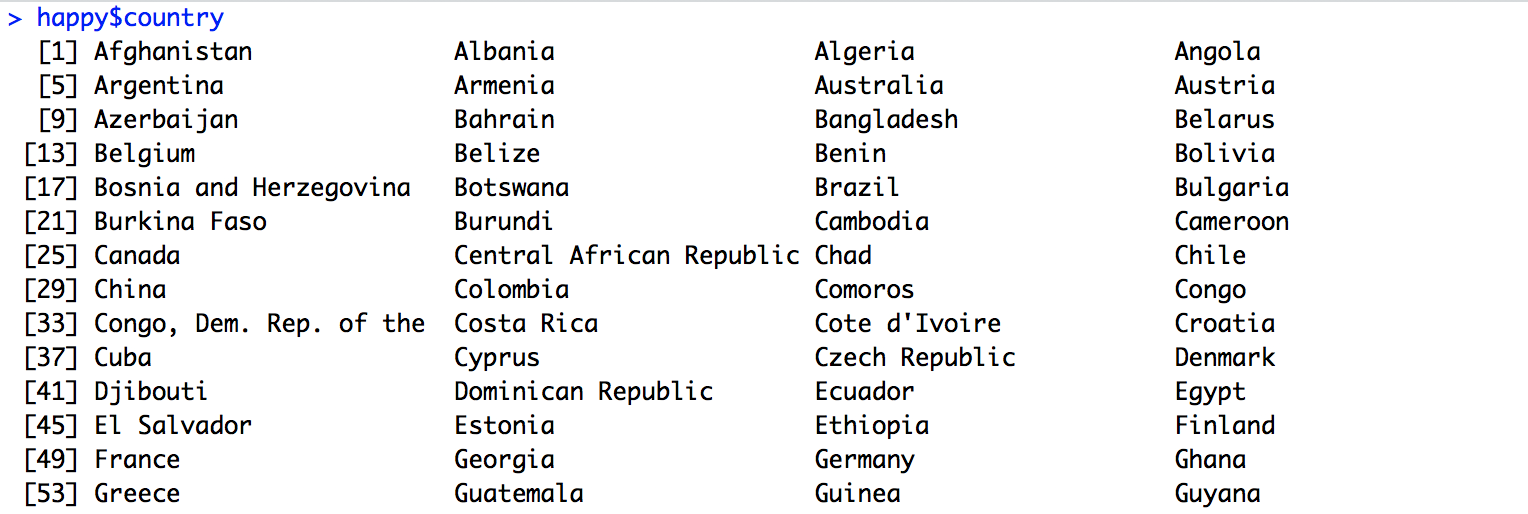
happy=read.csv("https://raw.githubusercontent.com/kho7/SPDS/master/R/happy.csv")
mydata$column
mydata$Age.rec<-recode(mydata$Age, "18:19='18to19'; 20:29='20to29';30:39='30to39'")
Beware of bugs in the above code; I have only proved it correct, not tried it."
- Donald Knuth, author of The Art of Computer Programming
Source: https://www.frontiersofknowledgeawards-fbbva.es/version/edition_2010/
YAML (Yet Another Markup Language or YAML Ain't Markup Language) is a data-oriented, human readable language mostly use for configuration files)
Undocumented with no or little information on sampling
Link to RStudio Cloud:
https://posit.cloud/content/6625059
- Need a GitHub and RStudio Account
Link to class GitHub:
Link to RStudio Cloud:
https://rstudio.cloud/project/4631380
- Need a GitHub and RStudio Account
Link to class GitHub:
By Karl Ho


