Managing pathogen spillover at the wildlife-livestock interface
Kezia and Paul
with input from Ryan Miller, Steve Sweeney, Tom Besser, Frances Cassirer, and USDA Wildlife-Livestock Spillover workshop participants
Task
Develop a general quantitative model to describe pathogen spillover risk at the wildlife-livestock interface


Reservoir
Recipient
Index case
Onward transmission
Reservoir
Recipient
Index case
Onward transmission
(...or livestock into wildlife)
Potentially relevant factors
Between-host processes in reservoir
Interspecific contact processes
Pathogen establishment processes
Pulliam 2008; Lloyd-Smith et al. 2009; Plowright et al. 2015; Plowright et al. 2017
Reduce to a general-yet-useful framework that "works" for management
Between-host processes in recipient
Management
Between-host processes in reservoir
Interspecific contact processes
Pathogen establishment processes
Between-host processes in recipient
Test-cull
Vaccination
Movement
restrictions
Attractant management
Fencing
Biosecurity
Phytosanitary controls
Density reductions
Density reductions
Vaccination
Treatment
Increased "resilience"
e.g., nutrition, antibiotics
Vaccination
Movement restrictions
Zoning
Depopulation/
Stamping out
Management
Test-cull
Vaccination
Movement
restrictions
Attractant management
Fencing
Biosecurity
Phytosanitary controls
Density reductions
Density reductions
Vaccination
Treatment
Increased "resilience"
e.g., nutrition, antibiotics
Vaccination
Movement restrictions
Zoning
Depopulation/
Stamping out
Pathogen movement process in reservoir
Epidemic growth rate in recipient
Test-cull
Movement restrictions in reservoir
Attractant management
Density reductions
Treatment
Zoning in recipient
Depopulation/Stamping out
Phytosanitary controls
Biosecurity
Vaccination
Pathogen movement process in reservoir
Epidemic growth rate in recipient
Movement restrictions in reservoir
Attractant management
Density reductions
Zoning in recipient
Depopulation/Stamping out
Phytosanitary controls
Biosecurity
Vaccination
Pathogen movement rate in reservoir
Epidemic growth rate in recipient
Test/Cull reservoir
Treatment
Basic Premise
Spatiotemporal distribution of spillover risk hinges on:
- Movement of pathogen in reservoir host
- Epidemic growth rate (in either host spp.??)
Spatiotemporal distribution of spillover risk determines optimal management strategy
Specific hypotheses
- Reservoir movement limited => regionalize/stamp-out
- Low growth rate => manage reservoir prevalence
- Reservoir movement high and epidemic growth rate high => biosecurity/vaccination on recipient
Less certainty in space
Less time to act
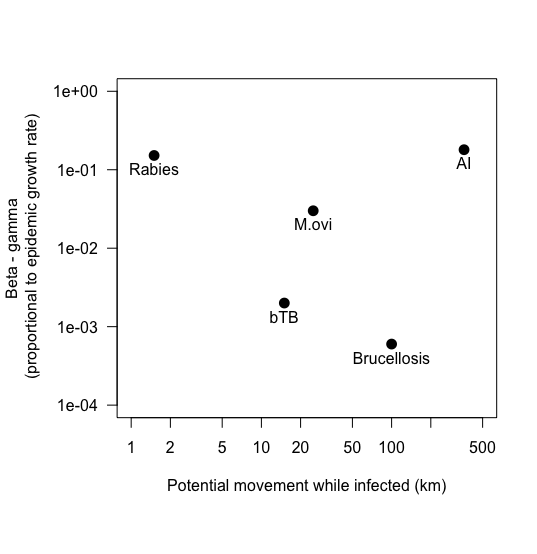
Distance host could move while infected
Epidemic growth rate
Reducing reservoir prevalence or density
Halting onward transmission
Reducing interspecific contact through biosecurity on recipient
(Now in graphical form)
Three emergent research questions
1. Where do actual systems fit on those axes?
3. Does the cost-benefit framework hold up?
2. What do management actions cost?
Where do actual systems fit?
Wildlife-Livestock systems
African swine fever
Canine distemper virus
Rinderpest
Tularemia
Rabies
Phocine distemper virus
Brucellosis
M.ovi
Avian influenza
Classical swine fever
Salmonella
Foot and Mouth disease
Echinococcus
Paratuberculosis
Scrapie
Anthrax
bTB
Q fever
West Nile virus
Pseudorabies virus
Bluetongue virus
Human systems
Measles
HIV
SARS
Polio
Rubella
Smallpox
Pertussis
Diphtheria
Chickenpox

Pathogen type
dsRNA viruses
Bluetongue
dsDNA viruses
African swine fever
Chickenpox
Smallpox
ssRNA viruses
Rinderpest
Rabies
Phocine, Canine distempers
Avian influenza
Classical swine fever
Food and Mouth disease
West Nile virus
Measles
SARS
Polio
Rubella
Tapeworm
Echinococcus
Bacteria
Tularemia
Q fever
Brucellosis
Movi
Salmonella
Movi
Anthrax
Paratuberculosis
Pertussis
Diphtheria
bTB

Pathogen type
Mode of transmission
Exudate discharge
Classical swine fever
Pseudorabies virus
Canine distemper virus
Saliva
Diphtheria
Bites
Rabies
Aerosolized
Foot and Mouth disease
Q fever
Respiratory droplets
Chickenpox
Rinderpest
Phocine distemper
M.ovi
Measles
SARS
Rubella
Smallpox
Pertussis
Fecal-oral
Echinococcus
Avian influenza
Salmonella
Polio
Vectored
African swine fever
Tularemia
West Nile virus
Bluetongue
Environmental
Anthrax
Paratuberculosis
Scrapie
bTB
| Pathogen | Reservoir host | Time to recovery/death (days) | Home range size (or foray distance) per Infectious period | Potential movement during I |
|---|---|---|---|---|
| Avian influenza | mallards | 7 | 1400 km in 27 days median during fall migration (Krementz et al. JoFishWildlifeManage 2012) | 360 km |
| Rabies | raccoons | ~ 35 | 25-190 ha annually (Prange et al. 2004 JMammal) (day-range 1.14 km, Carbone) | 1-2 km |
| Brucellosis | elk | 730 | 13468 ha (Yellowstone over summer; Anderson 2005 Landscape Ecol). Carbone (2005) has "Cervus elaphus" day-range at 3.4 km | (100 km?) |
| BHS pneumonia | (bighorn?) sheep | 20 | 25 km foray dist (O'Brien 2014 WildSocBull) | 25 km |
| bTB | white-tailed deer | 730 | 1.34 km^2 for Females (Walter 2009); 77-202 ha (Campa 2011 WildSocBull) | 15 km |
| Bluetongue | (Culicoides spp.) | 20.6 | 150 km | |
| ASF | warthogs | 20-40 |
Movement potential while infected
US commodity densities
(blue = low; orange = high)
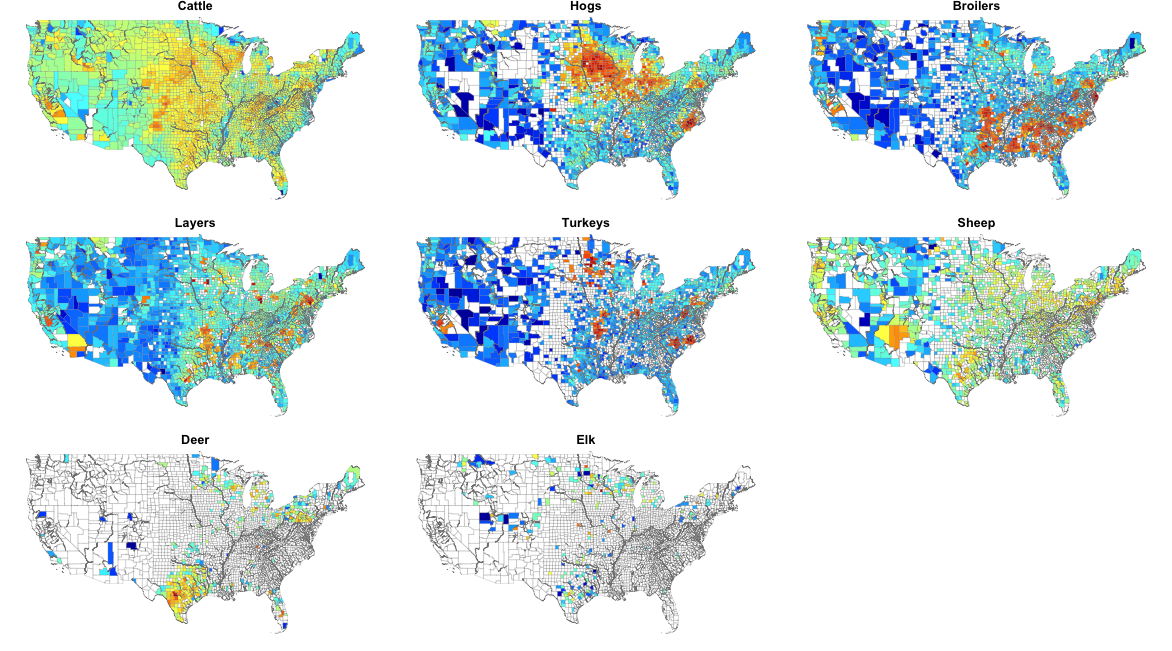
Spatial structure varies dramatically across domestic livestock as well.

What does management cost?
Costs are relatively consistent across systems
Fencing -- IA State fencing cost document
Diagnostic costs for test-cull from Ames national diagnostic lab
Indemnity costs (e.g., what USDA pays to compensate for killing a livestock animal) published
Vaccine costs relatively consistent IF vaccine is developed and primary cost is vaccine, not delivery (several reviews)
Does the framework hold up?
Reservoir movement and disease
Interspecific contact & spillover
Recipient movement and disease
Parameters:
Epidemic growth rate
Contact structure
Natural disease process
Management experiments
t = 1
X

(\tau)
\tau = 1
Deterministic disease updates
t = 1
t = 2
Hosts move according to kernel
Mover's infection status depends on prevalence
Stochastic movement updates
(\tau)
(\tau)
\tau = 2
\tau = 1
t = 2
Deterministic disease updates

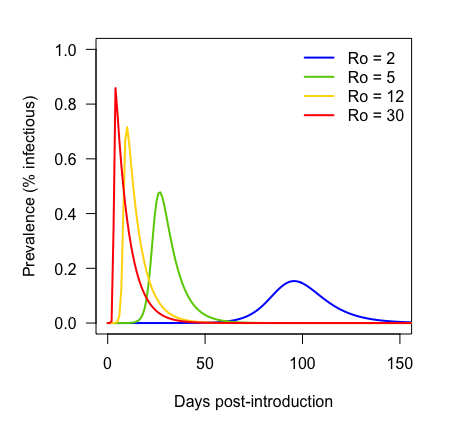
Parameter space
Ro
Tail weight of dispersal kernel
(recovery rate fixed, so Ro determines epidemic growth rate)
Outputs
1) Number of reservoir patches infected
2) Number of recipient patches infected
3) Total recipients infected over whole simulation

Tail weight decreases from right to left
Beta decreases from bottom to top
Colors ramp according to first day cell became infected
Spillover
Random subset of patches chosen to harbor "recipient hosts"
Recipients get infected following random contacts with infected LOCAL reservoir hosts
Recipient map
Reservoir map
Recipient map
Management
Vaccination:
Depopulation:
Test-cull:
Biosecurity:
Adjust recipient SIR state-space so that R goes up, and S goes down
Reset recipient patch to S = 1, I = 0, R = 0
If prevalence exceeds some threshold...
Adjust reservoir SIR state-space so that R goes up, and S goes down
Decrease interspecific contact rates at designated patches
Apply management up to threshold "investment", then stop managing
Simulation structure
Grid the two parameters over log-space
Run 5 simulations with each management action at each parameter combination (total of 25 sims / param set)
Record median and range of outputs for each parameter set/management action
Record median and range of outputs for each parameter set/management action
Specify management $$ and livestock premise size
Using medians/ranges, determine which management action is "best" at each parameter combination


Increasingly aggregated
Increasingly aggregated
Transmission coefficient
(prop. to epidemic growth rate)
Transmission coefficient
(prop. to epidemic growth rate)
Three emergent research questions
1. Where do actual systems fit on those axes?
3. Does the cost-benefit framework hold up?
2. What do management actions cost?
Can roughly be described with commonly-used tools
??? So far, so good...!
Less certainty in space
Less time to act
Distance host could move while infected
Reducing reservoir prevalence or density
Halting onward transmission
Reducing interspecific contact through biosecurity on recipient
Success??
Epidemic growth rate
Is this useful?
How far do I push the empirical side?
[ditto] the economic weeds?
...Did we know this already?
What does management cost?
| Pathogen | Median domestic operation size | Median operations per producing county | Proportion of counties with production | Vaccine cost | Treatment/Post-exposure prophylaxis cost | Diagnostic cost | Fencing cost | Indemnity cost per animal |
|---|---|---|---|---|---|---|---|---|
| AI | ||||||||
| bTB | ||||||||
| Brucella Abortus | ||||||||
| Rabies | ||||||||
| EHD/ Bluetongue | ||||||||
| Newcastle | ||||||||
| M.ovi |
Costs are relatively consistent across systems
Does the cost-benefit framework hold up?
County-scale (30mi x 30mi cells; 100x100 cell grid)
Reservoir and recipient populations
- AcReservoir has constant density across all cells
- Recipients also occur in a random subset of cells
- e.g., counties with lots of poultry/beef/sheep operations
Disease dynamics (deterministic)
- SIR disease process
- recovery rate fixed to constant
- transmission rate varies to generate different epidemic growth rates
Movements (stochastic)
-
Reservoir: Movement probabilities function of distance between cells
- User-fixed sill beyond which no movements occur
- P(Mover is infected) proportional to current cell prevalence
- All infected movers cause determinist disease process to begin in their new cell.
- Recipient: No movements
Spillover
- Interspecific contacts occur between reservoir and recipients in same cell
- P(Infectious contact) proportional to current reservoir prevalence in the cell
Management
- Alter disease dynamics, interspecific contact rate, or P(transmission | contact)
- Management actions applied under a user-specified budget
- Only one form of management can be taken.
How to categorize systems?
- Pathogen type
- Mode of transmission (vectored, environmental, direct??)
- Host ecology (... but which host, wildlife or livestock?)
- Available tools (e.g., treatment, vaccination, diagnostics)
- Rate or structure of spread (e.g., travelling waves?)
\text{Epidemic growth rate = }\beta - \gamma
\beta = R_{0}\times \frac{1}{\text{Time to recovery}}
| Pathogen | R-naught | Time to recovery/death | beta | beta - gamma |
|---|---|---|---|---|
| Avian influenza | 2.24 | 7 days (1/7 = .14) | .32 (calculated) | .18 |
| Rabies | 2 | ~ 35 days (5 weeks; e.g. Tinline 2002 PVM) (1/35 = 0.028) | 0.18 in foxes (refs in Suppo et al 2000 PhilTrans) | .152 |
| Brucellosis | 1.46 | 2 years (1/730 = .0014) | .002 for bison (FD; Dobson & Meagher) | .0006 |
| BHS pneumonia | ~1.6 | 20 days?? (1/20 = .05) | 0.08 | .03 |
| bTB | 2 years?? based on most animals infected 1.5-2 yrs, survive 4-5 yrs? (1/730 = .0014) | 0.043/12 = 0.0036 (from Cosgrove & Ramsey models... it's on a monthly scale) | 0.002 | |
| Bluetongue | temperture-dependent; ranges from <1 to 18 | 20.6 (for cattle; 1/20.6 = .048) in Graesbol 2012 Sci Reps; 8 days for sheep Luedke 1969 cited in Hartemink 2009) | .864 | .816 |
| Newcastle disease virus | ||||
| ASF | ~1.58 | 20-40 days (Ferriera 2013 Vet Micro) (1/30 = .033) |
1. Extract empirical estimates: Epidemic growth rate
Less certainty in space
Less time to act
Reducing reservoir prevalence
Halting onward transmission
Reducing interspecific contact
2. Identify costs associated with management categories
| Management category | Action | Examples |
|---|---|---|
| Halting onward transmission | Depopulation | AI |
| Post-exposure treatment | Rabies | |
| Recipient movement controls | Movi (e.g., translocations), brucellosis | |
| Reducing reservoir prevalence | Test/cull | Brucellosis (WY); bTB |
| Reservoir vaccination | Brucellosis; bTB | |
| Reducing interspecific contact and susceptibility in recipient | Fencing | Brucellosis, bTB |
| Phytosanitary controls | AI, EHD | |
| Recipient vaccination | AI, brucellosis, bTB, rabies |
General Framework
By Kezia Manlove
General Framework
Proposed general framework for considering spillover risk at the Wildlife-Livestock interface. June 8, 2017; K. Manlove, preparer.


