Epidemic Curve
S
I
R
I transmits to S
I recovers to R
I dies of disease
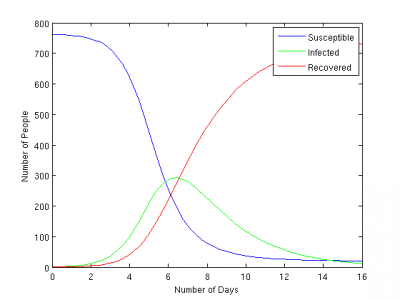
Exponential growth
Decay due to Susc. decline
DO NOT run out of S's
Time (days)
Compartment size
Susceptible
Infected
Recovered
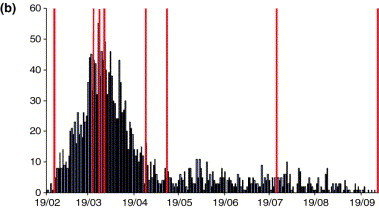
Foot and Mouth Disease (UK, 2001)
Ebolavirus (2014)
Five determinants of curve structure
1. Communicable period
2. Latent period
3. Recovery rate
4. Degree of immunization
5. Between-host transmission rate
R_{0}
and invasion
R_{0}
: # of secondary infections produced by a single infectious individual in an otherwise fully susceptible population
(Management goal)
R_{0} \leq 1
=> pathogen cannot invade
\frac{dS}{dt} = -\beta SI
\frac{dI}{dt} = \beta SI - (\gamma + \alpha) I
\frac{dR}{dt} = \gamma I
R_{0} = \frac{\beta}{\gamma}
| Disease | Mode of transmission | |
|---|---|---|
| Measles | Airborne | 12-18 |
| Diptheria | Saliva | 6-7 |
| Smallpox | Airborne droplets | 5-7 |
| Polio | Fecal-Oral | 5-7 |
| Rubella | Airborne droplets | 5-7 |
| Mumps | Airborne droplets | 4-7 |
| HIV | Sexual | 2-5 |
| Pertussis | Airborne droplets | 5.5 |
| SARS | Airborne droplets | 2-5 |
| Influenza (1918) | Airborne droplets | 2-3 |
| Ebola (2014 | Bodily fluids | 1.5-2.5 |
R_{0}
High R0 = Good invader
Estimating
R_{0}
R_{0}
: # of secondary infections produced by a single infectious individual in an otherwise fully susceptible population
=> look at growth during BEGINNING of epidemic
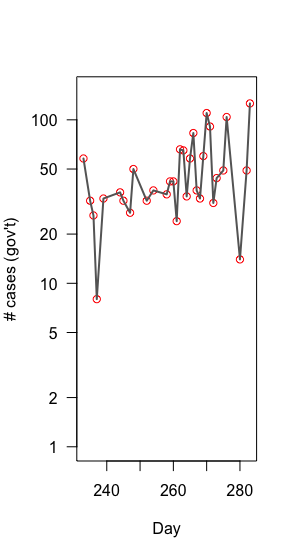
Max. # cases
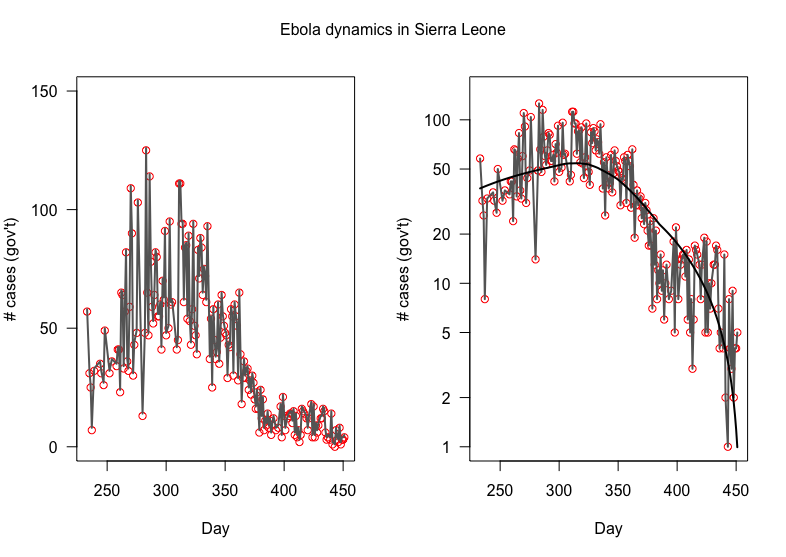
2014 Ebola dynamics in Sierra Leone
Population growth
is multiplicative, not additive
=> LOG!!
Max. # cases
Max. # cases
New Cases!!
(NOT cumulative)
"Exponential" growth
(\text{``}R_{0}\text{"})
Coefficients:
                Estimate Std. Error t value Pr(>|t|)
(Intercept)    -185.1590    79.8263  -2.320   0.0274 *
sl.early$Date3    0.9013     0.3068   2.938   0.0063 **
\hat{R_{0}} = \frac{\text{growth
rate}}{\text{recovery rate}} + 1
\text{set }\gamma = 5.6 \text{ from similar strain in the Congo, 1995}
\hat{R_{0}} = \frac{0.90}{5.6} + 1
= 1.16
Growth rate: slope of linear model of log(new cases) ~ day
Goal of management is to drive R below 1
= \frac{\text{slope}}{\gamma} + 1
Persistence or Fade-out
Model equilibria
Option 1: Pathogen goes extinct (I* = 0)
Option 2: Static persistence (I* = k)
Option 3: Stable cycles
Pathogens fade-out when they run out of Susceptible hosts.
1. Transmission is much faster than births
2. Hosts artificially move from S to R
Critical Community Size
Minimum population size in which a host-specific agent can persist indefinitely
Does not exist for frequency-dependent diseases
For measles, ~300,000 people
Depends on population turnover and transmission rate
Herd immunity
Calculation
Pop is p% Immune and (1-p)% Susceptible
When a high-enough proportion of population is immune so that R0 <= 1 and transmission stops
R_{0} \times (1-p) = 1
For an epidemic to take off,
R_{0}\times S = 1
\rightarrow (1-p) = \frac{1}{R_{0}}
\rightarrow p_{c} = 1-\frac{1}{R_{0}}
Goal for vaccination.
Measles herd immunity
p_{c} = 1-\frac{1}{18} = 1-0.055 = .945
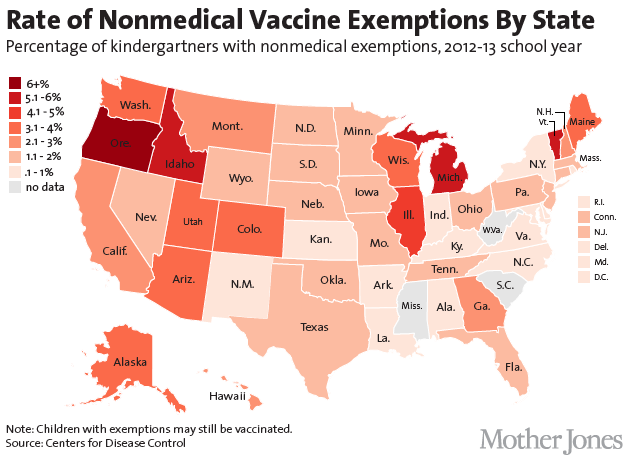
Lower vaccination rates required for less-infectious agents
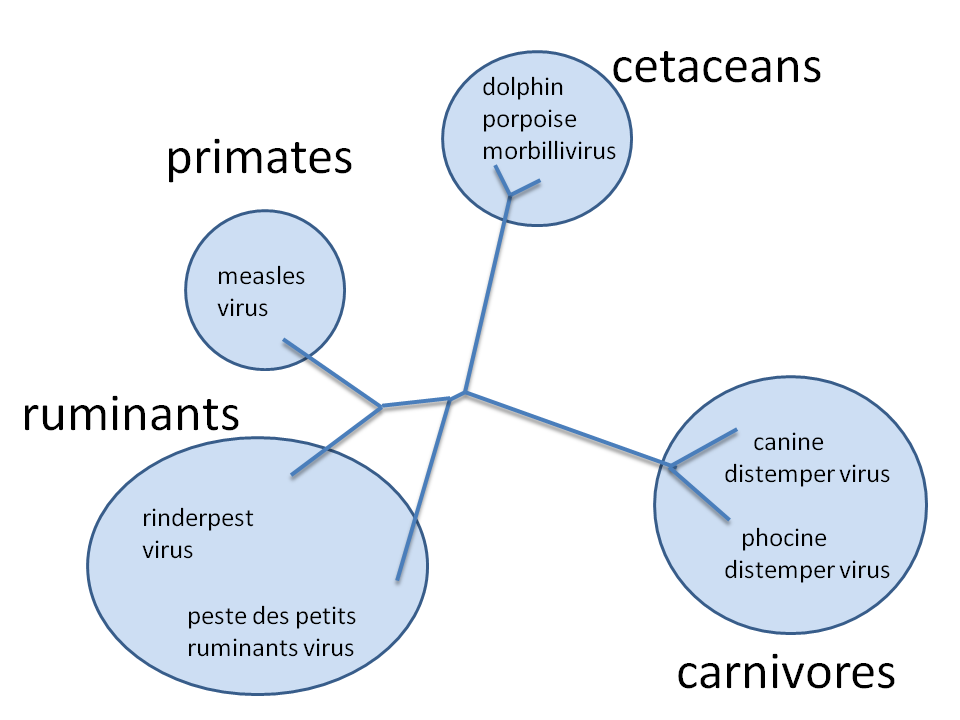
Strategies for persistence
Transmission
Virulence
Multi-host persistence
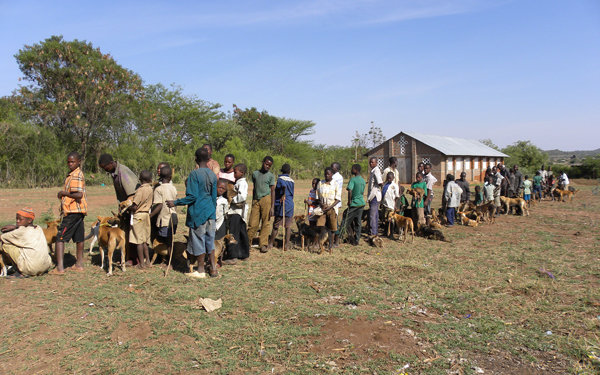
Canine Distemper Virus
(Morbillivirus)


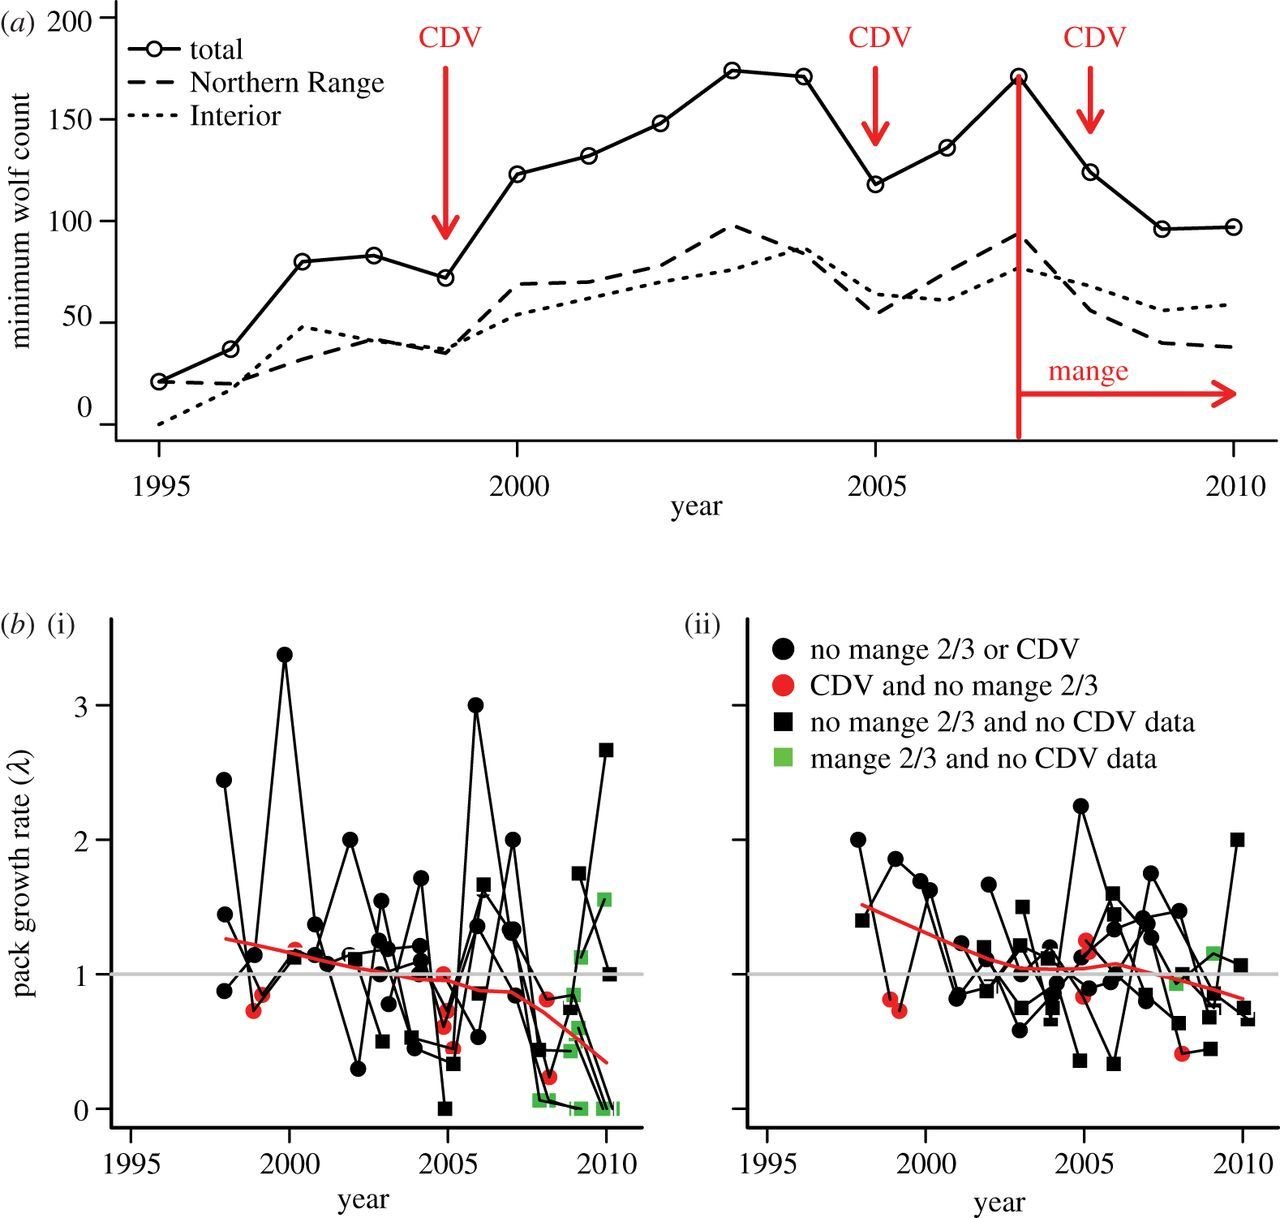
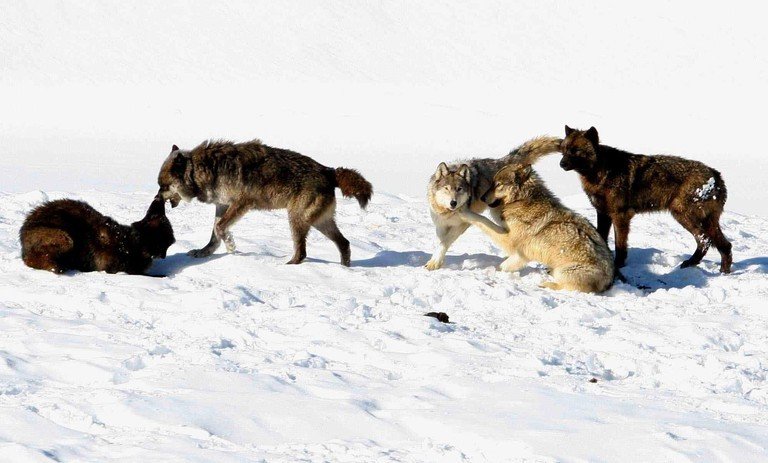
Canine Distemper Virus Persistence??
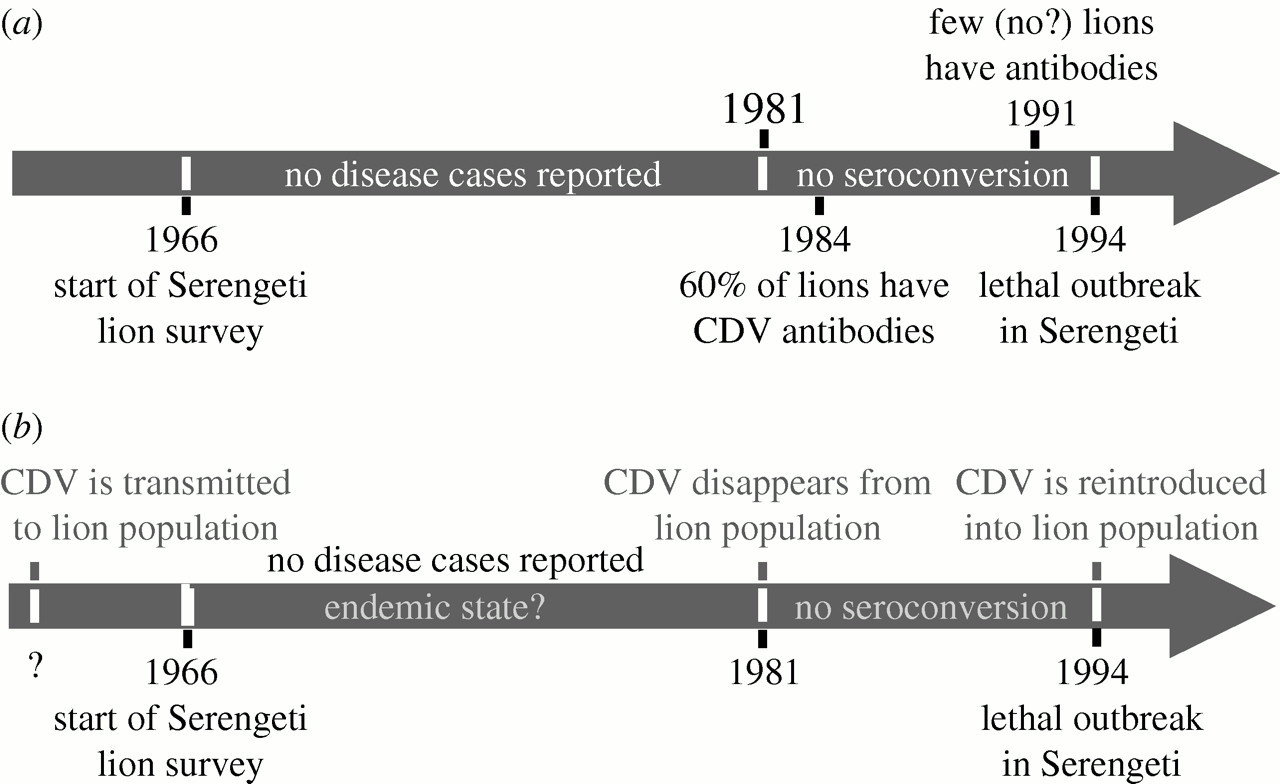
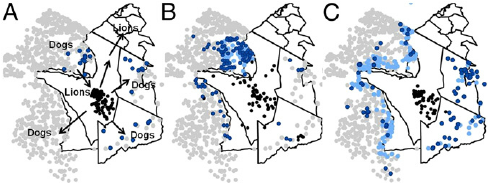
1994
1996-2002
2003-2012
Rabies
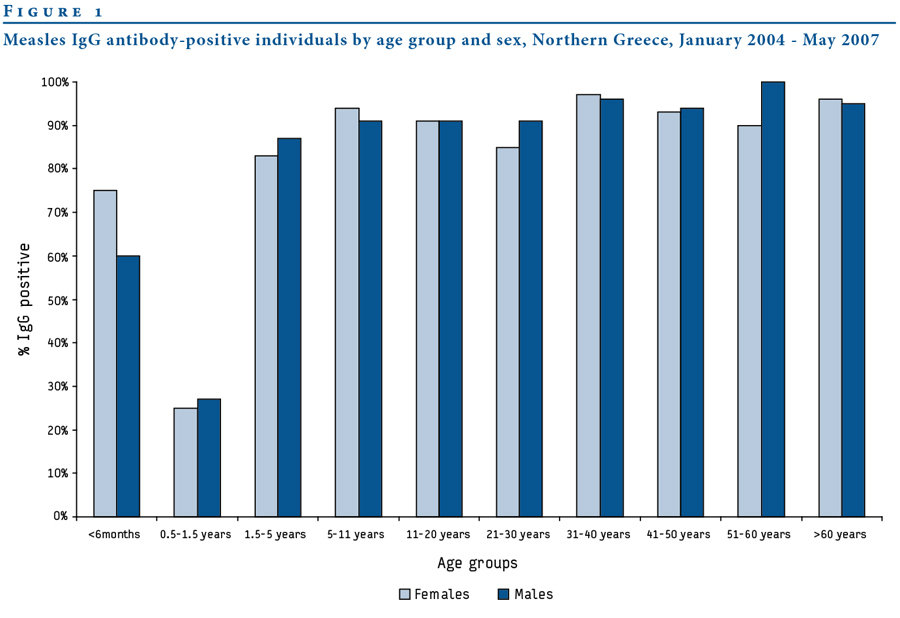
Age-Seroprevalence
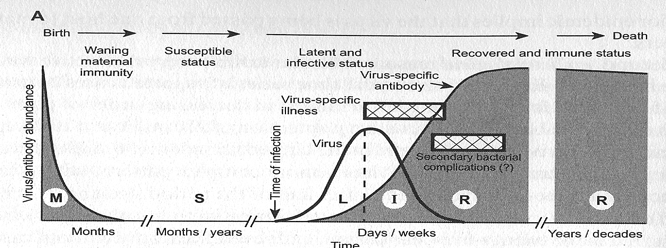
"Ways" to be seropositive
1. Acquired immune response after infection
Antibodies can't have "waned" yet
2. Antibodies acquired through passive transfer
Antibody titers wane exponentially following birth
Acquired through infection or vaccination
Passive immunity
Density- vs. Frequency-dependence
How does transmission rate scale with population density?
Frequency-dependent
Density-dependent
Transmission term =
\beta SI
Transmission term =
\frac{\beta SI}{N}
Take S, I, R to be Proportions
(S + I + R = 1)
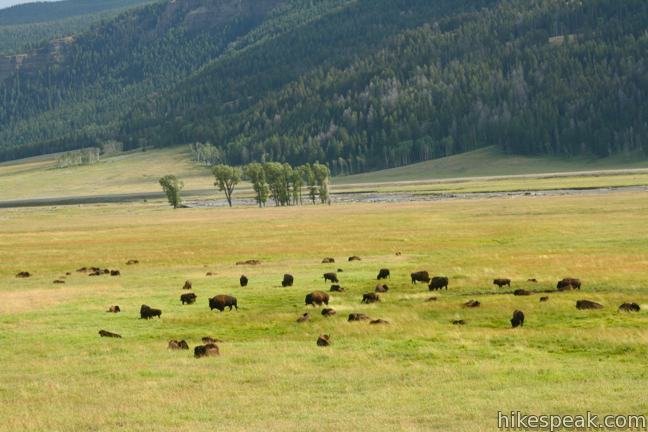
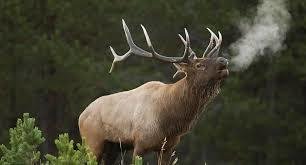
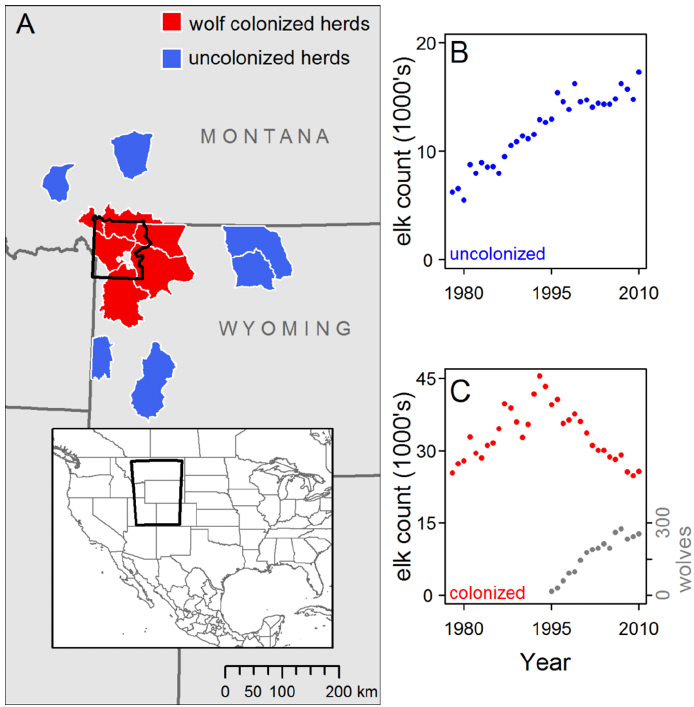
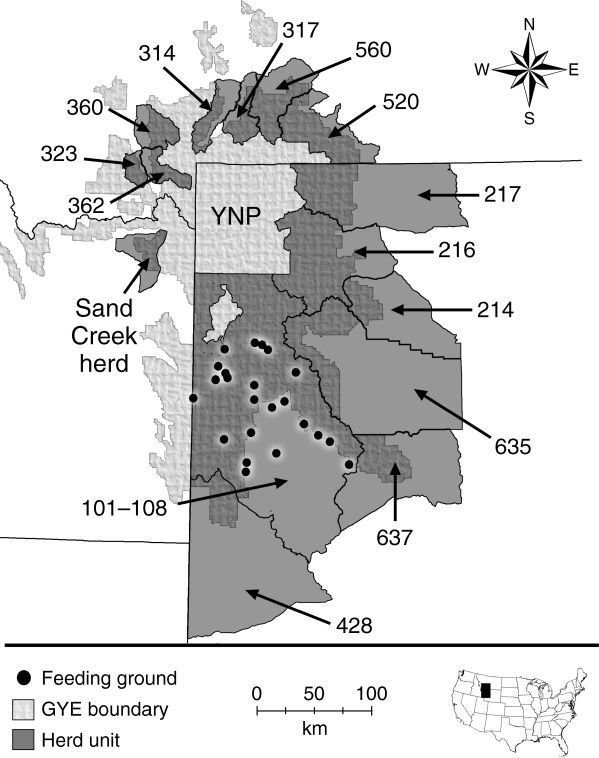
Brucellosis
Brucella abortus
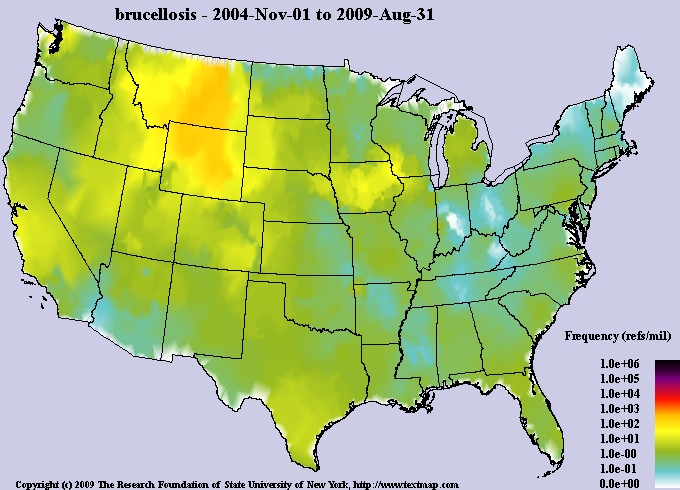
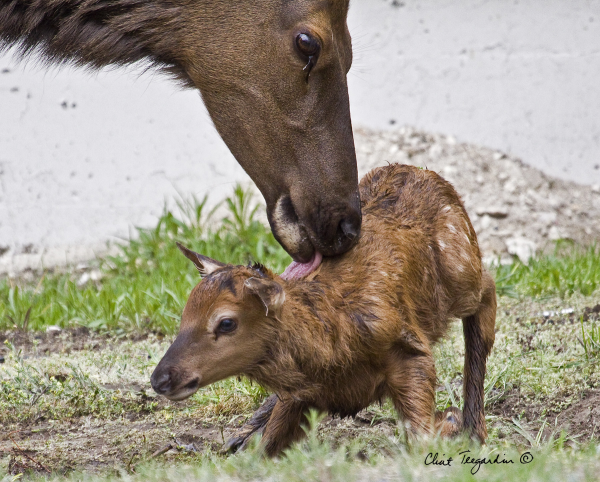
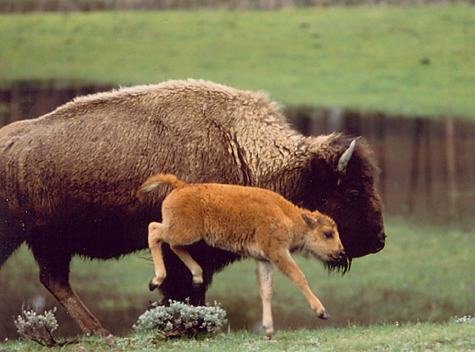
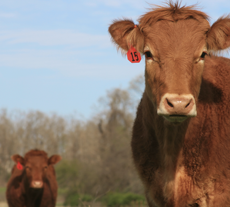
Elk
Bison
Cattle
=$$
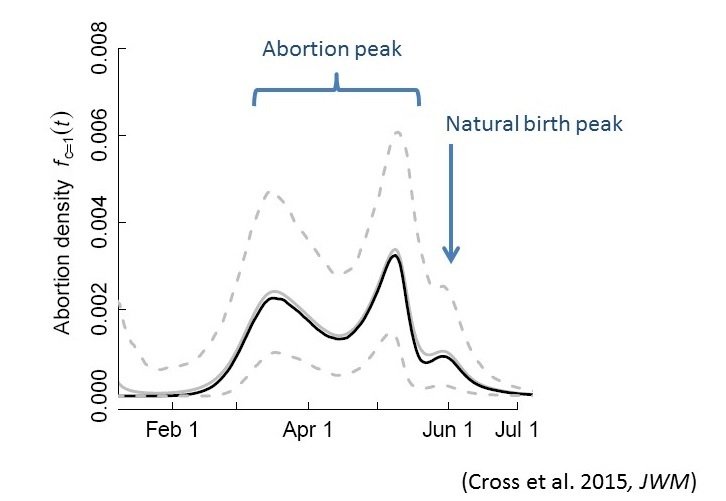
Brucellosis
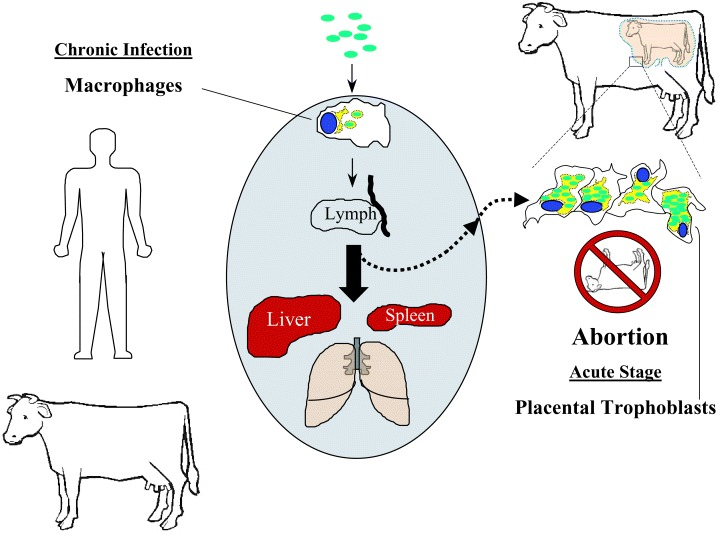
Transmission is 1) through abortion events
2) sexual
Brucellosis
Movement

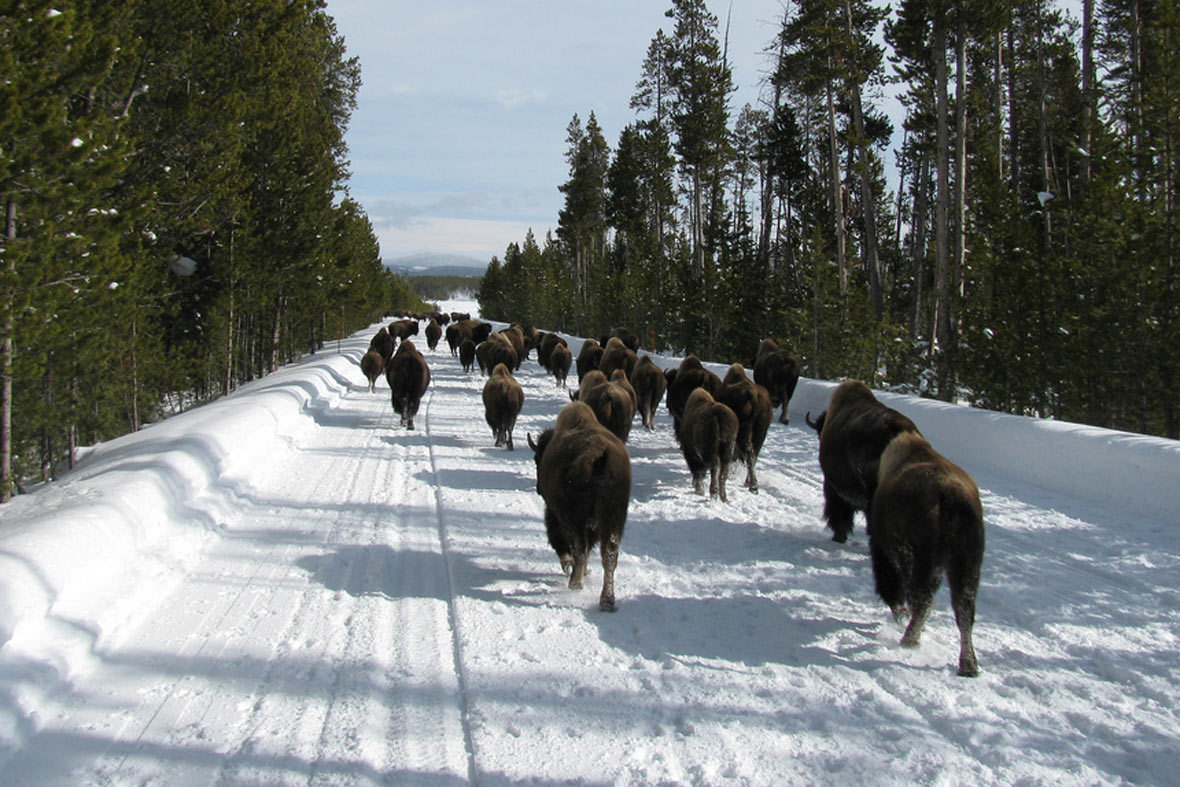
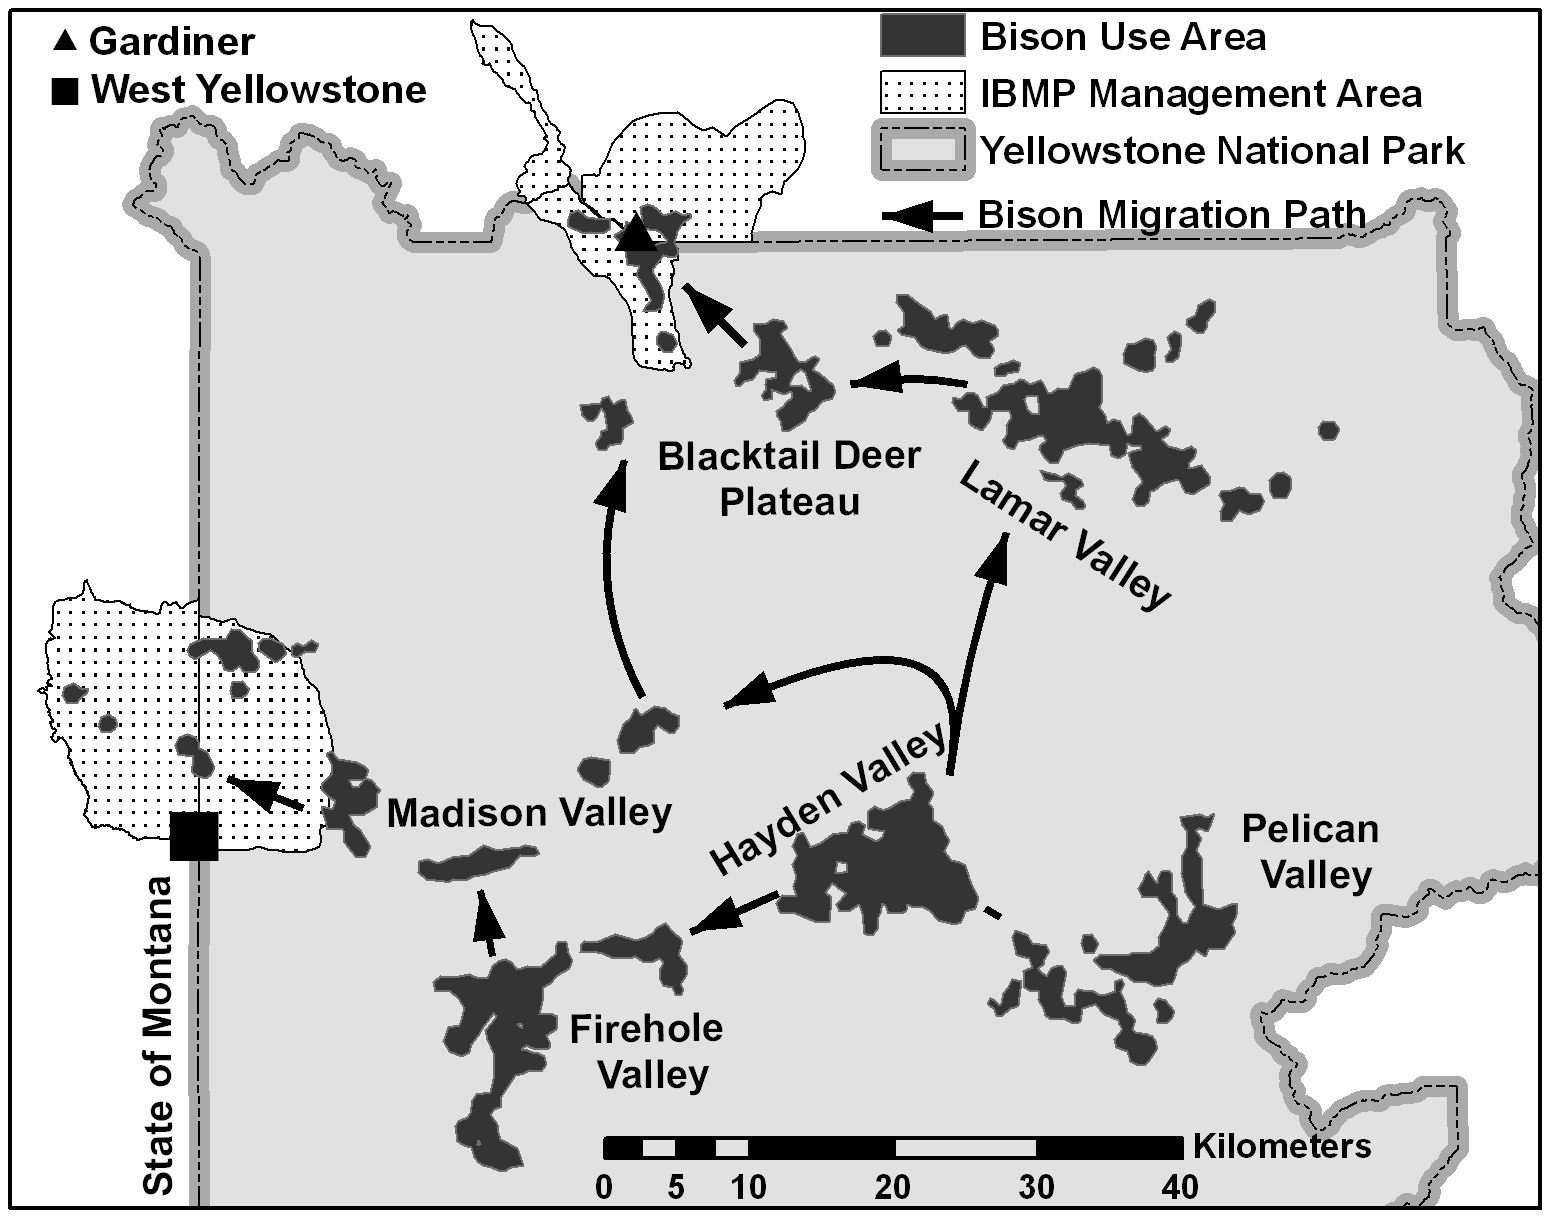
Brucellosis
Movement
FD vs. DD transmission
Mode of transmission
Movement patterns
Spatial scale
Transmission often DD at fine-enough scale
- elk on a feedground
- bighorn sheep in a ewe-group
At a coarser scale, transmission "looks" more FD
Disease and Food
Supplemental Feeding

Elk on Wyoming feedgrounds
Flying fox camp in urban Australia
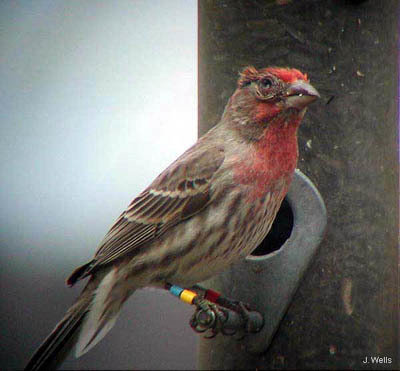
House finch with conjunctivitis
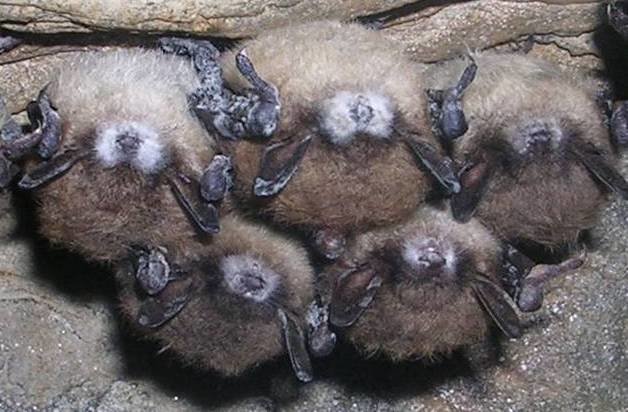
Bioenergetic diseases
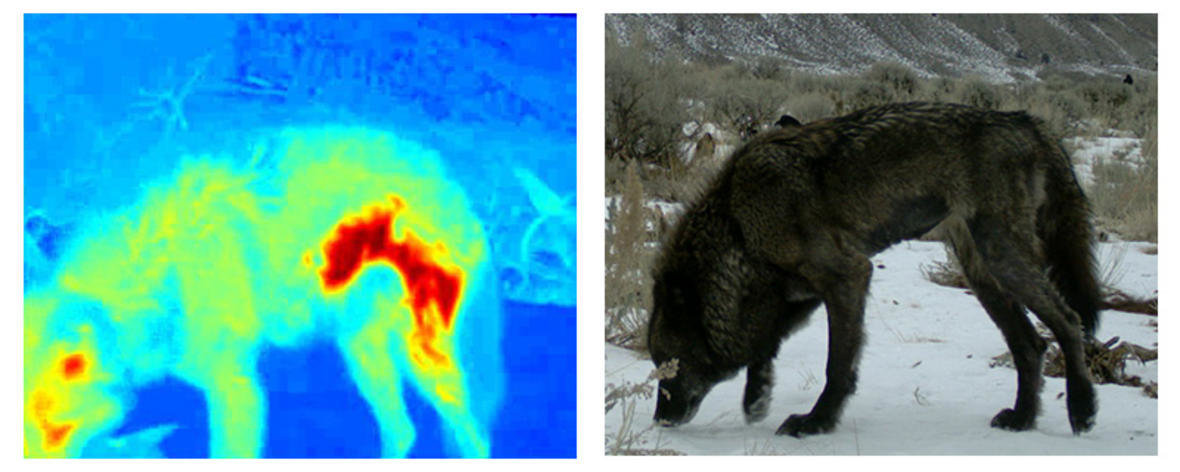
Caloric costs of heat loss due to mange
Caloric costs of arousal bouts for bats with White Nose Syndrome
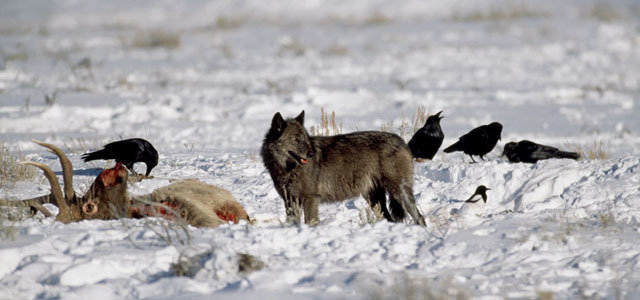
Predators and "Healthy Herds"
Predators consume sickest prey
Reduces overall transmission rate
=> Prey pop size INCREASES with predator introduction
Two Evolutionary Hypotheses
What sort of relationship should pathogens seek with their hosts?
H1: Evolution toward avirulence
Epidemic number
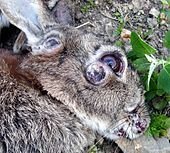
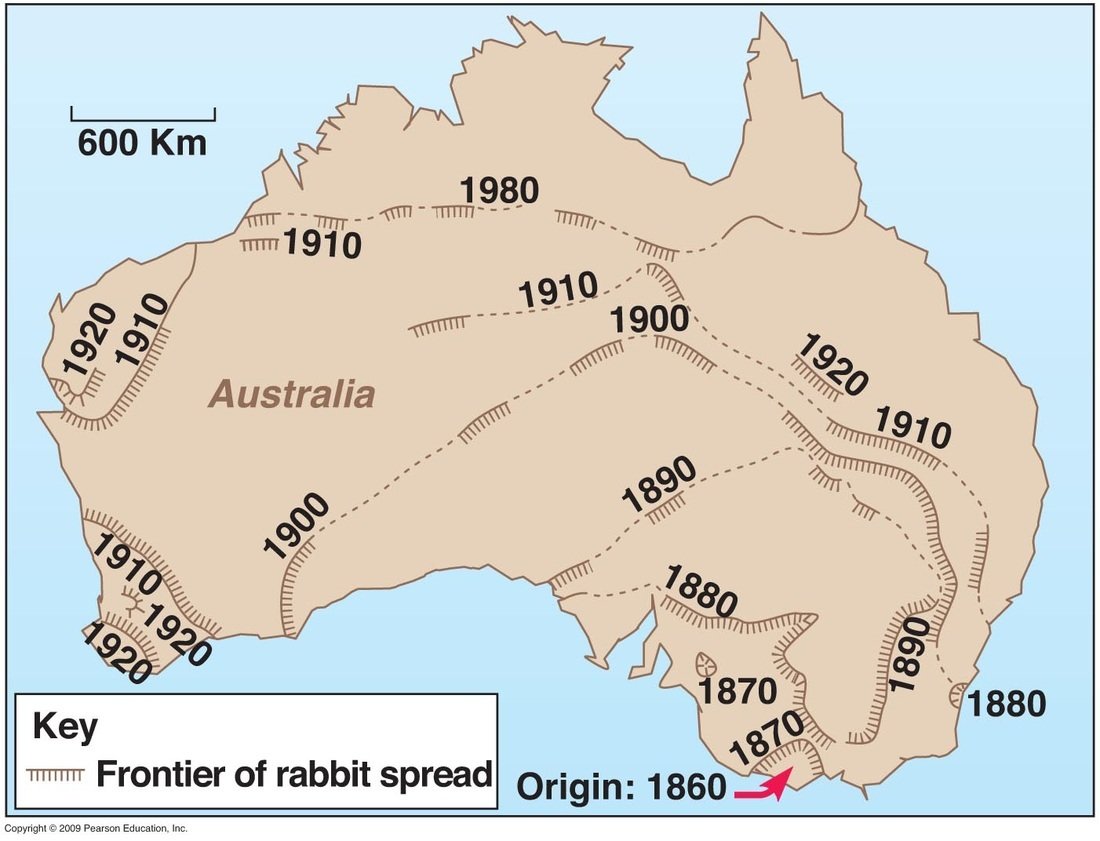
Rabbits and Myxoma

Worst strains decline through time
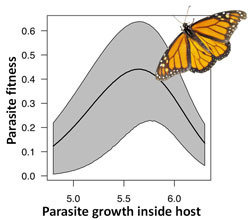
H2: Virulence-Transmission Trade-off
Pathogen needs large-enough population to transmit...
... but too high a pathogen load can kill the host
Pathogen population size
P(Transmits to a new host)
Not enough pathogen to produce infectious dose
So much pathogen host dies before transmitting
Optimal load
Virulence-Transmission in a protozoan parasite of the Monarch
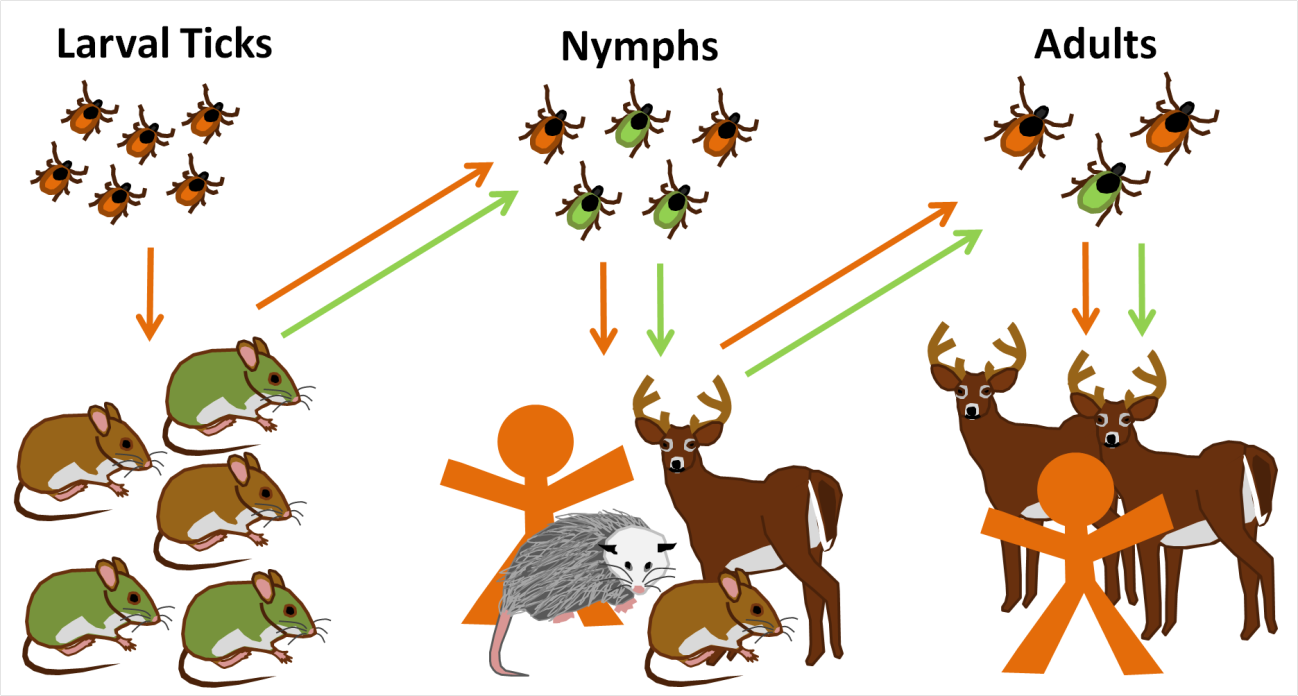
Dilution or Amplification
How does biodiversity relate to disease risk?
Lyme disease (Borrelia Burgdorferi)
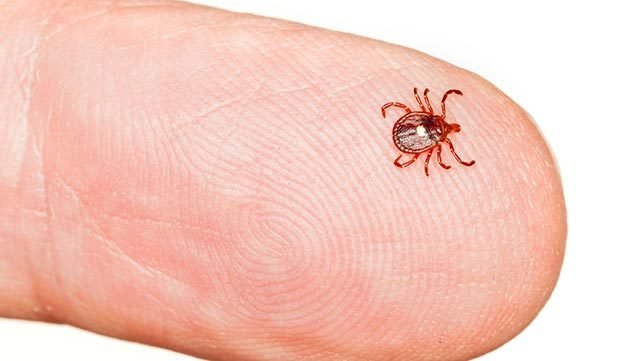
Ixodes scapularis (deer tick)
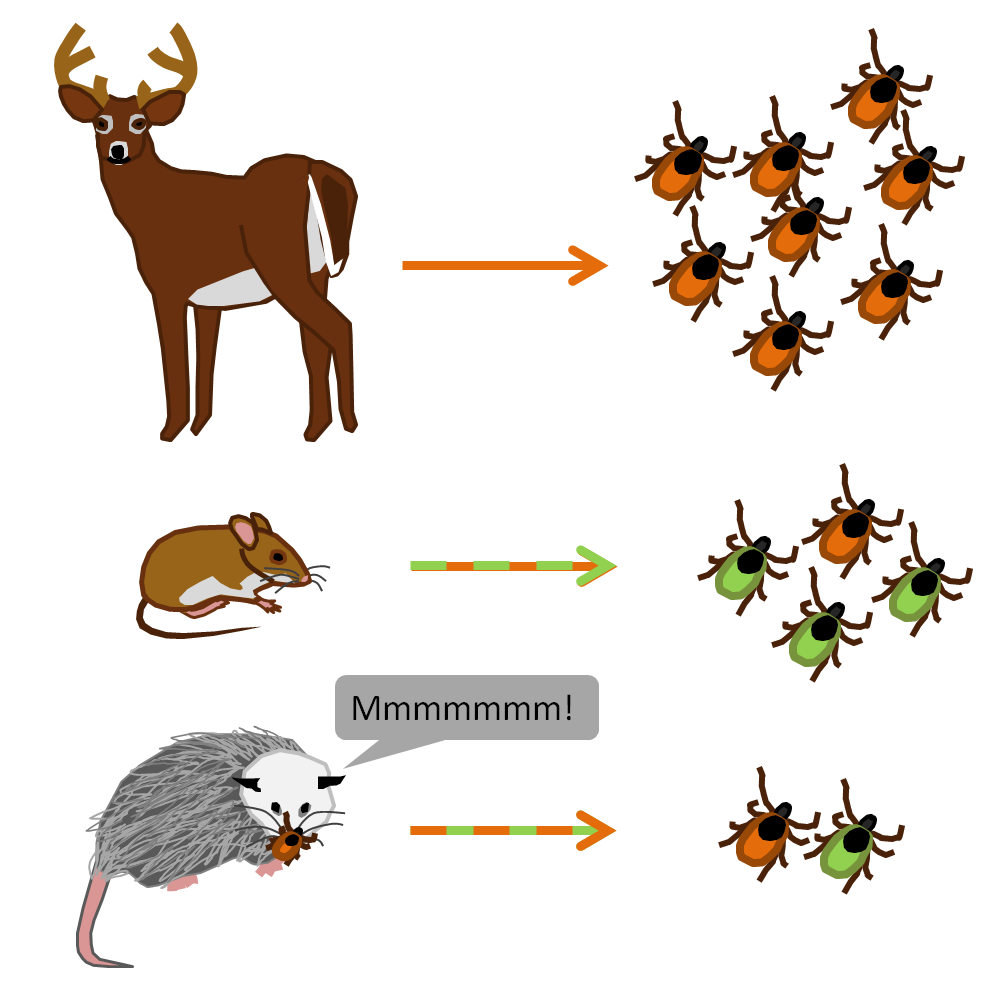
Different hosts for different instars
Host spp. vary in "competence"
When biodiversity is high, fewer
I. scapularis feed on "competent" hosts
parasiteecology.wordpress.com
parasiteecology.wordpress.com
Cross-scale questions
Vacated Niches and Pathogen Emergence
Smallpox and Monkeypox
Orthopox viruses of primates
Some cross-immunity
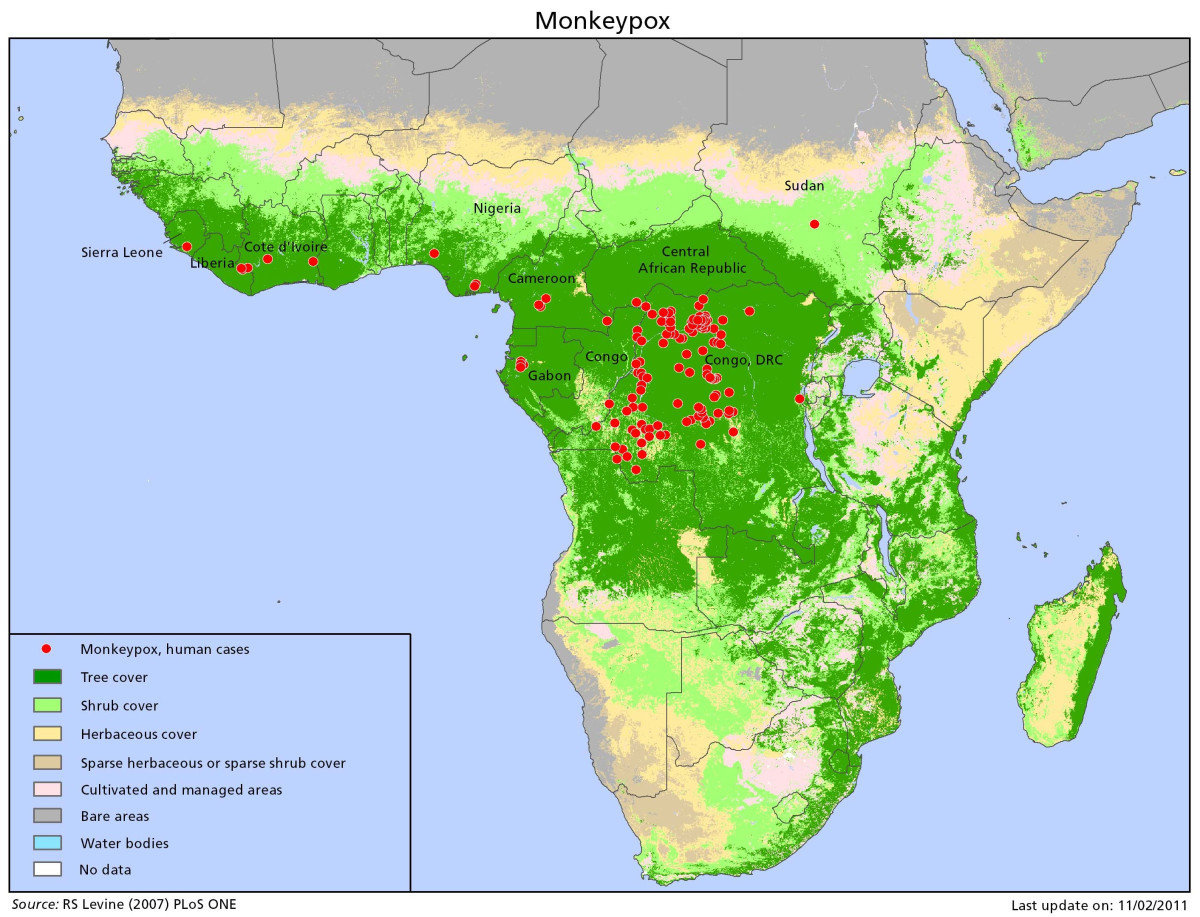
Smallpox declared eradicated 1979
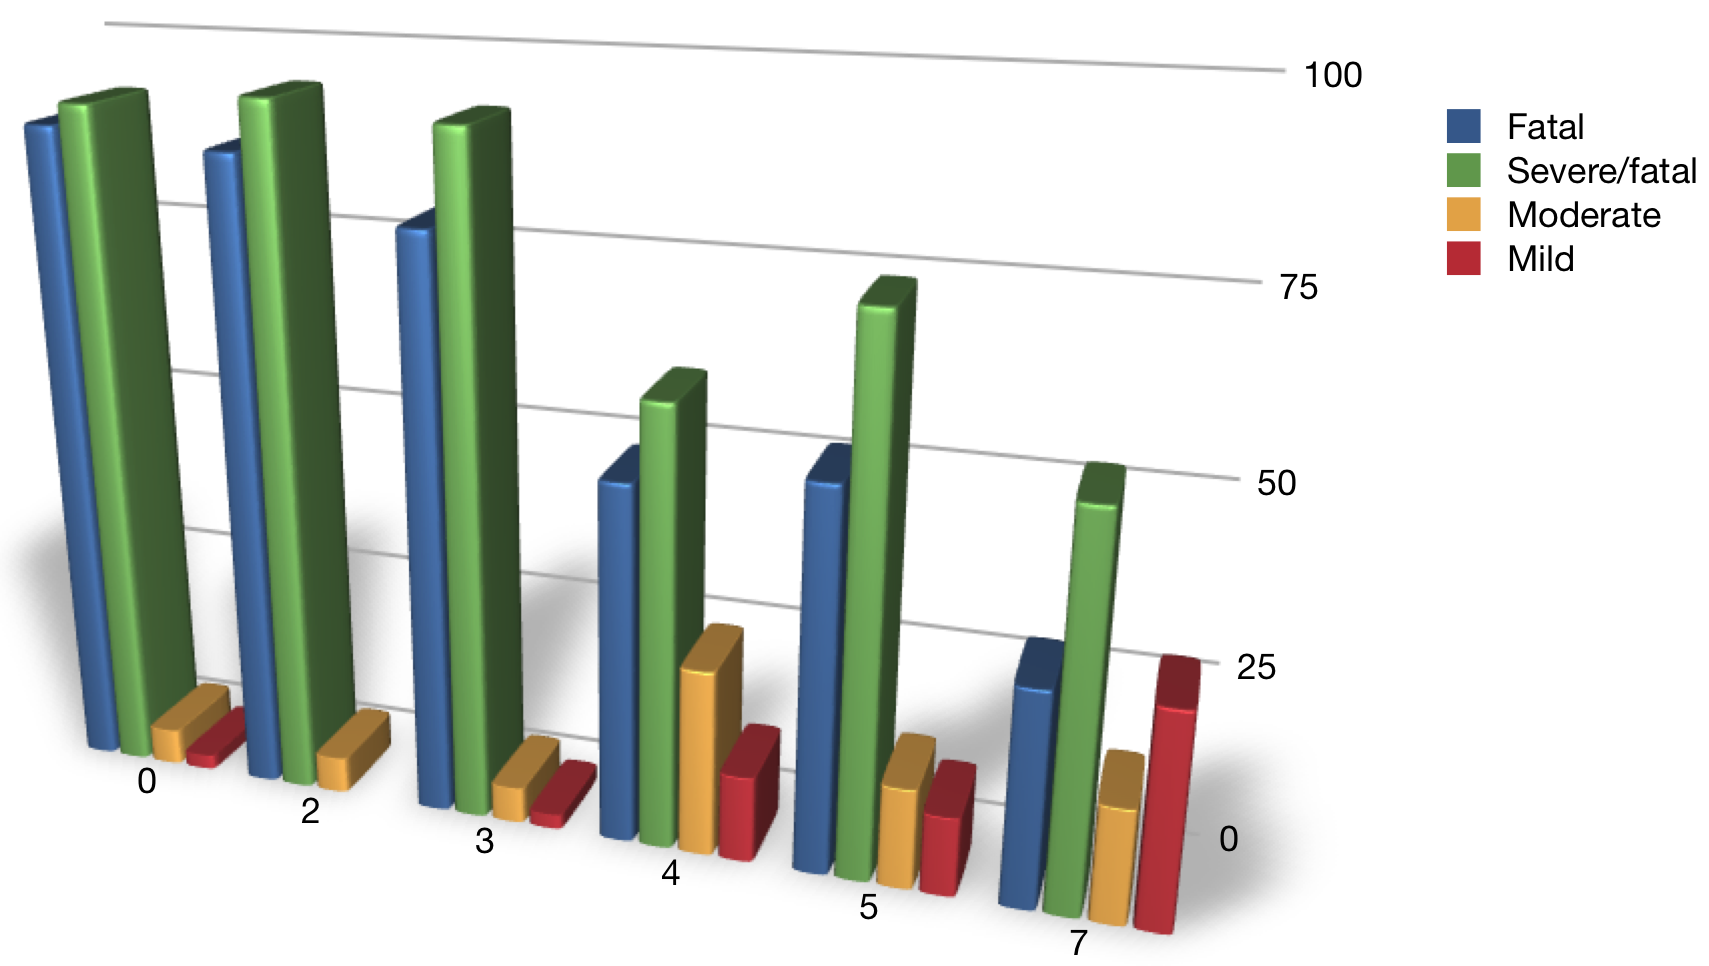
Variola case-fatality rate = 30%
Monkeypox case-fatality rate = 1-10%
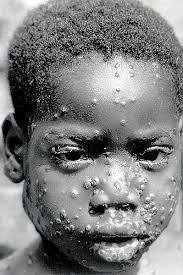
Monkeypox case, DRC, 1986
Smallpox and Monkeypox
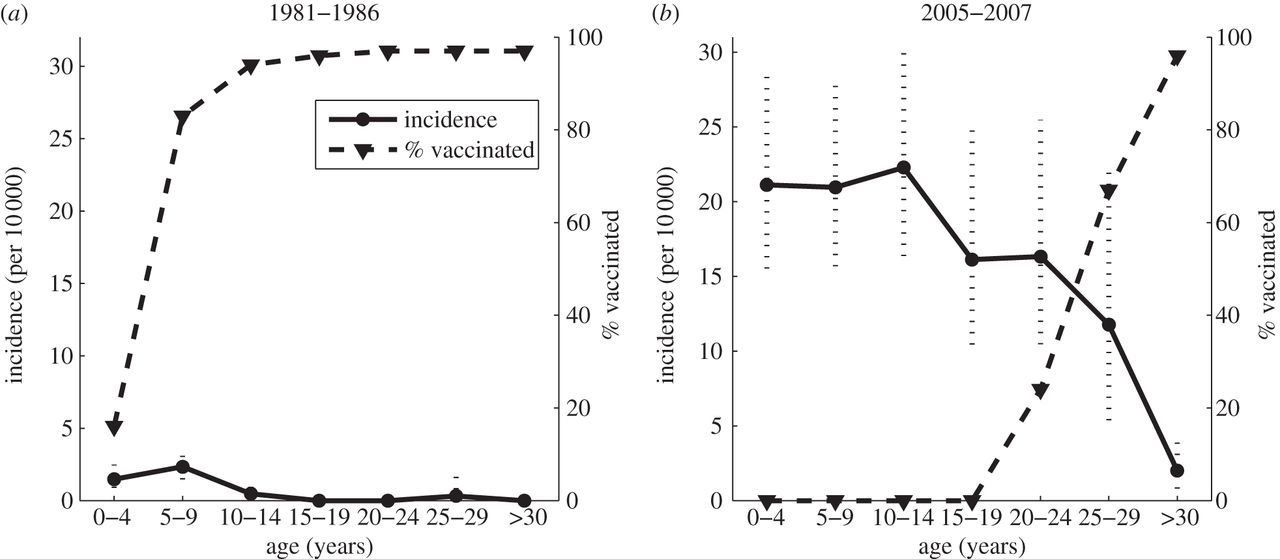
Lloyd-Smith, Phil. Trans., 2013
Did smallpox eradication leave a "vacated" niche for monkeypox to invade?
Transmission structures
By Kezia Manlove


