Identifying strongly lensed Supernova type Ia in the Rubin lsst data
Prajakta Mane
MS19054
PRJ501 Thesis Presentation
Nov. 29, 2023
Supervisors:
Dr. Surhud More, Dr. Anupreeta More
IUCAA, Pune
Local Supervisor:
Prof. Jasjeet Singh Bagla
Vera Rubin Observatory and the LSST
- Primary mirror: 8.4 meters, field of view: 9.6 deg^2, entendue: 319 m^2 deg^2
- LSST: A survey of 20,000 deg^2 of the sky, six broad photometric bands, will image each region of the sky roughly 2000 times (1000 pairs of back-to-back 15-sec exposures) over a ten-year survey lifetime
- detect faint transient objects
- About 10 million supernovae in 10 years; a few hundreds of thousands expected to be type Ia
- About 300 lensed supernovae, about 1/3rd expected to be type Ia
- Will improve the current sample of ~7000 detected supernovae and ~10 detected lensed supernovae
Overview of the lensing theory
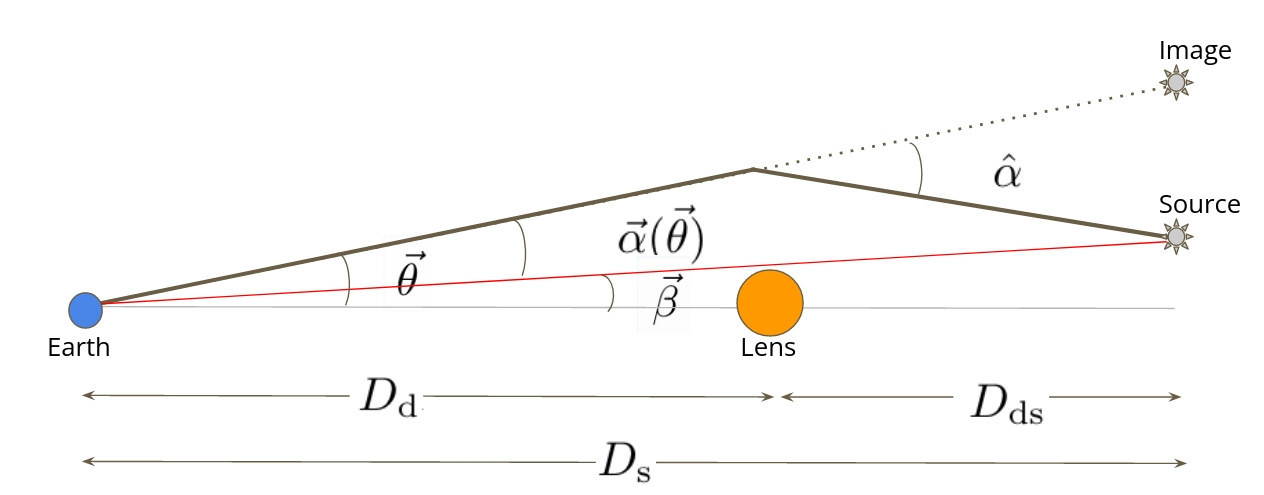
Important observables in strong Lensing
1. Image Positions
2. Magnification
3. Time Delay
Introduction to gravitational lensing I, Dr. Surhud More, ISSAA, 2022
\boldsymbol{\beta} = \boldsymbol{\theta} - \boldsymbol{{\alpha}}(\boldsymbol{\theta})
Image Positions:
\boldsymbol{{\alpha}}(\boldsymbol{\theta}) = \frac{D_{ds}}{D_s} \left[\frac{4G}{c^2}\int D^2_d d^2\boldsymbol{\theta'} \Sigma(D_d\boldsymbol{\theta'}) \frac{D_d (\boldsymbol{\theta}-\boldsymbol{\theta'})}{D^2_d |\boldsymbol{\theta}-\boldsymbol{\theta'}|^2}\right]
Magnification:
Treu, T., Suyu, S.H. & Marshall (2022)
M(\boldsymbol{\theta}) = |\mathcal{M}(\boldsymbol{\theta})| = \left|\frac{\partial\boldsymbol{\theta}}{\partial\boldsymbol{\beta}}\right|_{\boldsymbol{\theta}}
\mu = \det \mathcal{M} = \frac{\text{image brightness}}{\text{source brightness}} % = \frac{1}{(1-\kappa)^2 - |\gamma|^2}
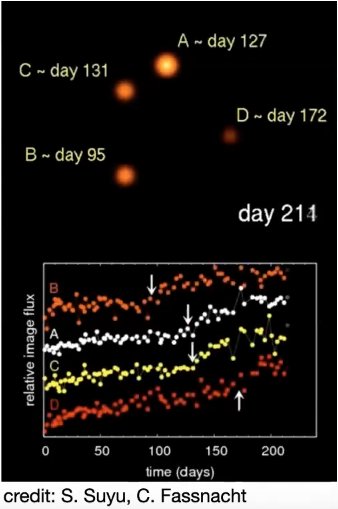
Time delay:
\Delta t = \frac{D_d D_s}{cD_{ds}} (1+z_l) \left(\frac{1}{2} (\boldsymbol{\theta} - \boldsymbol{\beta})^2 + \psi(\boldsymbol{\theta})\right) + \text{ constant}
t_{\text{geom}}
t_{\text{grav}}
Relative time-delay -> Hubble Constant
\frac{D_d D_s}{D_{ds}} = \frac{1}{H_0} f(z_s, z_l, \Omega_m, \Omega_\Lambda
)
\Delta t = \frac{D_d D_s}{cD_{ds}}(1+z_l)\Delta\tau \text{+ constant}
well measured time delays and projected gravitational potential and reshift of source
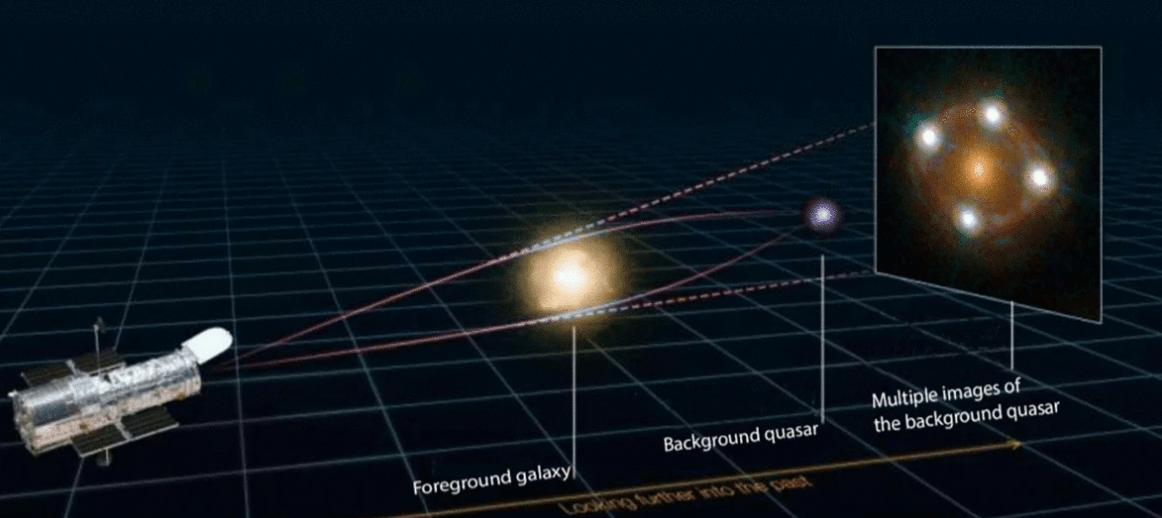
why strongly lensed Supernova type ia?
Time delays: transient
Structure of lens galaxy: transient -> help overcome degeneracies
Magnification: standard candle -> help overcome degeneracies
More accurate measurements of:
Goals and analysis steps
Two-folds goal:
To construct and test a difference imaging pipeline within LSST Stack to identify strongly lensed multiply imaged supernovae
To study the outliers in the color-magnitude space for supernovae to devise an early-detection criterion for SL SNIa
Analysis Steps
Data reduction and lensed supernovae lightcurve simulation
Injecting simulated information in the reduced data
Difference imaging, source detection and measurement
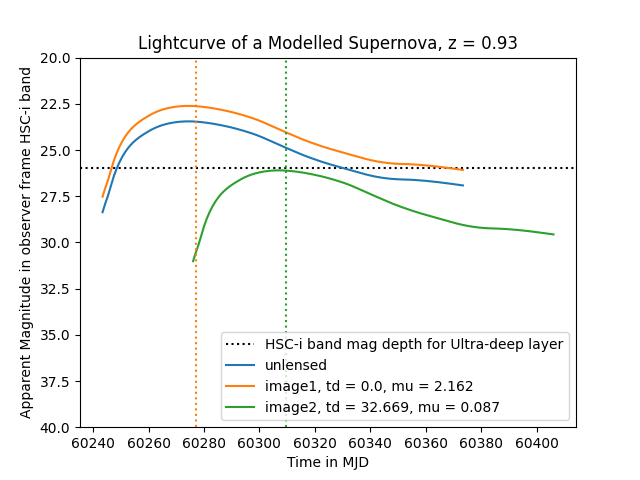
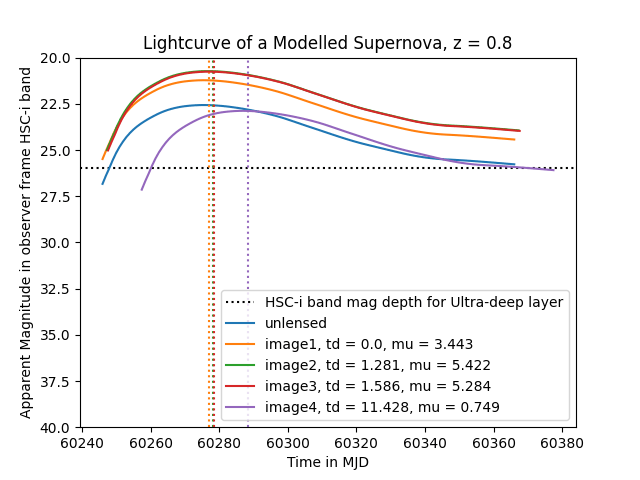
Lensed and unlensed supernovae lightcurve simulation
Color-magnitude analysis
Comparison with observed lensed and unlensed SNIa data and statistical analysis
Followup
observations
Actual observations
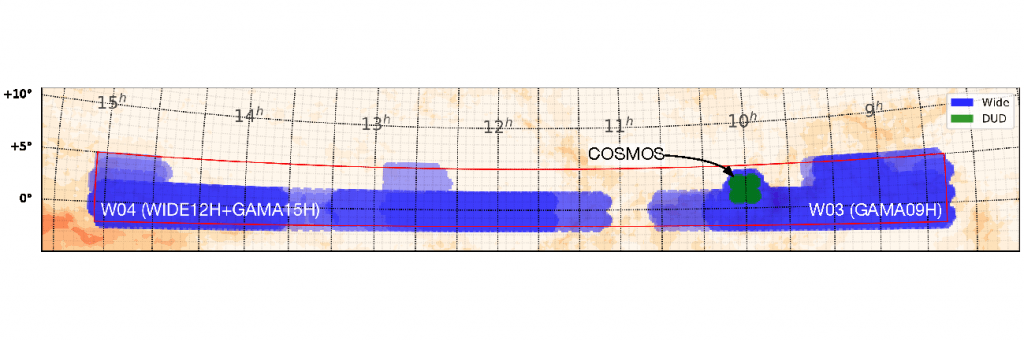
Data reduction
Subaru Hyper-Suprime Cam (HSC) Public Data Release 2
Deep-UltraDeep Survey's Cosmos region
Tract number 9813 (~1.7 deg wide)
149 visits in 5 optical bands from 10 nights in 2014 and 2015
A total of 16688 CCD images processed

Where does the testing data come from:
The other part of data comes from simulations!
Aihara et al., 2019
LSST Science Pipeline w_2022_12
Analysis performed on IUCAA's HPC cluster by setting up an HTCondor system on the default PBS
Data reduction steps:
Raw images
This is followed by fake SL SNIa injection and the DIA
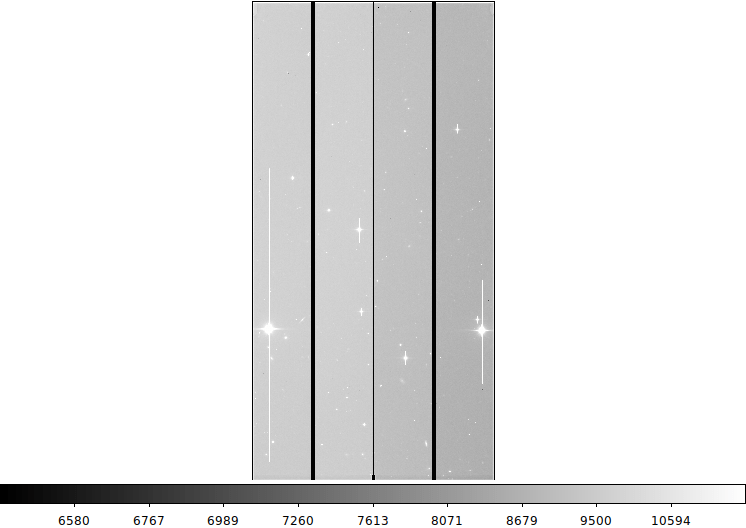
Removal of instrumental signatures, bias, dark and flat corrections
Source detection, joint astrometric and photometric calibrations (across multiple visits), warp calibrated exposures onto a common projection
Coadd exposures, detect and merge sources observed in different bands, forced photometry on coadds, generate coadded templates
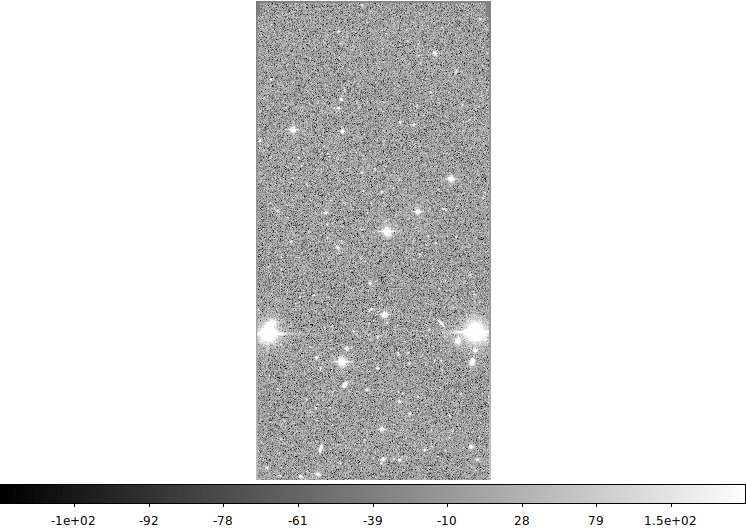
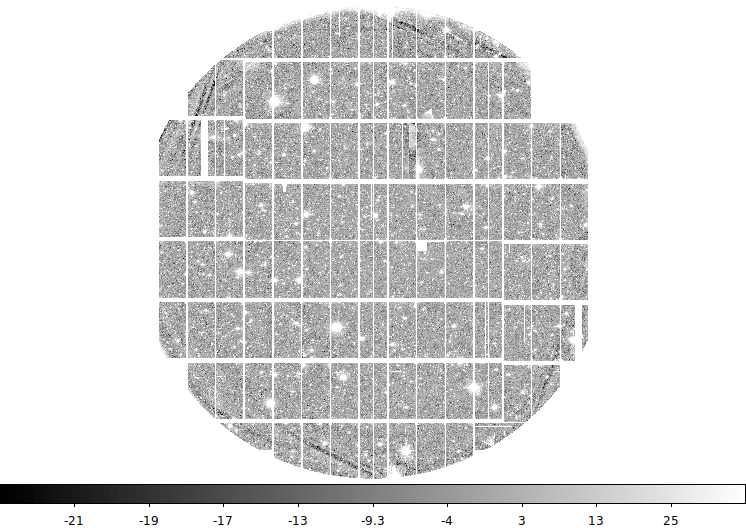
Data reduction process:
Step 1. Generating lensed supernova properties (positions, magnifications, and time delays for individual images) using a code adapted from More & More (2022)
Step 2. Simulating individual light curves of SNIa incorporating the strong lensing properties using SNCosmo
Fake SL SNIa simulation and injection
2 Steps in simulations:
Data reduction and the difference imaging pipeline
Selection criterion for injections: magnitude being injected of the fainter (or third faintest, for quad images) must be brighter than 26 mag
Total 2356 simulated systems of SL SNIa injected: 2267 doubly imaged, 89 quadruply imaged
Fake SL SNIa simulation and injection
Injections
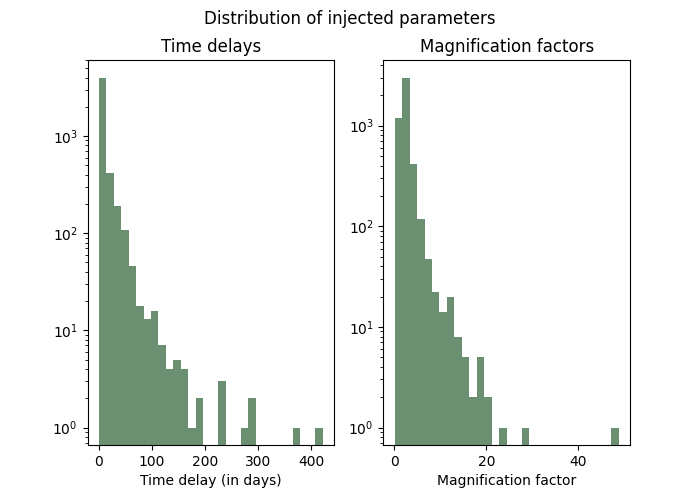
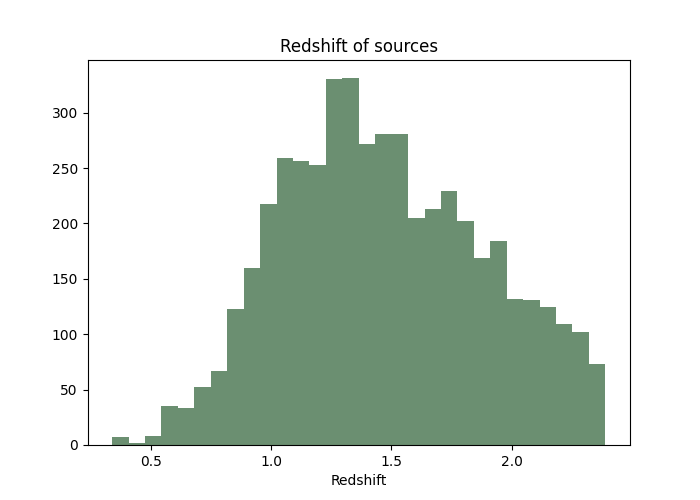
Distributions of injected supernova observables
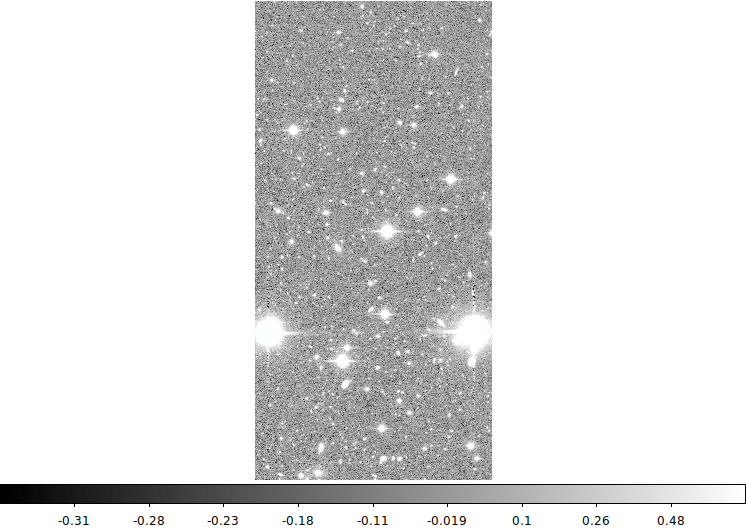
Data reduction and the difference imaging pipeline
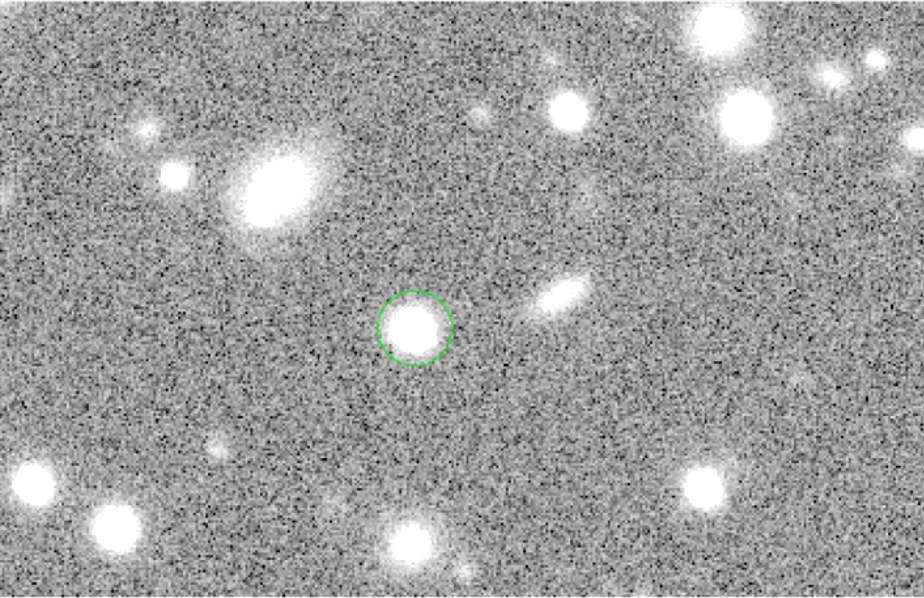
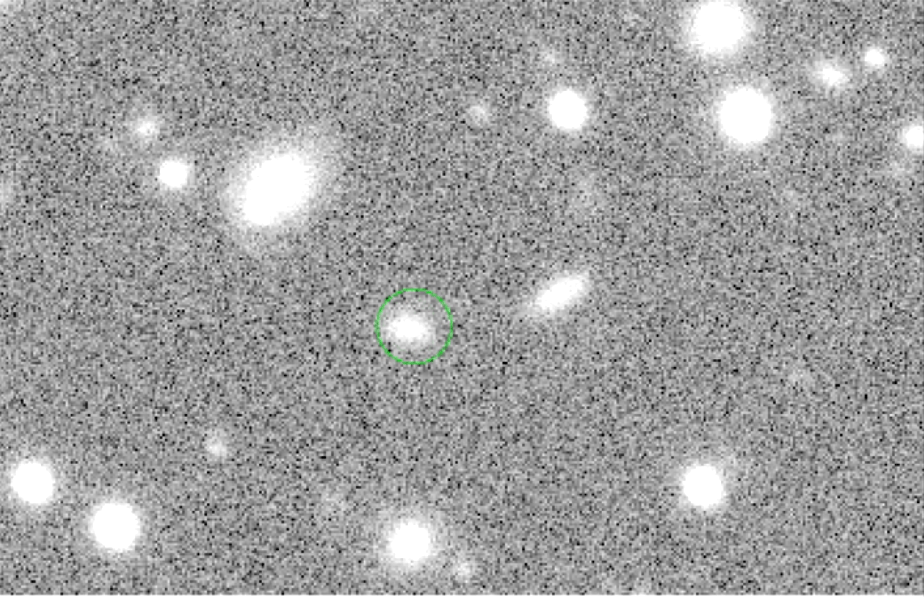
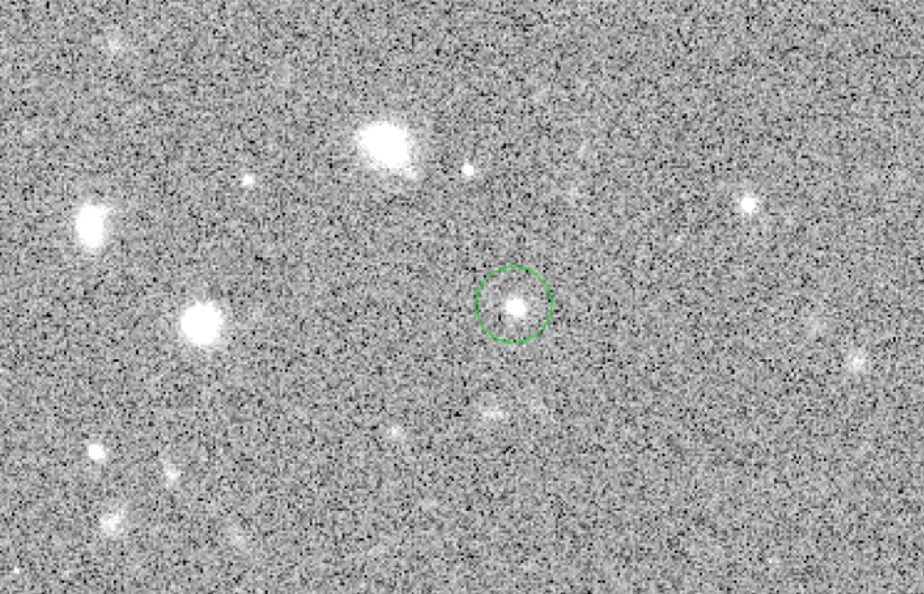
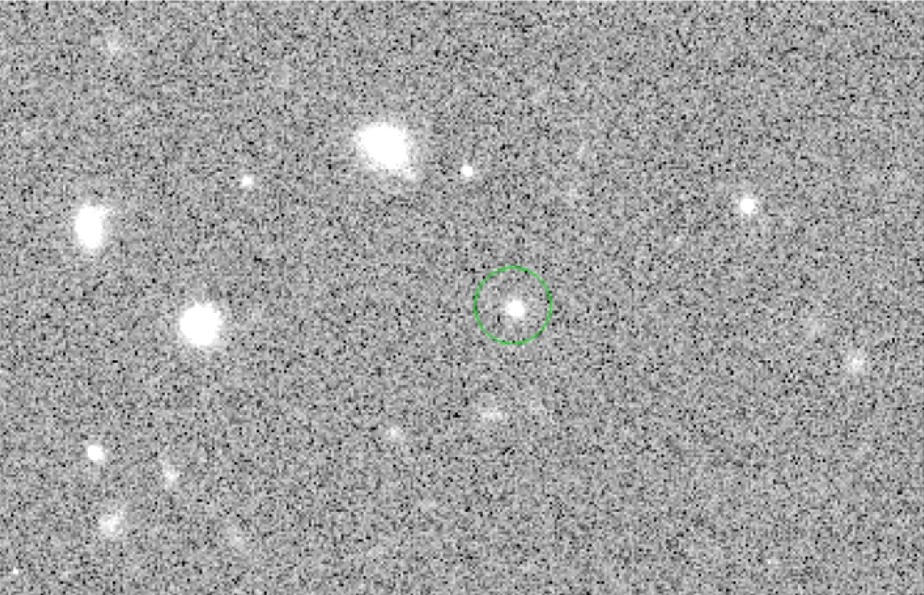
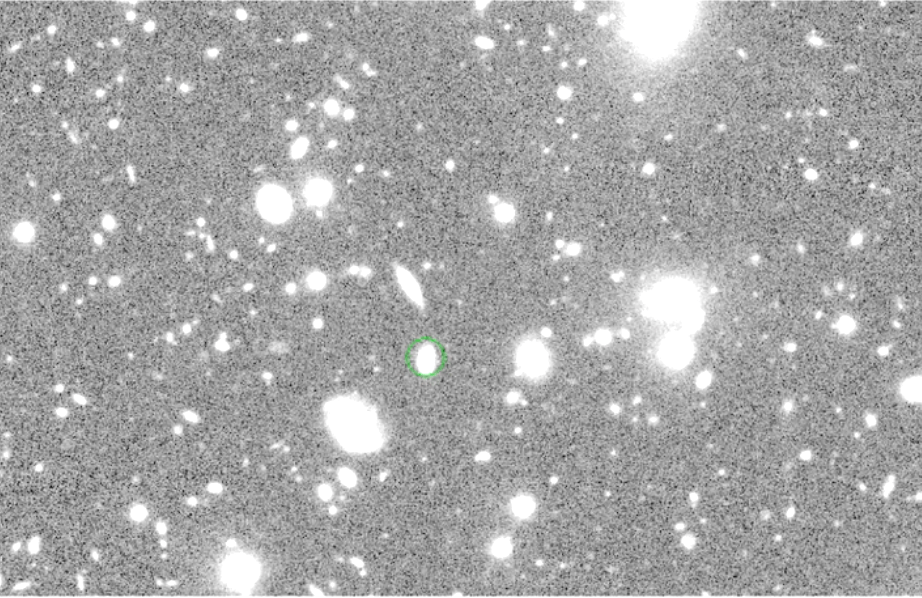
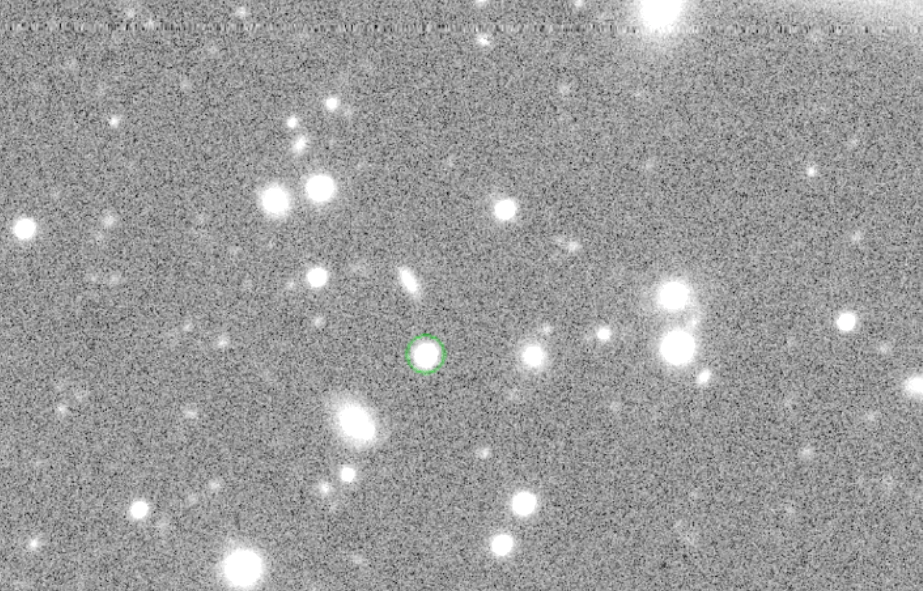
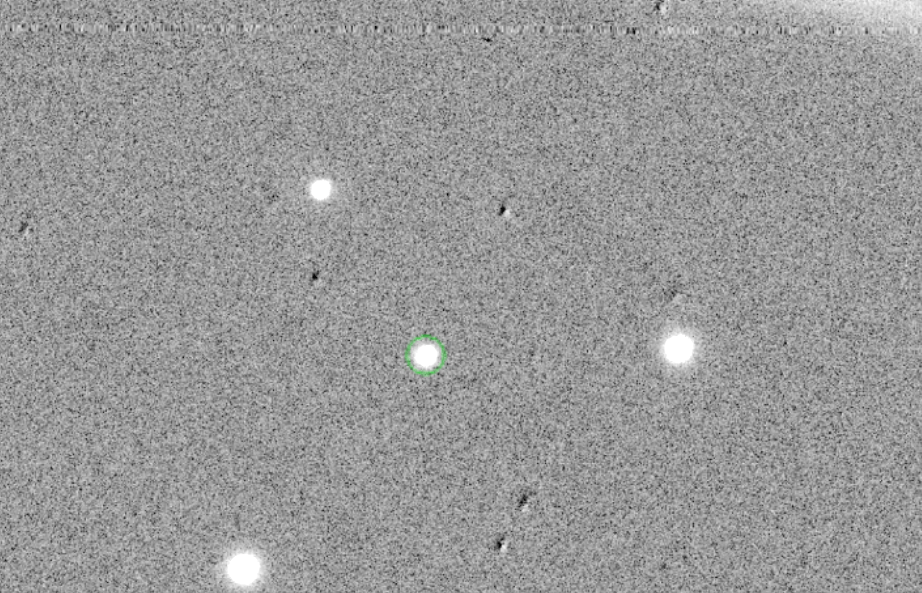
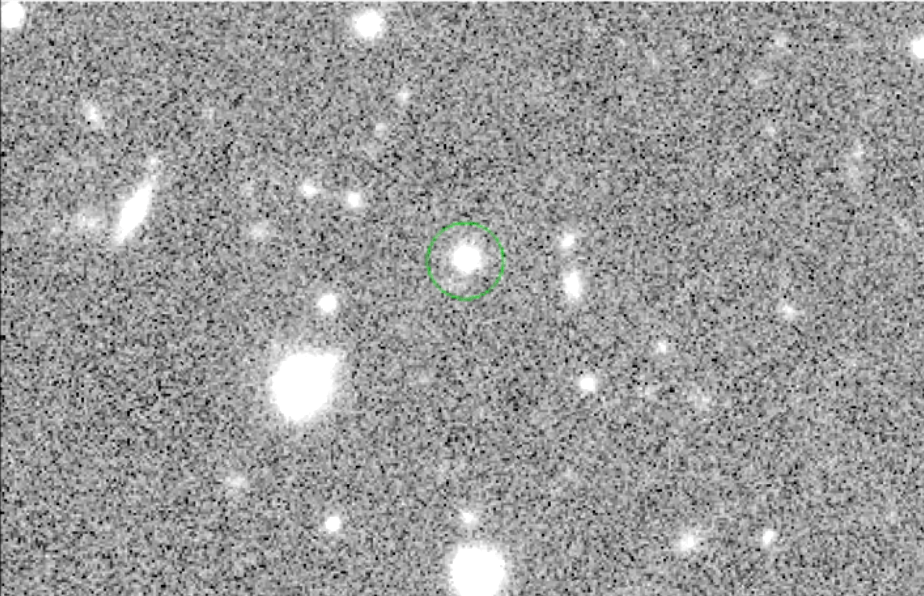
The difference imaging
But how to retrieve only the SNIa objects from these difference images?
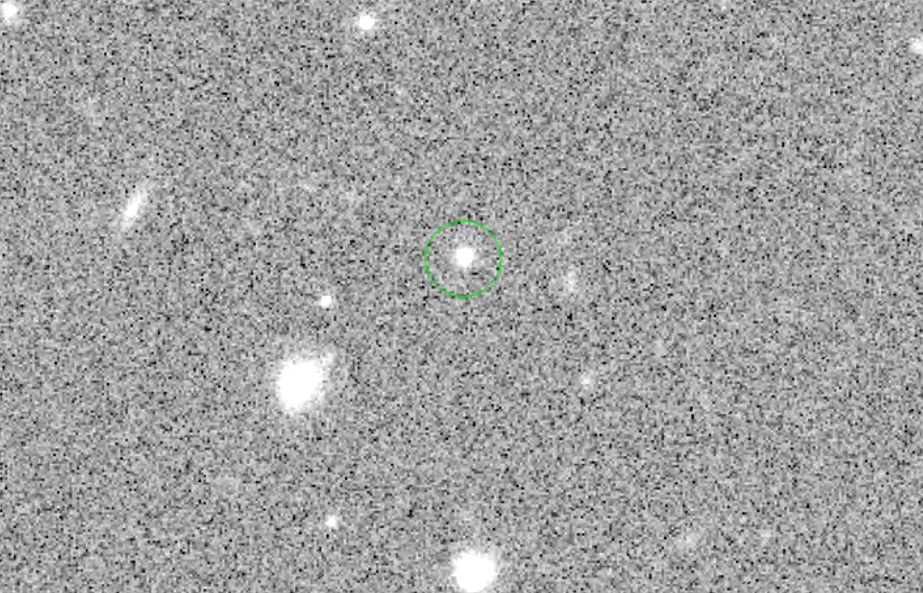

Quadruply imaged,
0.09", 0.16", 0.07"
19.62, 20,13, 20.58, 23.35
Doubly imaged,
0.2389"
22.95, 24.75
The color-magnitude analysis
Early-detection criterion to decide which SNIa to follow up
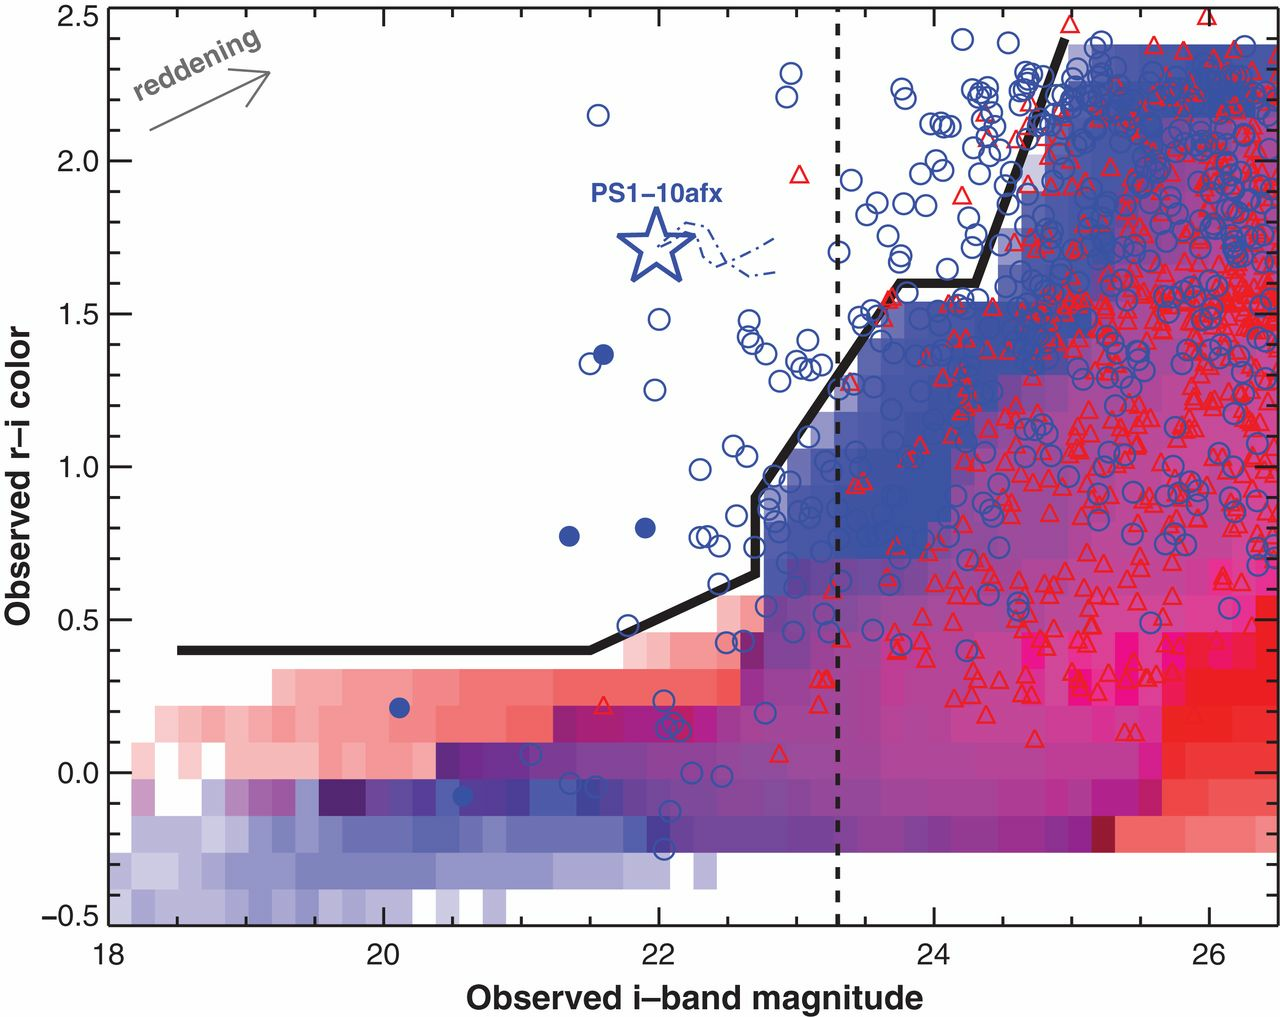
Quimby et al. 2014
: Unlensed SNIa
: Unlensed core collapse
: Lensed SNIa
: Lensed core collapse
The color-magnitude analysis
Preliminary Results
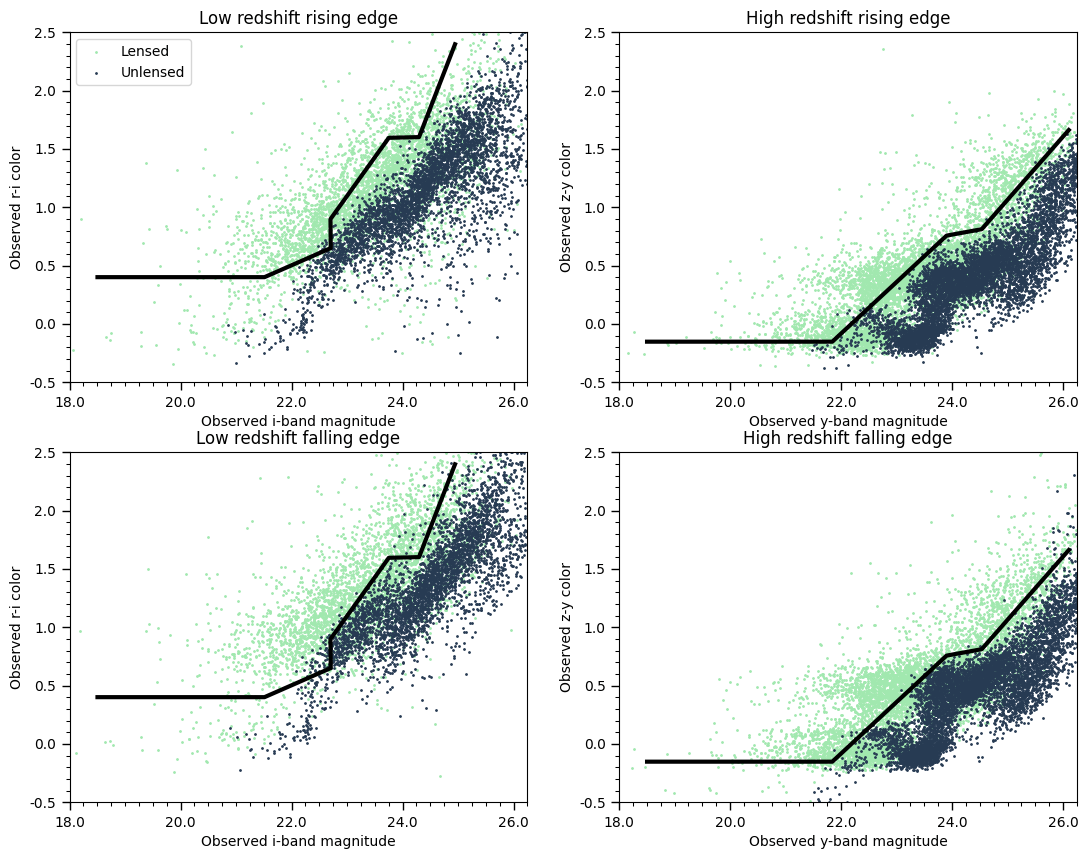
The simulated lensed population occupies a distinct color-mag space compared to the unlensed population
The color-magnitude analysis
Comparison with observed data of unlensed and lensed SNIa
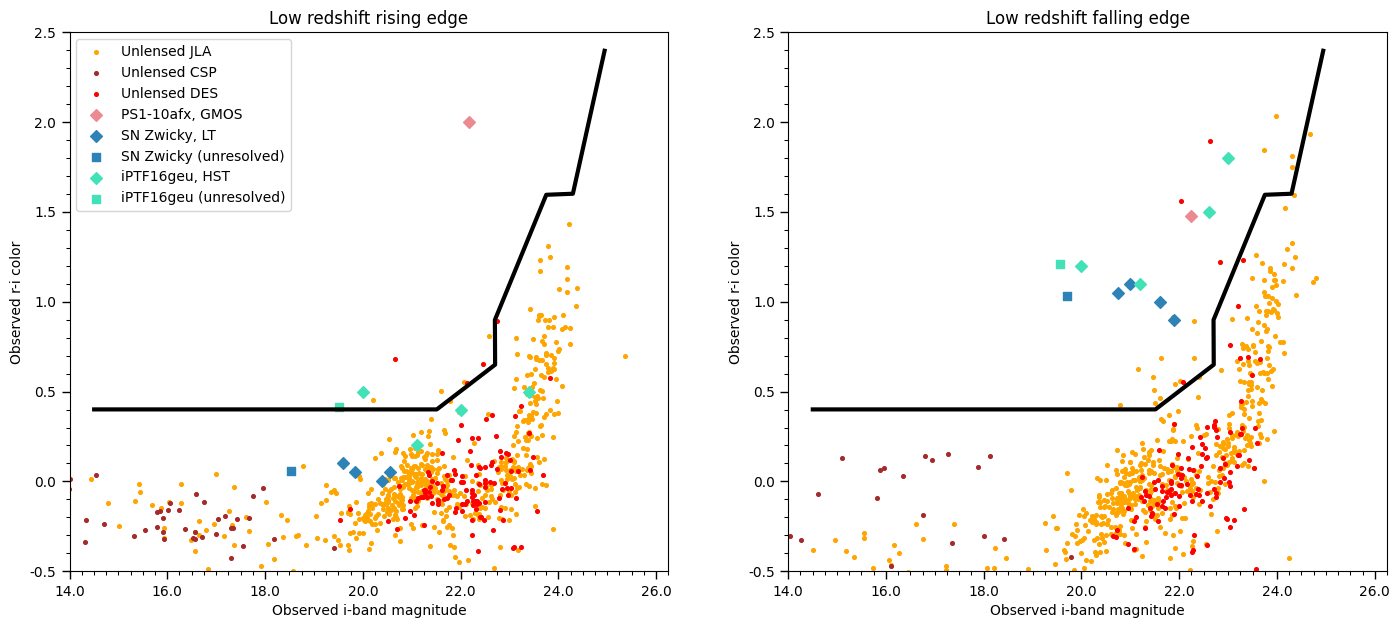
The criteria seems to hold well for the observed unlensed and lensed SNIa!
The color-magnitude analysis
Improvements?
Use of SALT2 template instead of the Nugent Template.
Thorough study of both rising and falling edge observations.
Use of self-consistent unlensed parent and lensed population
Higher redshift coverage
Comparison with the detected systems
Summary of the results and further work
The differece imaging pipeline works well to detect the variable sources
The color-magnitude criteria holds well for simulated and observed lensed and unlensed SNIa till redshift 2.4, both on rising and falling edge.
Source detection and measurements on the difference imaging results
Study the source properties to distinguish artifacts from the recovered SL SNIa
Calculate the angular separation between each set of images and search for recovered images that have been resolved
Use the color-magnitude analysis criterion on the photometry of recovered DIA sources
References
1. Treu, Tommaso, S. H. Suyu, and Philip J. Marshall. 2022. “Strong Lensing Time-Delay Cosmography in the 2020s.” The Astronomy and Astrophysics Review 30 (1). https://doi.org/10.1007/s00159-022-00145-y.
2. Masamune Oguri. 2019b. “Strong Gravitational Lensing of Explosive Transients.” Reports on Progress in Physics 82 (12): 126901. https://doi.org/10.1088/1361-6633/ab4fc5.
3. Quimby, R., Masamune Oguri, Anupreeta More, Surhud More, Takashi J. Moriya, Marcus C. Werner, Masayuki Tanaka, et al. 2014. “Detection of the Gravitational Lens Magnifying a Type IA Supernova.” Science 344 (6182): 396–99. https://doi.org/10.1126/science.1250903.
4. Guy, J., M. Sullivan, A. Conley, Nicolas Regnault, P. Astier, C. Balland, S. Basa, et al. 2010. “The Supernova Legacy Survey 3-Year Sample: Type Ia Supernovae Photometric Distances and Cosmological Constraints.” Astronomy and Astrophysics 523 (November): A7. https://doi.org/10.1051/0004-6361/201014468.
5. Abell, P. A., Julius Allison, Scott F. Anderson, John Andrew, J. R. P. Angel, L. Armus, David Arnett, et al. 2009. “LSST Science Book, Version 2.0.” arXiv (Cornell University), December. https://doi.org/10.48550/arxiv.0912.0201.
6. Aihara, H., Yusra AlSayyad, Motomi Ando, R. Armstrong, James Bosch, Eiichi Egami, Hisanori Furusawa, et al. 2019. “Second Data Release of the Hyper Suprime-Cam Subaru Strategic Program.” Publications of the Astronomical Society of Japan 71 (6). https://doi.org/10.1093/pasj/psz103.
7. Kessler, R., Gautham Narayan, Arturo Avelino, E. Bachelet, Rahul Biswas, P. J. Brown, David F. Chernoff, et al. 2019. “Models and Simulations for the Photometric LSST Astronomical Time Series Classification Challenge (PLASTICC).” Publications of the Astronomical Society of the Pacific 131 (1003): 094501. https://doi.org/10.1088/1538-3873/ab26f1.
THANK YOU!
Vertical_PRJ501_MS19054
By Prajakta Mane
Vertical_PRJ501_MS19054
Presentation made for IDC451: Seminar Delivery course on the topic Gravitational Lensing and the Most Powerful Explosions in the Space


