When Less is More:
Optical Metrology with
Weak Value Amplification
Justin Dressel
Institute for Quantum Studies
Schmid College of Science and Technology
SACNAS 2019
Outline
-
WVA: Tilt-sensitive Sagnac interferometer
- Weak value analysis
- Exact collimated analysis
- Propagation effects
- Noise tests
- Frequency measurement
-
WVA: Phase-sensitive Sagnac interferometer
- Displaced Sagnac design
- Inverse weak value regime response
-
WVA: Remote Sensing Applications
- Shot noise simulations with low flux
- Speckle simulations with mode distortion
How can we throw away 99% of our sensing light while keeping 99% of the relevant information?
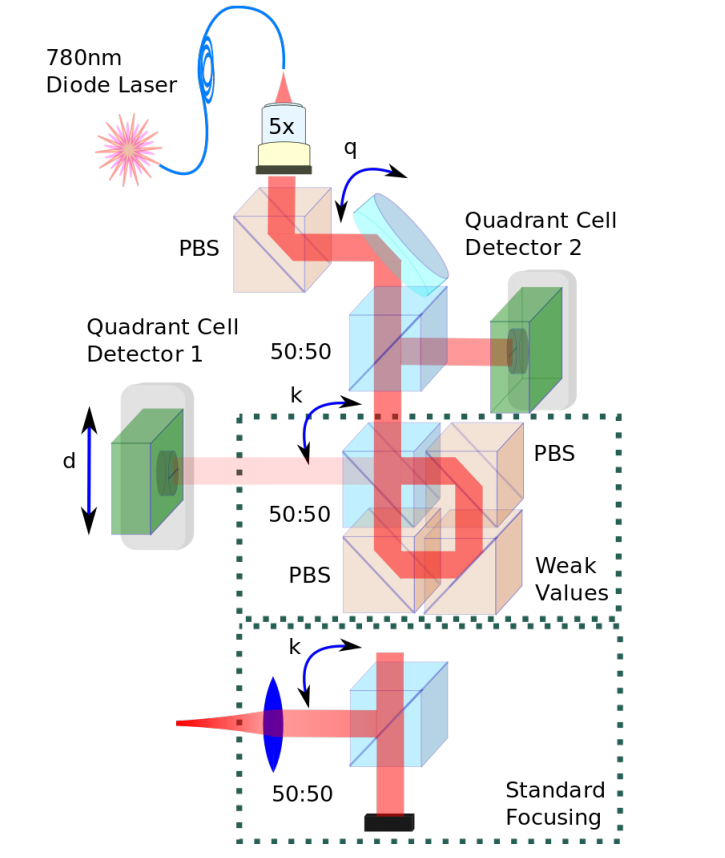
Sagnac Interferometer
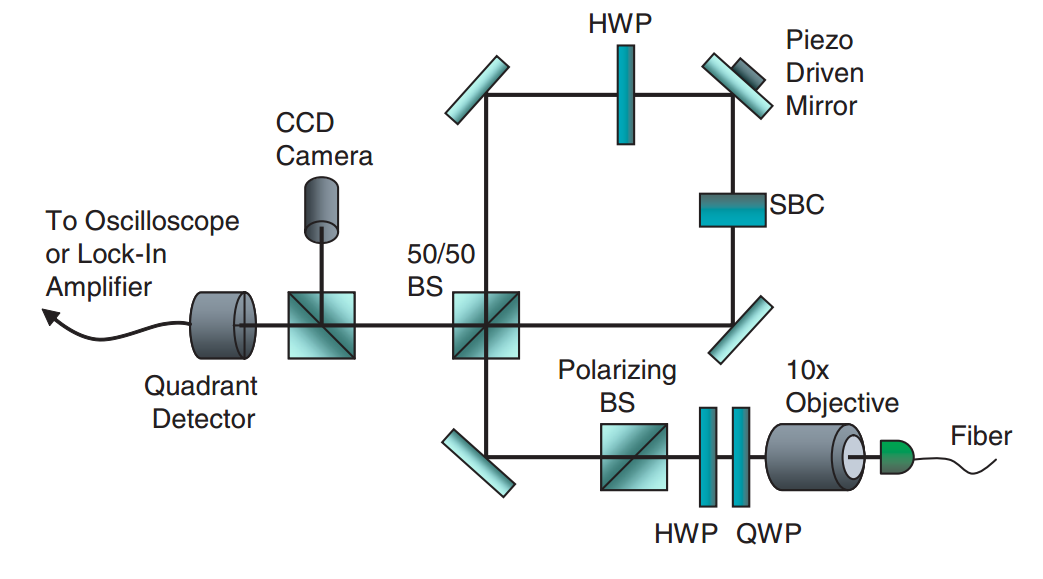
Prototype experiment: Howell lab, Rochester
PRL 102, 173601 (2009)
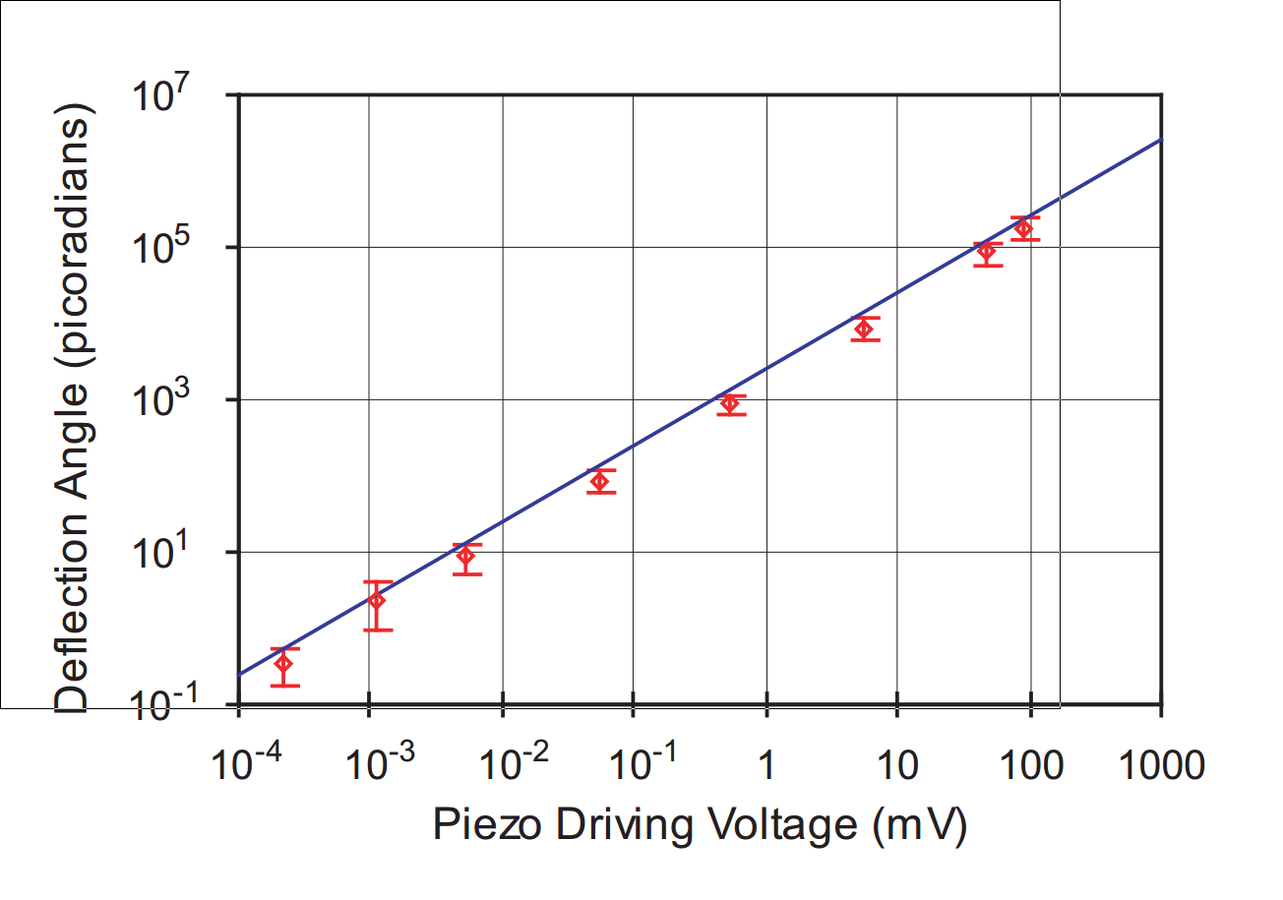
Ultra-sensitive to beam deflection: ~560 femto-radians of tilt detected
\phi\;\text{(phase offset)}
k\;\textbf{(tilt)}
x\;\text{(signal)}
\sigma\;\text{(beam waist)}
General Features of
"Weak Value Amplification" (WVA)
- Carefully prepared "Preselection State"
- Input laser profile
- Initial superposition of paths inside interferometer
- Intermediate weak interaction that affects branches of superposition slightly differently (to be detected)
- Small tilt k that breaks symmetry of counter-propagating paths
- Final "Post-selection" that interferes the branches of the superposition to amplify the interaction effect
- Collection at "dark port" of interferometer
- Most light thrown away at "bright port"!
Weak Value Analysis
|i\rangle \propto i|\!\circlearrowleft\rangle + |\!\circlearrowright\rangle
|f\rangle \propto e^{i\phi/2}|\!\circlearrowleft\rangle - ie^{-i\phi/2}|\!\circlearrowright\rangle
|\psi, i\rangle \to \langle p, f | \exp(-i k \hat{x}\hat{W}) | \psi, i \rangle \approx \langle f | i \rangle \langle p - k W_w | \psi \rangle
\hat{W} = |\!\circlearrowleft\rangle\langle\!\circlearrowleft | - |\!\circlearrowright\rangle\langle\!\circlearrowright |
W_w = \frac{\langle f |\hat{W}|i\rangle}{\langle f | i \rangle} = i\cot\frac{\phi}{2} \approx \frac{2i}{\phi}
\phi\;\text{(phase offset)}
k\;\text{(tilt)}
x\;\text{(signal)}
\sigma\;\text{(beam waist)}
Angular tilt (transverse momentum) amplified by large weak value.
Based on quantum analysis
Weak value regime
k\sigma \ll \phi \ll 1
Dark port has single lobe that approximates displaced a Gaussian centered at:
\langle x/\sigma \rangle \propto (\mathbf{k}/\phi)\sigma
Tiny beam deflections can be distinguished, but with low output intensity.
I \propto \phi^2
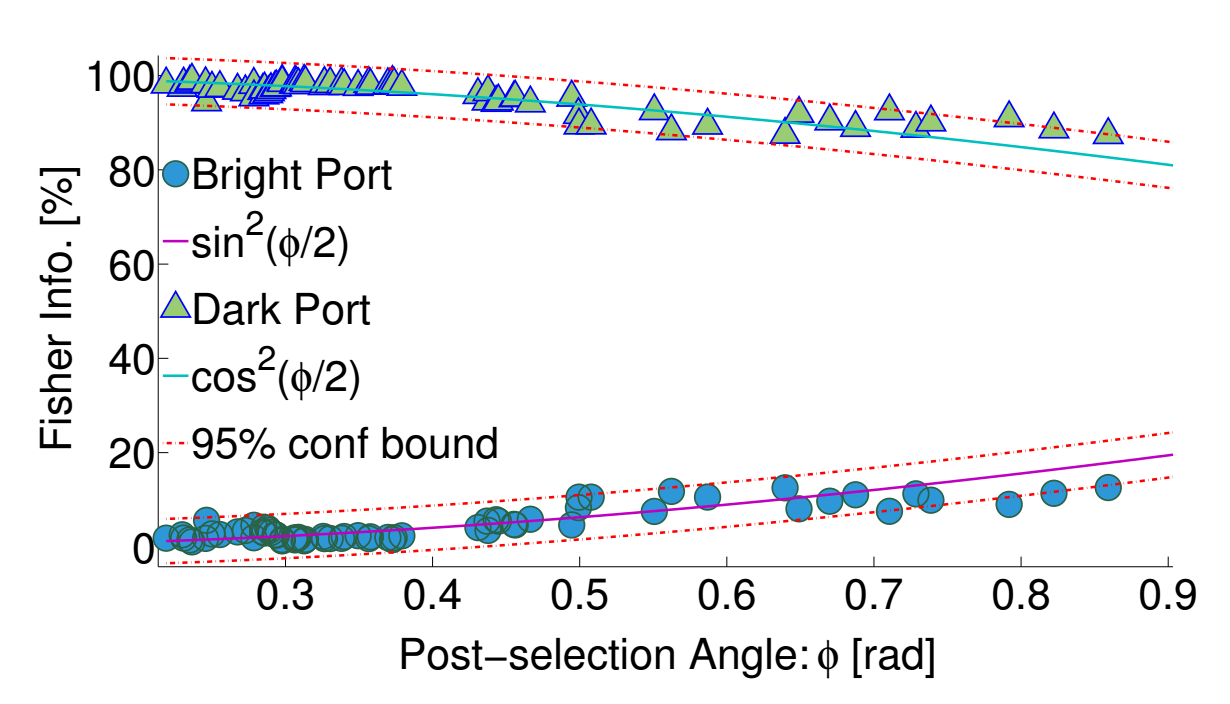
Signal Information vs. Port
- Dark port contains almost all information about the signal
- Discarded bright port has almost no information
- WVA filters the relevant information and suppresses irrelevant noise
Exact Collimated Analysis
|i\rangle = \frac{i|\!\circlearrowleft\rangle + |\!\circlearrowright\rangle}{\sqrt{2}}
|f\rangle = \frac{e^{i\phi/2}|\!\circlearrowleft\rangle - ie^{-i\phi/2}|\!\circlearrowright\rangle}{\sqrt{2}}
|\psi, i\rangle \to \langle x, f | \exp(-i k \hat{x}\hat{W}) | \psi, i \rangle = \langle x|\hat{M}_f\,|\psi\rangle = i\sin(\phi/2 - kx)\langle x | \psi\rangle
\hat{W} = |\!\circlearrowleft\rangle\langle\!\circlearrowleft\! | - |\!\circlearrowright\rangle\langle\!\circlearrowright\! |
\phi\;\text{(phase offset)}
k\;\text{(tilt)}
x\;\text{(signal)}
\sigma\;\text{(beam waist)}
\hat{M}_f = \langle f | \exp(-i k \hat{x}\hat{W}) | i \rangle = i \sin(\phi/2 - k\hat{x})
P(x) = |\langle x,f| \psi,i\rangle|^2 = \sin^2(\phi/2 - kx)\,P_0(x) = \frac{\sin^2(\phi/2 - kx)}{\sqrt{2\pi\sigma^2}} e^{-(x/\sigma)^2/2}
Original profile of beam becomes modulated.
JD et al., PRA 88 , 023801 (2013)
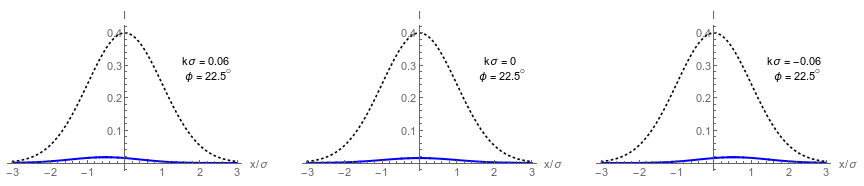
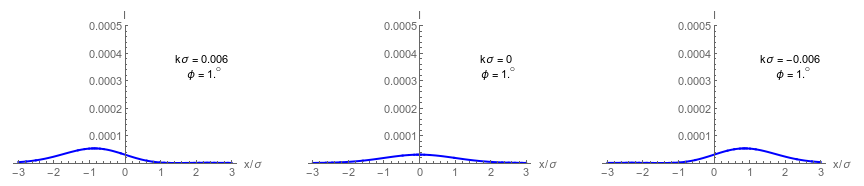
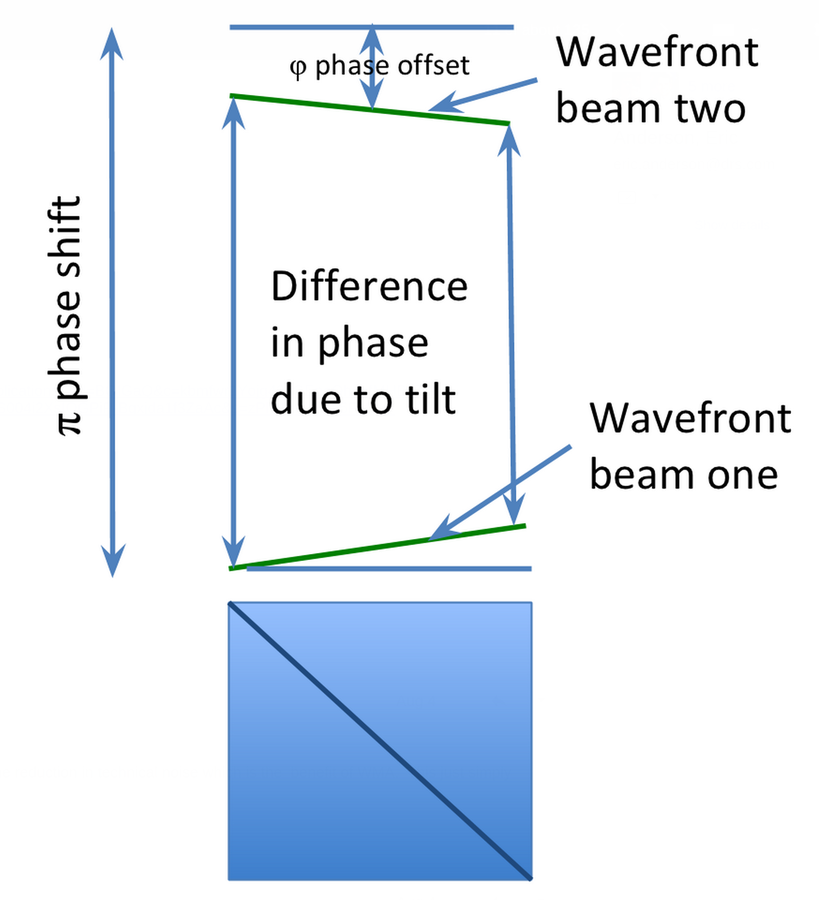
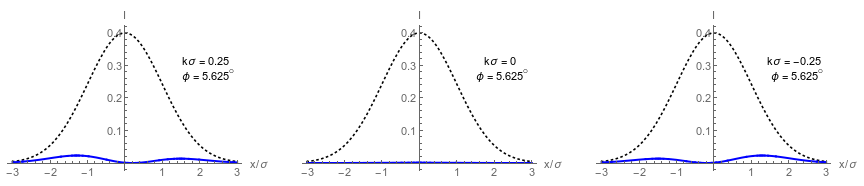
Collimated Dark Port Profiles
Left: Wavefront tilt mechanism producing spatial modulation
Right: Asymmetric dark port profiles in different regimes
Dashed envelope: input beam intensity
Solid curve:
dark port intensity
Top right:
weak value regime
Middle right:
double lobe regime
Bottom right:
misaligned regime
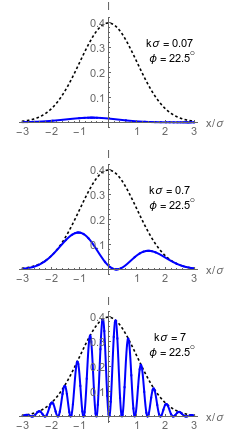
k\sigma \ll \phi \ll 1
\phi\ll k\sigma \ll 1
\phi\ll 1 \ll k\sigma
Confirming Noise Performance
WVA vs. Focused spot
Two injected noise sources:
- Modulated position jitter at detector (simulated vibration)
- Modulated mirror tilt outside interferometer setup
Prototype experiment: Howell lab, Rochester, PRA 92, 032127 (2015)
Goal: compare robustness against technical noise for two theoretically similar (and near optimal) beam deflection techniques
WV Regime with Propagation
|i\rangle = \frac{i|\!\circlearrowleft\rangle + |\!\circlearrowright\rangle}{\sqrt{2}}
|f\rangle = \frac{e^{i\phi/2}|\!\circlearrowleft\rangle - ie^{-i\phi/2}|\!\circlearrowright\rangle}{\sqrt{2}}
|\psi, i\rangle \to \langle x, f | e^{-i\hat{p}^2\ell_2/2k_0}e^{-i k \hat{x}\hat{W}}e^{-i\hat{p}^2\ell_1/2k_0}e^{iq\hat{x}} | \psi, i \rangle = \langle x|\hat{M}_f\,|\psi\rangle
\hat{W} = |\!\circlearrowleft\rangle\langle\!\circlearrowleft\! | - |\!\circlearrowright\rangle\langle\!\circlearrowright\! |
\phi\;\text{(phase offset)}
k\;\text{(tilt)}
x\;\text{(signal)}
\sigma\;\text{(beam waist)}
\hat{M}_f = i e^{-i\hat{p}^2\ell_2/2k_0}\sin(\phi/2 - k\hat{x})e^{-i\hat{p}^2\ell_1/2k_0}e^{iq\hat{x}}
\int xP(x|f)dx = \frac{\int x|\langle x,f| \psi,i\rangle|^2dx}{\int|\langle x,f| \psi,i\rangle|^2dx} \approx \displaystyle \mathbf{\frac{k}{\phi}}\left[4\sigma^2 + \frac{\ell_1(\ell_1+\ell_2)}{k_0^2\sigma^2}\right] + \frac{\mathbf{q}(\ell_1+\ell_2)}{k_0} + \cdots
Tilted input q not amplified, but tilt k inside device is amplified.
ANJ et al., PRX 4 , 011031 (2014)
q\;\text{(tilted input)}
\ell_1,\ell_2\;\text{(propagation lengths)}
Injected Noise Robustness
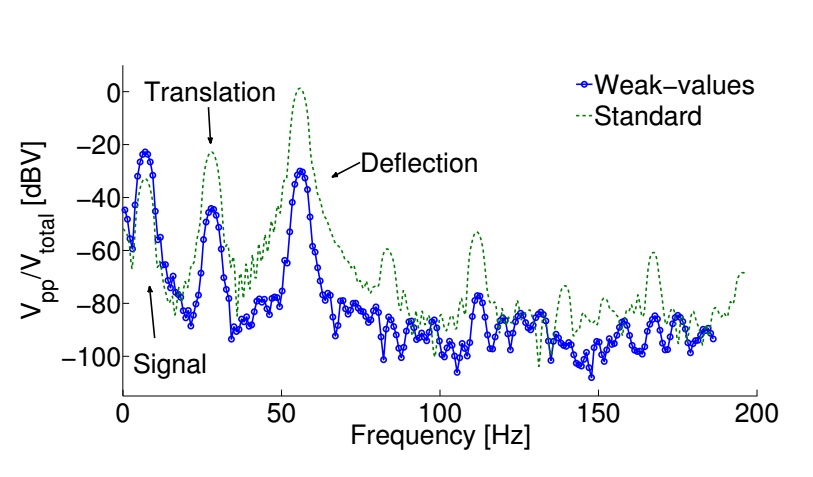
- Modulation of signal mirror enhanced by 10dBV
- Modulation noise of detector position suppressed by 20dBV
- Modulation noise of external tilt suppressed by 30dBV
- Non-injected noise floor generally suppressed
Passive Laser Noise Results
- No modulated signal added - passive random background
-
No spatial mode filtering of raw laser output:
random mode fluctuations below 300 Hz expected. - WVA suppresses passive laser noise by 20dBV
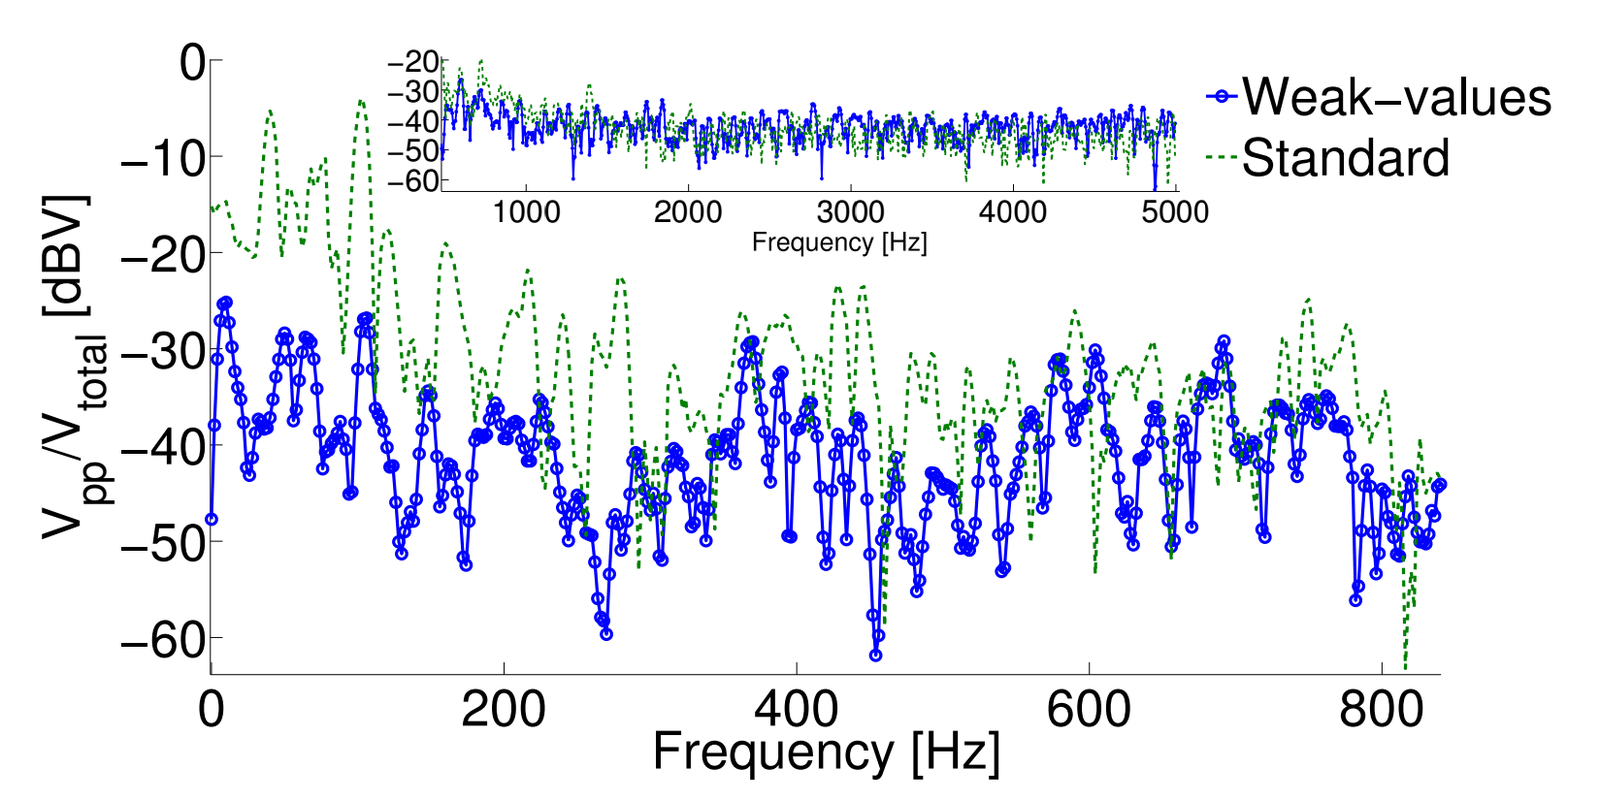
(Real noise in the wild)
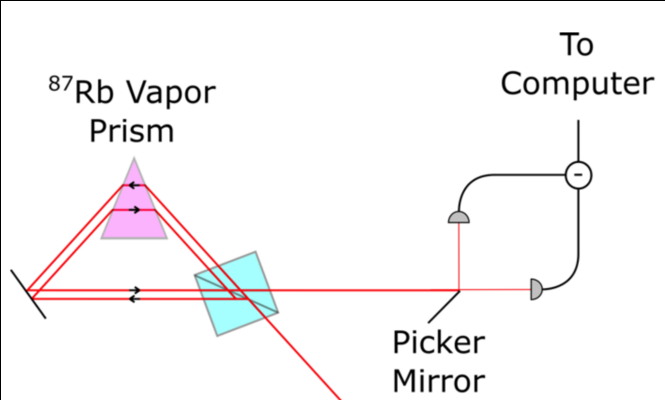
Frequency Measurement
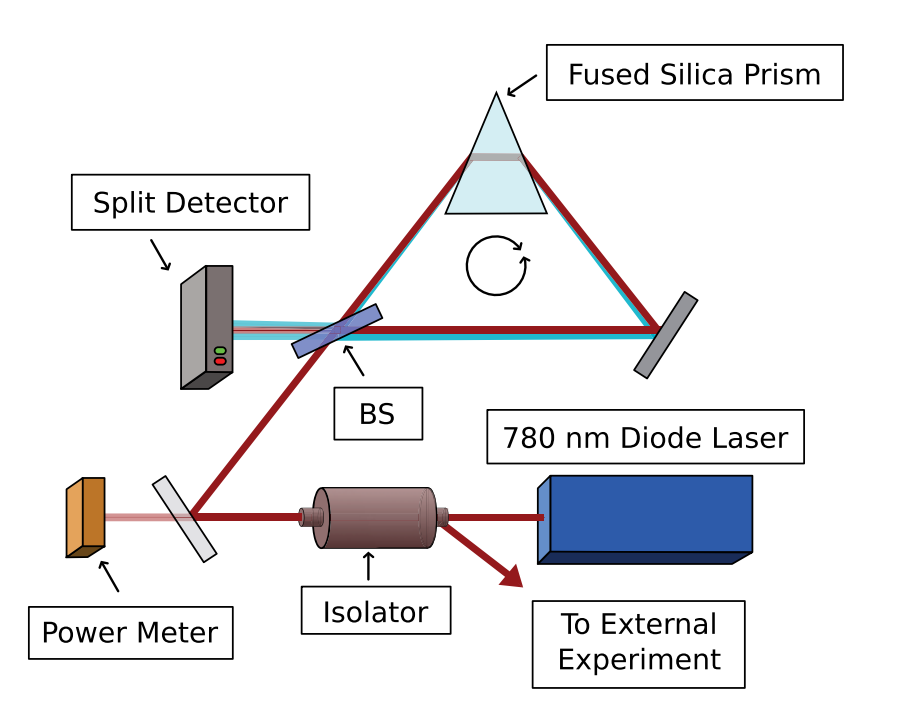
Mirror vertically misaligned to produce phase shift
\phi
Frequency-dependent horizontal tilt
Frequency-modulated and power-locked source laser
Prototype experiment: Howell lab, Rochester, PRA 82, 063822 (2010)
Idea: Use prism to convert frequency modulation into beam tilt
Frequency to Tilt/Phase
\theta_0
\theta(f)
n(f) \ll fn'(f)
\sin\theta(f) = n(f)\sin\theta_0
\Delta\theta = \textstyle \frac{\sin\theta_0}{\cos\theta(f)} \displaystyle n'(f) \Delta f \propto \frac{c}{v_g}\frac{\Delta f}{f} \approx \frac{k}{k_0}
v_g = \frac{d\omega}{dk_0} = \frac{c}{n(f) + fn'(f)} \approx \frac{c}{fn'(f)}
Tilt from frequency dither:
(slower light amplifies tilt)
Phase if CW and CCW paths have different propagation L in prism:
\phi = \Delta L\,k_0 = 2\pi\frac{\Delta L}{c}fn(f)
\Delta \phi = 2\pi\frac{\Delta L}{c}(n(f)+fn'(f))\Delta f = \displaystyle \frac{2\pi\Delta L}{v_g} \Delta f
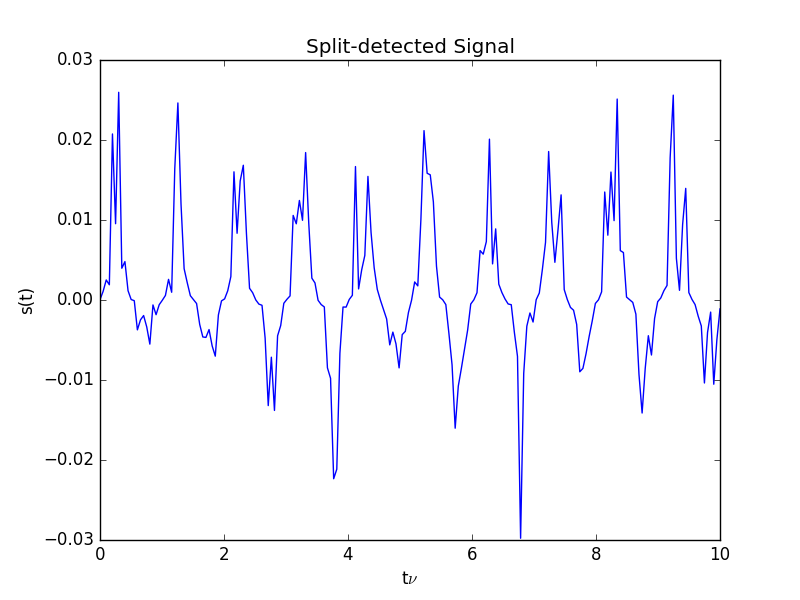
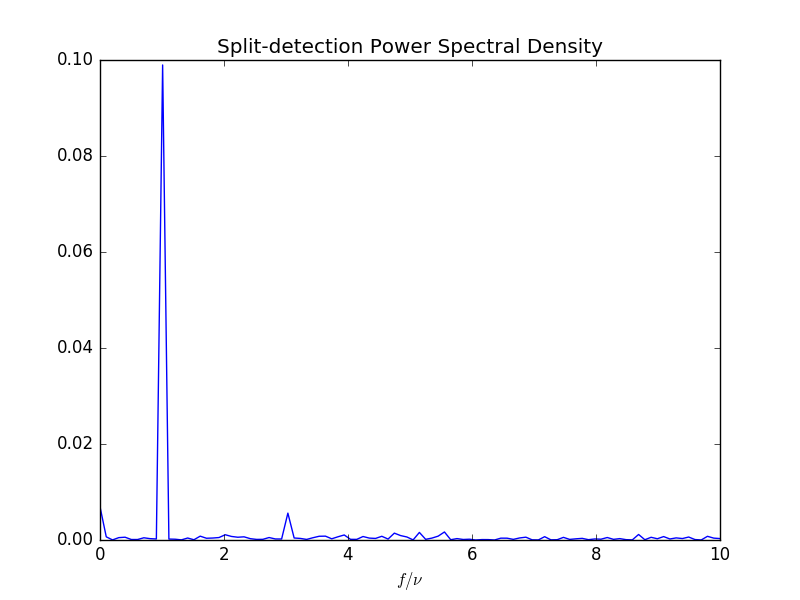
Frequency Results
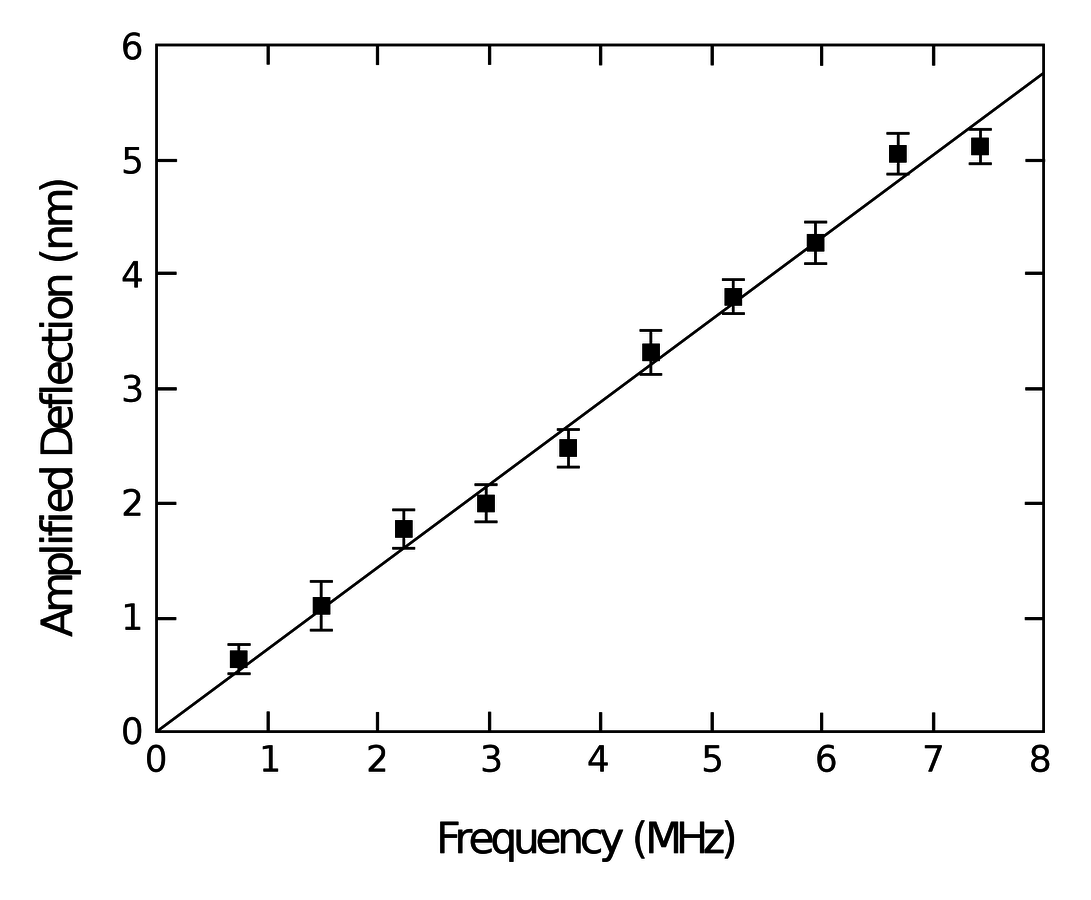
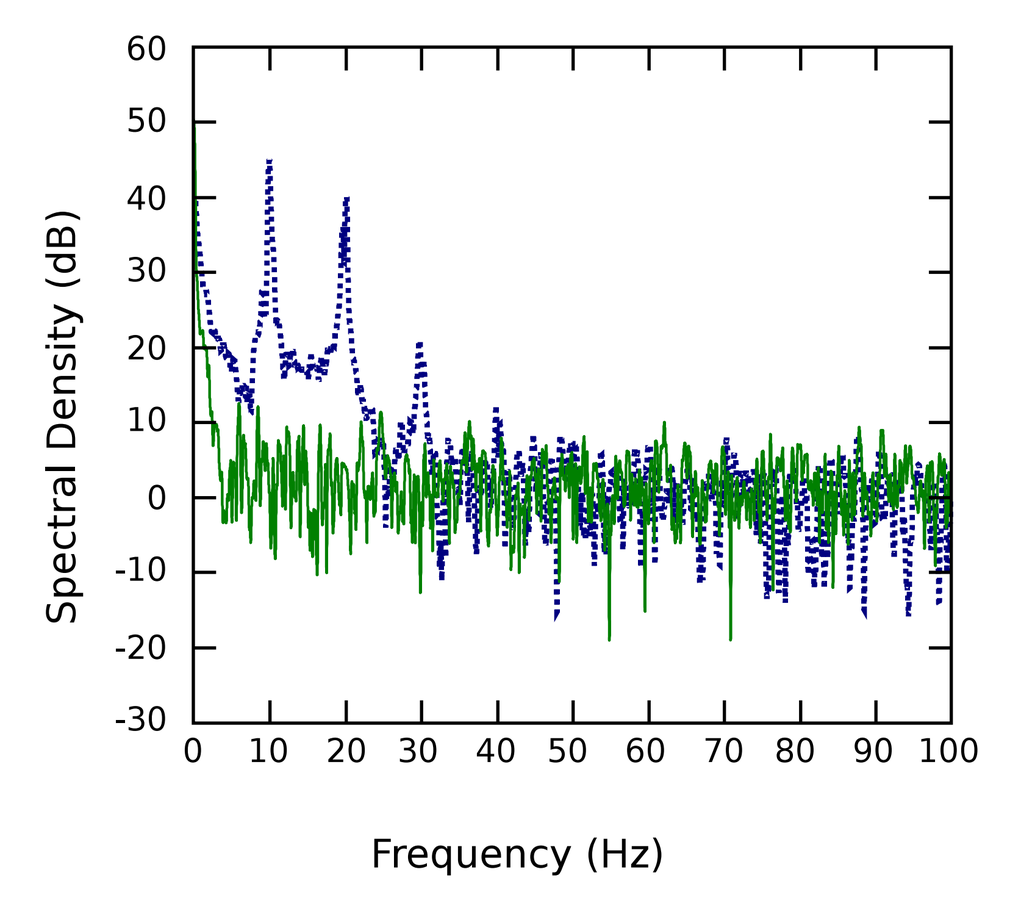
- 780nm light (frequency ), 2mW CW power
- shift detected over 100ms
- Frequency sensitivity of
- 10 Hz frequency modulation 35dB above noise floor
f = 340 \mathrm{THz}
\Delta f = 743 \mathrm{kHz} \approx 10^{-9} f
129 \pm 7 \mathrm{kHz}/\sqrt{\mathrm{Hz}}
Split-detection
maximum excursion
(weak value regime)
Spectral density of split detected signal
Outline
-
WVA: Tilt-sensitive Sagnac interferometer
- Weak value analysis
- Exact collimated analysis
- Propagation effects
- Noise tests
- Frequency measurement
-
WVA: Phase-sensitive Sagnac interferometer
- Displaced Sagnac design
- Inverse weak value regime response
-
WVA: Remote Sensing Applications
- Shot noise simulations with low flux
- Speckle simulations with mode distortion
Displaced Sagnac
\theta_0
\theta(f)
n(f) \ll fn'(f)
\Delta\theta \propto \displaystyle \frac{c}{v_g}\frac{\Delta f}{f} \approx \frac{k}{k_0}
\Delta \phi = \displaystyle \frac{2\pi\Delta L}{v_g} \Delta f
More sensitive to phase
(less tilt)
Operates in double-lobe regime (inverse weak value)
Split-detection Response
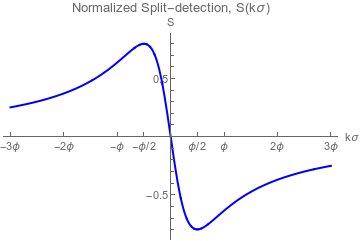
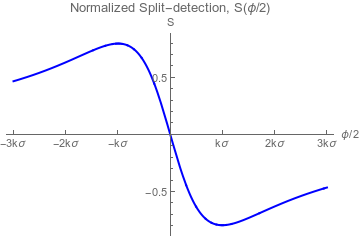
(Parameter-invariant response curves)
\phi/2
k\sigma
k\sigma \ll \phi/2 \ll 1
\phi/2 \ll k\sigma \ll 1
Weak value Regime:
Single-lobe response
Well-analyzed
Inverse Weak value Regime:
Double-lobe response
Lab tests suggest better
noise performance
Outline
-
WVA: Tilt-sensitive Sagnac interferometer
- Weak value analysis
- Exact collimated analysis
- Propagation effects
- Noise tests
- Frequency measurement
-
WVA: Phase-sensitive Sagnac interferometer
- Displaced Sagnac design
- Inverse weak value regime response
-
WVA: Remote Sensing Applications
- Shot noise simulations with low flux
- Speckle simulations with mode distortion
Shot Noise Robustness
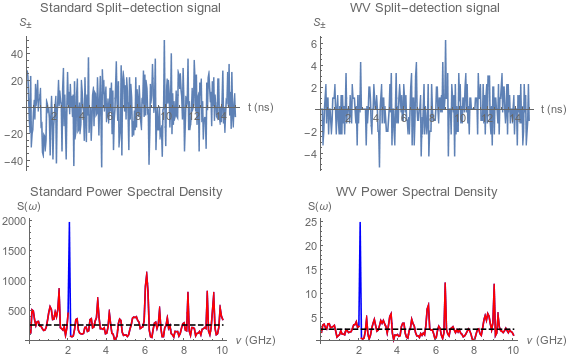
Consider one 1.2W pulse, returning ~2600 photons per modulation cycle. After post-selection, WV has only ~26 photons remaining per cycle.
Very small FM signal is still just observed above shot noise.
The WV technique performs equally well as lens focusing.
Laser Speckle
Speckle arises from propagation of spatially random phases jumps acquired from reflection off the target, as well as turbulent propagation through the atmosphere
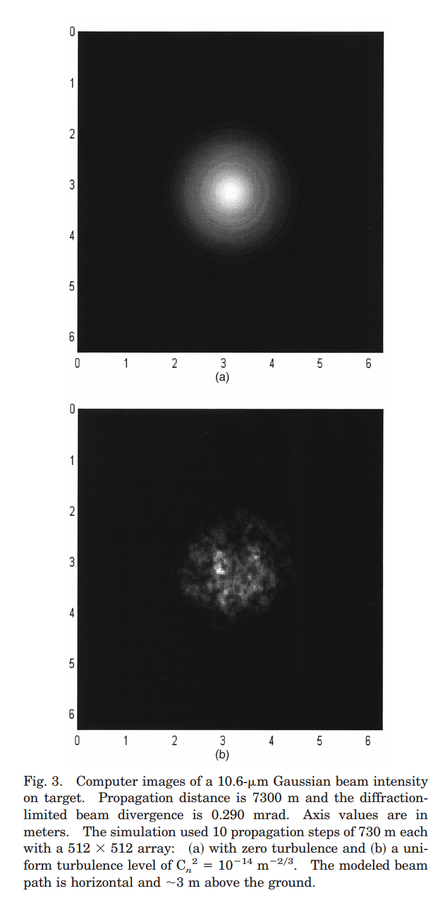
App. Opt. 39, 1857 (2000).
Speckle deteriorates the transverse spatial profile of the collected beam entering the WV interferometer
Since the WV amplification effect relies on spatial interference, this causes concern
\langle \vec{x} |\psi(z+dz)\rangle \to \langle \vec{x} | e^{-i\hat{\vec{p}}\cdot\hat{\vec{p}}\, dz/2k_0}e^{i\theta(\hat{\vec{x}},z)} | \psi(z) \rangle
Accurate speckle can be modeled by a succession of sub-Rayleigh-length propagations dz of the transverse profile with random spatial phase screens (jumps) at each propagation length
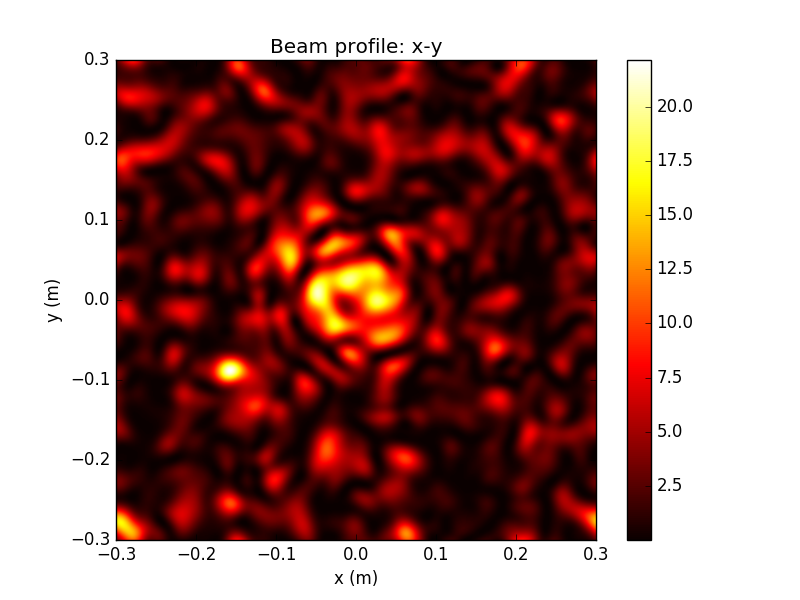
Propagation Simulation
Using this technique, we can generate realistic beam profiles with fluctuating distortions in both the transverse mode profile and the phase fronts of the beam
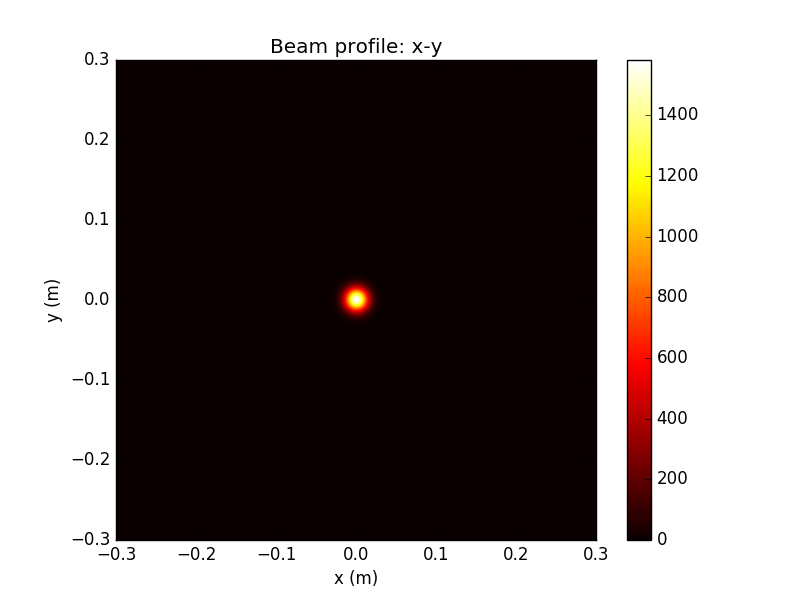
Gaussian source beam
Beam after propagation
Above: extreme example of speckle for test purposes
Note attenuation of peak by factor of 700
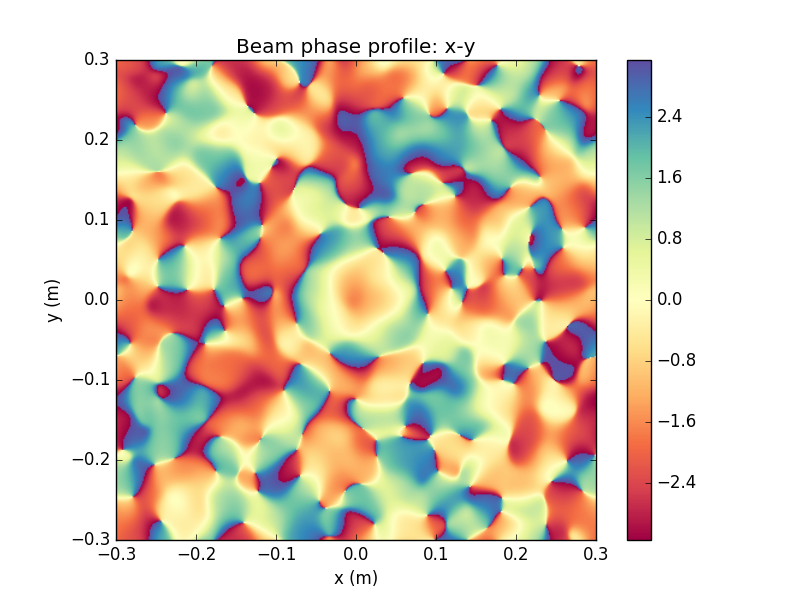

Propagated Beam Detail
These irregular transverse mode profile and phase fronts fluctuate in time, and will be collected by the receiving aperture and sent into the WV interferometer for filtering
This is an extreme non-Gaussian example

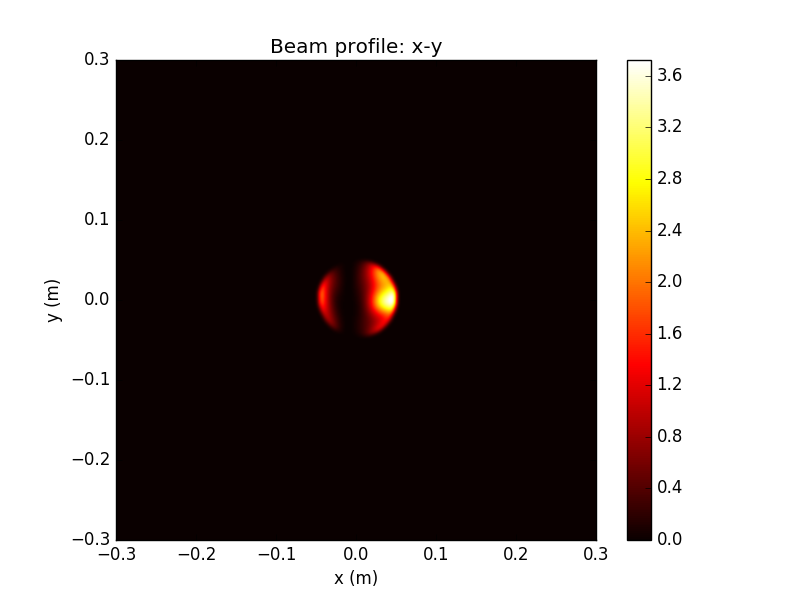
WV-filtered Beam Detail
Remarkably, after collection by an aperture (radius 5cm here), and propagation through the interferometer and out the dark port, the interference pattern at the output is almost unaffected by the irregularities of the beam
WV Attenuation: factor of ~100 from input, similar to ideal case
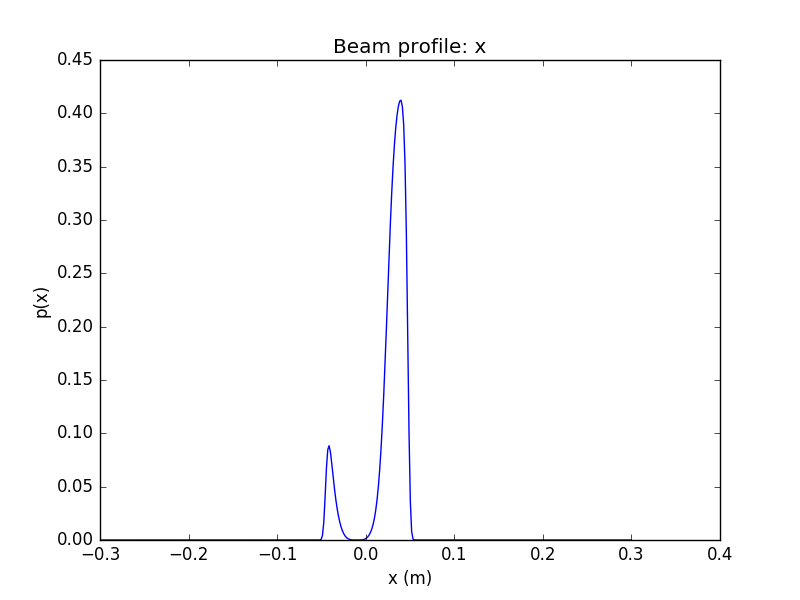
WV-filtered Split Detection
Even extreme beam irregularities have a remarkably small effect on the fidelity of the WVA-filtered and split-detected signal
Despite dramatic fluctuations in time of the input beam, including transverse mode distortion and phase front jitter, the signal visibility remains nearly unaffected
Conclusions
- It is possible to concentrate all relevant information about a parameter into a small subset of events, which can be picked out by a suitable filter: WVA achieves this!
-
Benefits: Can use cheaper equipment and more sensitive detectors that would saturate more easily otherwise, etc.
-
WVA suppresses technical noise originating outside interferometer by only amplifying inside interactions
-
WVA has optimal shot-noise peformance
- WVA robust against transverse mode and phase distortion
Thank You!
When Less is More
By Justin Dressel
When Less is More
SACNAS 2019 Slides


