Book Discussion
Site Reliability Engineering Chapter 3 to 5
Chapter 3 - Embracing Risk
Reliability
- Past a certain point, increasing reliability is worst for an organization
- User can't tell the difference between 99%, 99.99% and 99.999% reliability
The Cost of Reliability
Cost does not increase linearly as reliability increments. Two dimensions of the cost:
- Redundant machine/compute resources
- Opportunity cost
Strive to make a service reliable enough, but no more reliable than it needs to be.
Measuring Service Risk
Identify the objective metric to represent the property of a system we want to optimize. In Google, to measure service risk, the metric they use is unplanned downtime.
Unplanned downtime is captured by the desired level of service availability.
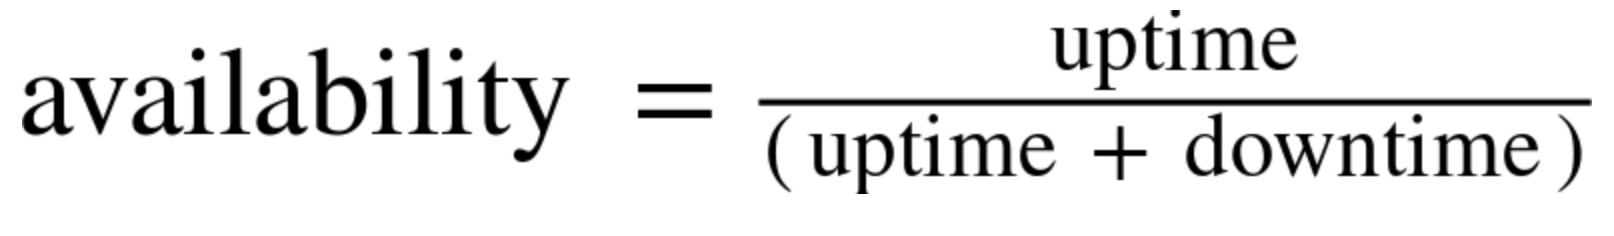
Time-based Service Availability
Given the formula above, system with an availability target of 99.99% can be down for up to 52.56 minutes in a year.
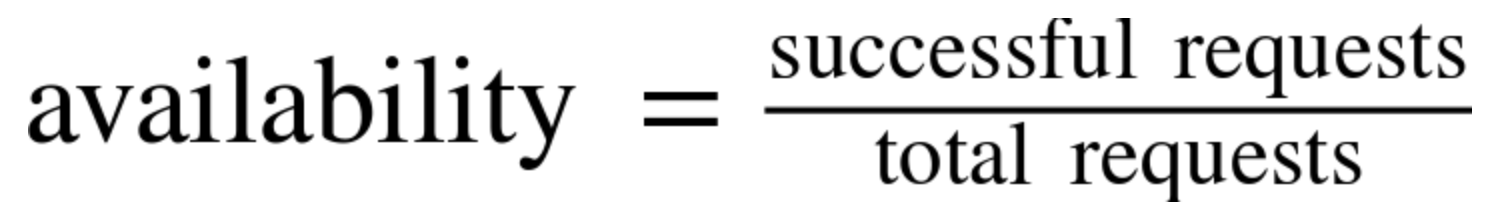
Request Success Rate
Given the formula above, system with 99.99% availability target that servers 2.5M requests per day can have up to 250 error requests per day.
Risk Tolerance of Services
Factors to consider when accessing the risk tolerance of a service:
- What level of availability is required?
- Do different type of failures have different effects on the service?
- How can we use the service cost to help locate a service on the risk continuum?
- What other service metrics are important to take into account?
Target Level of Availability
Factors to consider when accessing the target level of availability of a service:
- What level of service will the users expect?
- Does this service tie directly to revenue (either our revenue, or our customers’ revenue)?
- Is this a paid service, or is it free?
- If there are competitors in the marketplace, what level of service do those competitors provide?
- Is this service targeted at consumers, or at enterprises?
Error Budget
Dev and Ops have different metric. Dev wants to push his/her frequency as many times as possible. Ops wants to keep system stability, and frequent changes mean increase of instability.
To reconcile the two sides, Google use what they call as "error budget", an objective metric that determines how unreliable a service is allowed within a single quarter.
Forming Error Budget
- PM defines its product Service Level Objectives (which will be explained further in chapter 4, but service availability is one of the elements of SLO)
- The actual uptime is measured by a monitoring system
- As long as the uptime measured is above the SLO, new features can be pushed into production
Chapter 4 - Service Level Objectives
Terms
- Indicators
- Objectives
- Agreements
Indicators
An SLI is a service level indicator—a carefully defined quantitative measure of some aspect of the level of service that is provided.
Example:
- requests latency — how long it takes to return a response to a request
- error rates — error requests compared to all requests received
- system throughput — requests per second
- availability — the fraction of the time that a service is usable
Objectives
An SLO is a service level objective: a target value or range of values for a service level that is measured by an SLI.
Structure of SLOs usually in the form of something like: SLI ≤ target, or lower bound ≤ SLI ≤ upper bound.
Choosing SLO is hard. Choosing and publishing SLOs to users sets expectations about how a service will perform.
Agreements
SLAs are service level agreements: an explicit or implicit contract with your users that includes consequences of meeting (or missing) the SLOs they contain.
SRE Relationship with SLI, SLO, and SLA
Site Reliability Engineers doesn’t typically get involved in constructing SLAs, because SLAs are closely tied to business and product decisions.
SRE does, however, get involved in helping to avoid triggering the consequences of missed SLOs.
They can also help to define the SLIs: there obviously needs to be an objective way to measure the SLOs in the agreement, or disagreements will arise.
Indicators in Practice
Services tend to fall into a few broad categories in terms of the SLIs they find relevant.
- User-facing serving systems generally care about availability, latency, and throughput.
- Storage systems often emphasize latency, availability, and durability.
- Big data systems tend to care about throughput and end-to-end latency.
- All systems should care about correctness: was the right answer returned, the right data retrieved, the right analysis done? This is usually not the scope of an SRE's job desc.
Standardize Indicators
It is recommended to standardize indicators so we don't have to argue about it from scratch every time we determine SLI for a service. Example:
- Aggregation intervals: “Averaged over 1 minute”
- Aggregation regions: “All the tasks in a cluster”
- How frequently measurements are made: “Every 10 seconds”
- Which requests are included: “HTTP GETs from black-box monitoring jobs”
- How the data is acquired: “Through our monitoring, measured at the server”
- Data-access latency: “Time to last byte”
Objectives in Practice
Start by finding out what your users care about, not what you can measure.
Often, what your users care about is difficult or impossible to measure, so you’ll end up approximating users’ needs in some way.
Defining Objectives
For maximum clarity, SLOs should specify how they’re measured and the conditions under which they’re valid. For instance:
- 99% (averaged over 1 minute) of Get RPC calls will complete in less than 100 ms (measured across all the backend servers).
- 99% of Get RPC calls will complete in less than 100 ms.
Choosing Targets
Choosing targets (SLOs) is not a purely technical activity. It should involve considerations of constraints such as staffing, time to market, hardware availability, funding, etc. Some few guidance to choose SLOs are:
- Don’t pick a target based on current performance
- Keep it simple
- Avoid absolutes
- Have as few SLOs as possible
- Perfection can wait
Control Measures
Now that we understand what are SLI and SLO, we have to:
- Monitor and measure the system’s SLIs
- Compare the SLIs to the SLOs, and decide whether or not action is needed
- If action is needed, figure out what needs to happen in order to meet the target
- Take that action
Chapter 5 - Eliminating Toil
What is Toil? (1)
Toil is the kind of work tied to running a production service that tends to be manual, repetitive, automate-able, tactical, devoid of enduring value, and that scales linearly as a service grows.
Not every task deemed toil has all these attributes, but the more closely work matches one or more of the following descriptions, the more likely it is to be toil.
What is Toil? (2)
Manual
This includes work such as manually running a script that automates some task. Running a script may be quicker than manually executing each step in the script, but the hands-on time a human spends running that script (not the elapsed time) is still toil time.
Repetitive
If you’re performing a task for the first time ever, or even the second time, this work is not toil. Toil is work you do over and over. If you’re solving a novel problem or inventing a new solution, this work is not toil.
What is Toil? (3)
Automate-able
If a machine could accomplish the task just as well as a human, or the need for the task could be designed away, that task is toil. If human judgment is essential for the task, there’s a good chance it’s not toil.
Tactical
Toil is interrupt-driven and reactive, rather than strategy-driven and proactive. Handling pager alerts is toil. We may never be able to eliminate this type of work completely, but we have to continually work toward minimizing it.
What is Toil? (4)
No enduring value
If your service remains in the same state after you have finished a task, the task was probably toil. If the task produced a permanent improvement in your service, it probably wasn’t toil, even if some amount of grunt work—such as digging into legacy code and configurations and straightening them out—was involved.
O(n) with service growth
If the work involved in a task scales up linearly with service size, traffic volume, or user count, that task is probably toil. An ideally managed and designed service can grow by at least one order of magnitude with zero additional work, other than some one-time efforts to add resources.
Why Eliminate Toil?
An SRE organization should only work on toil max 50% of their time. The remaining 50% should be used on engineering project to improve reliability, performance, and utilization which often results in reducing toil.
Typical SRE Activities
- Software Engineering — writing or modifying code, such as: writing automation scripts, creating tools or frameworks, adding service features for scalability and reliability, or modifying infrastructure code to make it more robust.
- System Engineering — configuring production systems, modifying configurations, or documenting systems in a way that produces lasting improvements from a one-time effort.
- Toil
- Overhead — Administrative work not tied directly to running a service.
Things to Discuss
- Can we create our own SLO for services in Go-Pay?
- Can we create a reliable monitoring system to actually measure our uptime according to the SLO?
- Can we be discipline to respect the error budget and not push anything to production for a quarter once the SLO is breached?
- How much our work is toil?
- Can we improve our team work to be more software and system engineering instead of toil for everyone?
Book Discussion - Site Reliability Engineering Chapter 3 to 5
By qblfrb


