

Ronald Kurr
Long time software developer.
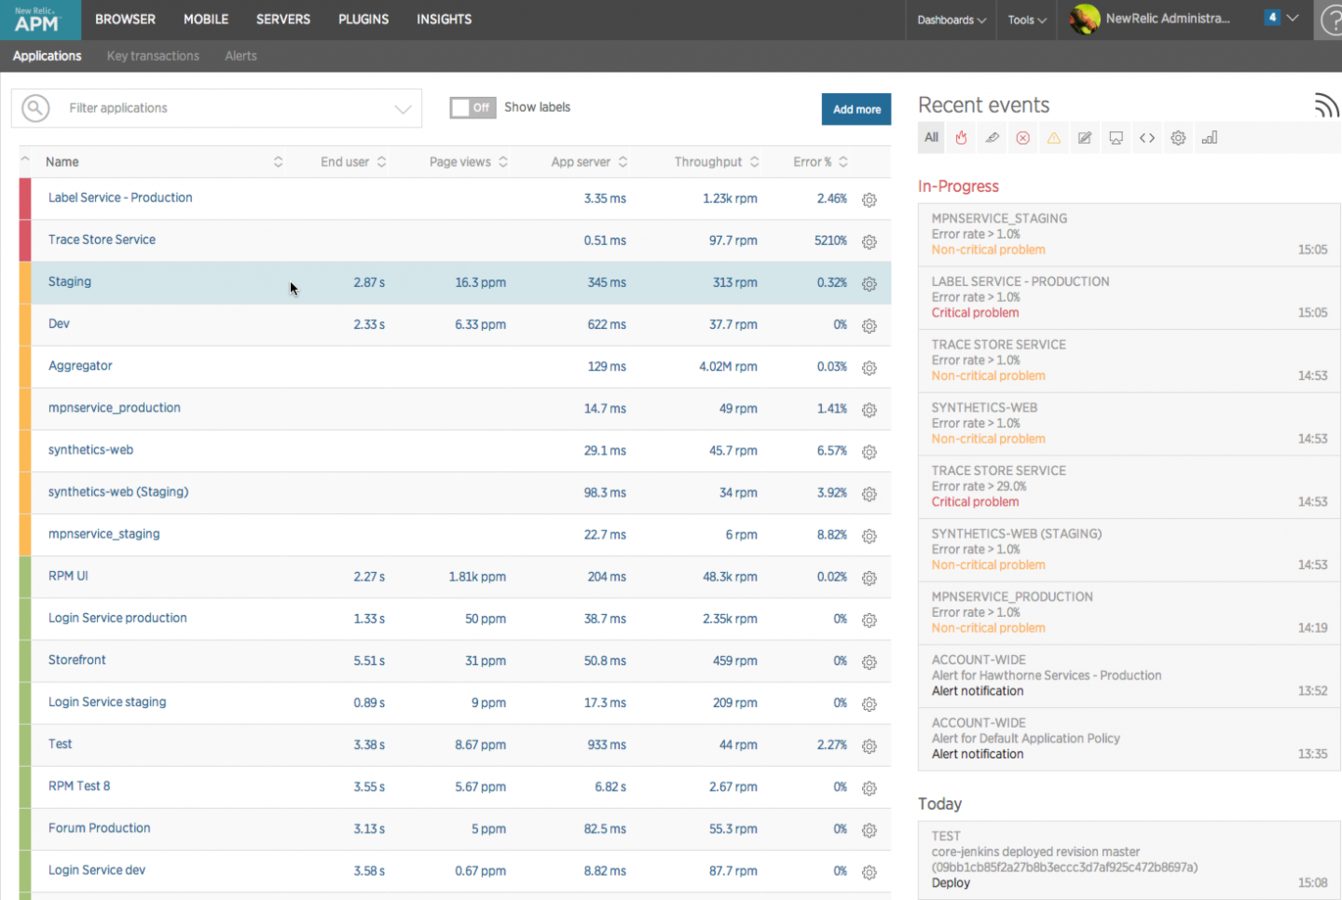
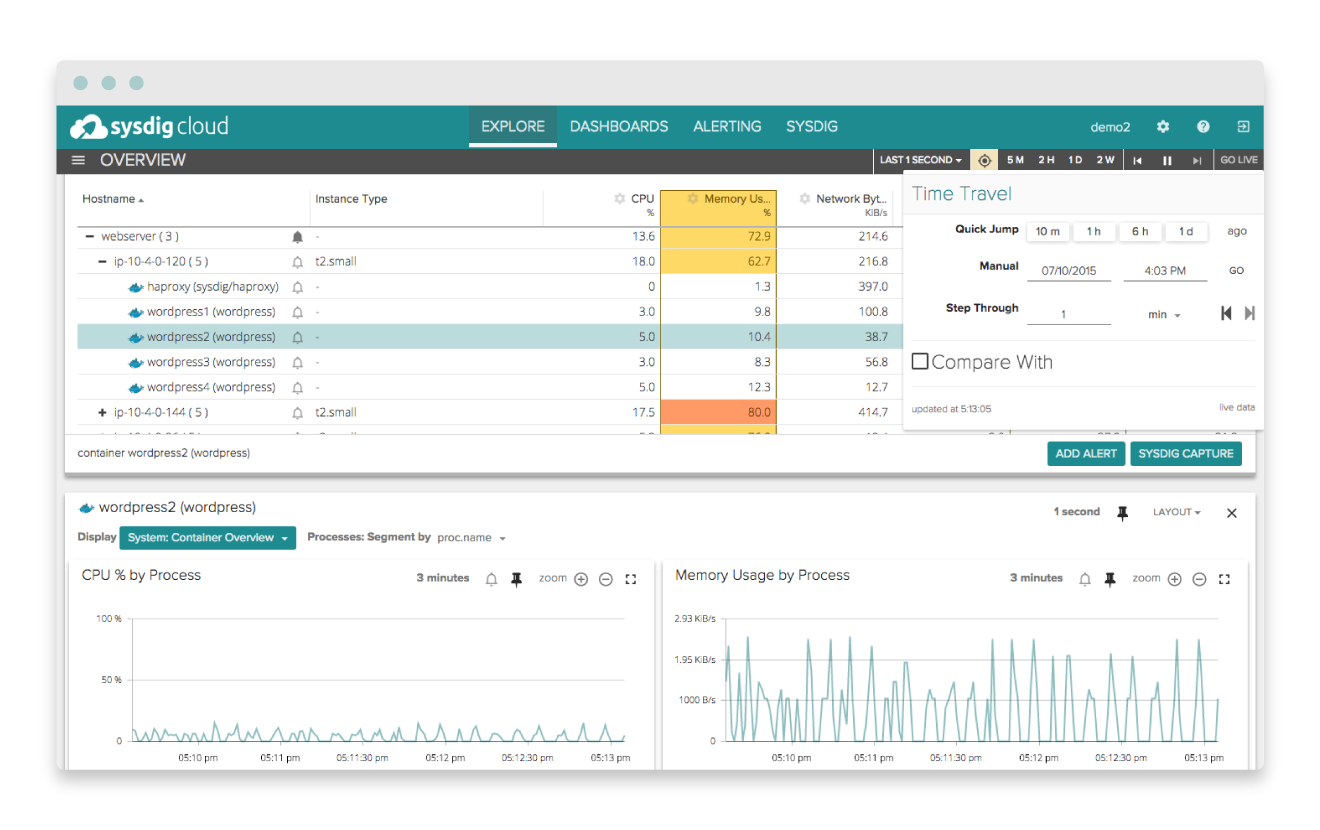
| Attribute | New Relic | Datadog | Sysdig Cloud |
|---|---|---|---|
| Agent Based | [x] | [x] | |
| Docker Support | [x] | [x] | |
| Free Tier Available | [x] * | [x] ^ | |
| Infrastructure Plug-ins | [x] | [x] | |
| Web Dashboard | [x] | [x] | |
| Mobile Application | [x] | [ ] |
* 24-hour data retention, unlimited hosts
^ 24-hour data retention, 5 hosts
| Scenario | New Relic | Datadog |
|---|---|---|
| Dead Instance | [x] | [x] |
| 90% CPU | [x] | [x] |
| 90% Disk Space | [x] | [x] |
| 90% RAM | [N/A ] | [ N/A] |
| 90% Disk I/O | [N/A ] | [ N/A] |
| 90% Network I/O | [N/A] | [N/A] |
N/A: not attempted
| Scenario | New Relic | Datadog |
|---|---|---|
| CPU Usage | [x] | [x] |
| RAM Usage | [x] | [x] |
| Disk Usage | [ ] | [ ] |
| Network Usage | [ ] | [ ] |
| Container Events | [ ] | [x] |
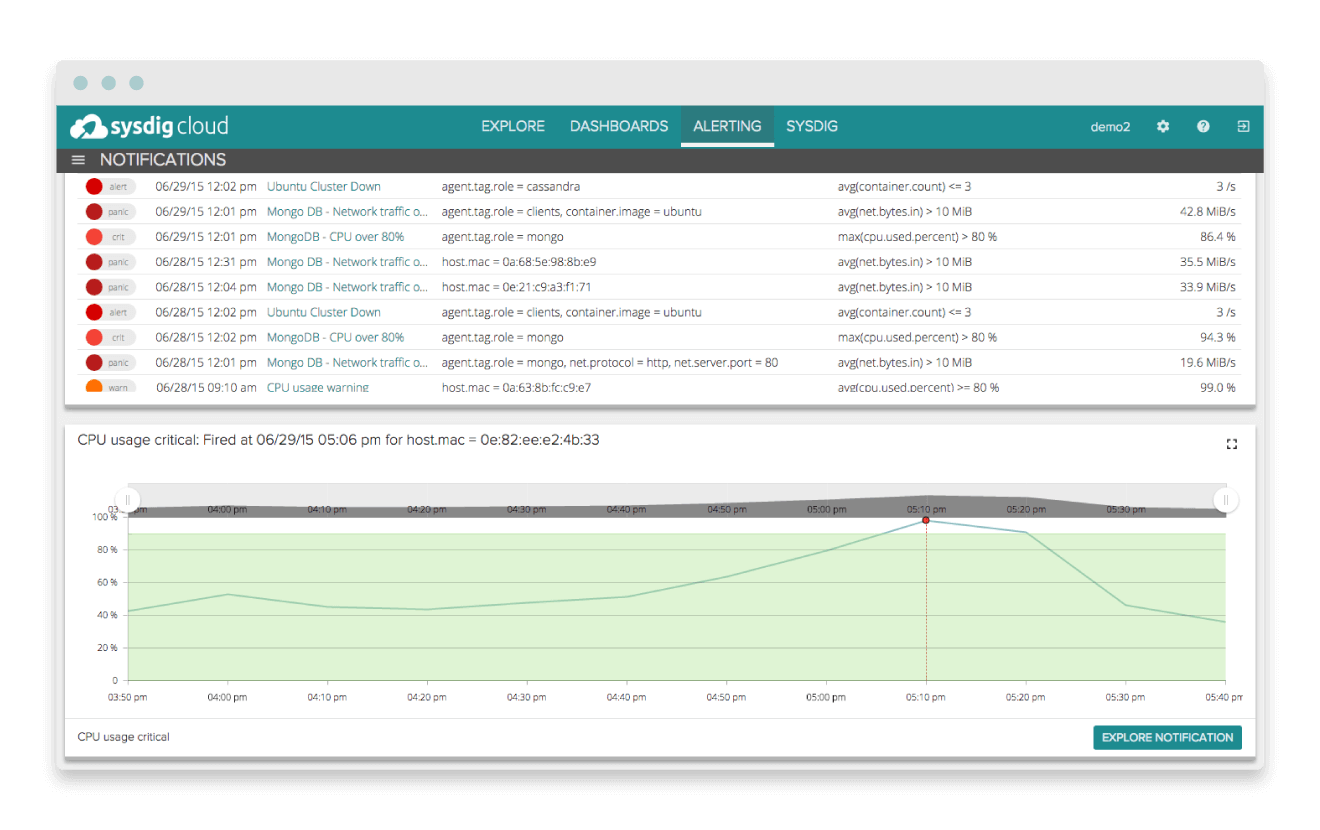
| Scenario | New Relic | Datadog |
|---|---|---|
| Available | [x] | [x] |
| Getting Slow | [^] | [*] |
| Too Many Errors | [x] | [*] |
| Record Response Times | [^] | [*] |
* possible but not tested
^ requires premium tier
| Scenario | New Relic | Datadog |
|---|---|---|
| Redis down | [x] | [*] |
| MySQL down | [x] | [*] |
| PostgreSLQ down | [x] | [*] |
| RabbitMQ down | [x] | [x] |
| Queue Growing | [ ] | [x] |
* possible but not tested
- New Relic relies on our health checks
* only tested JVM applications
* only tested JVM applications
^ New Relic checks from their data center
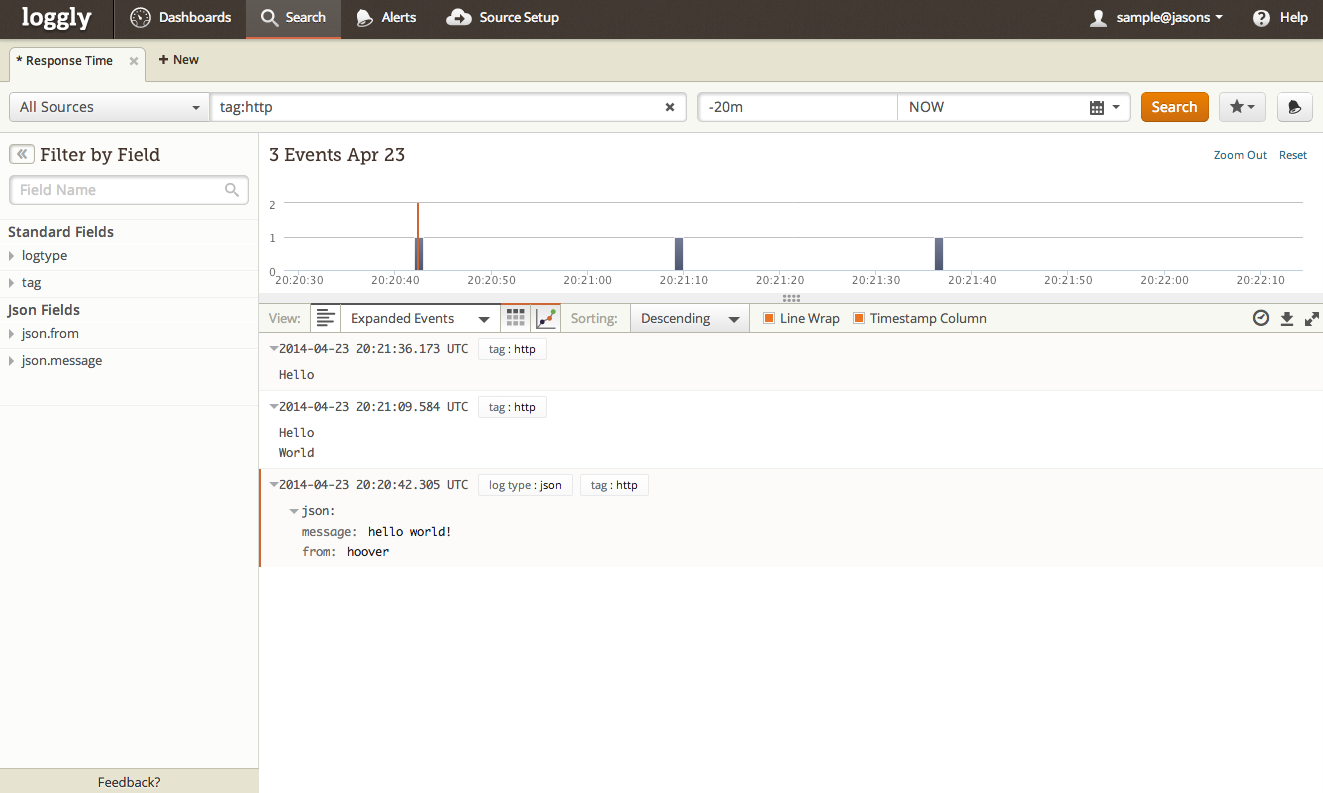
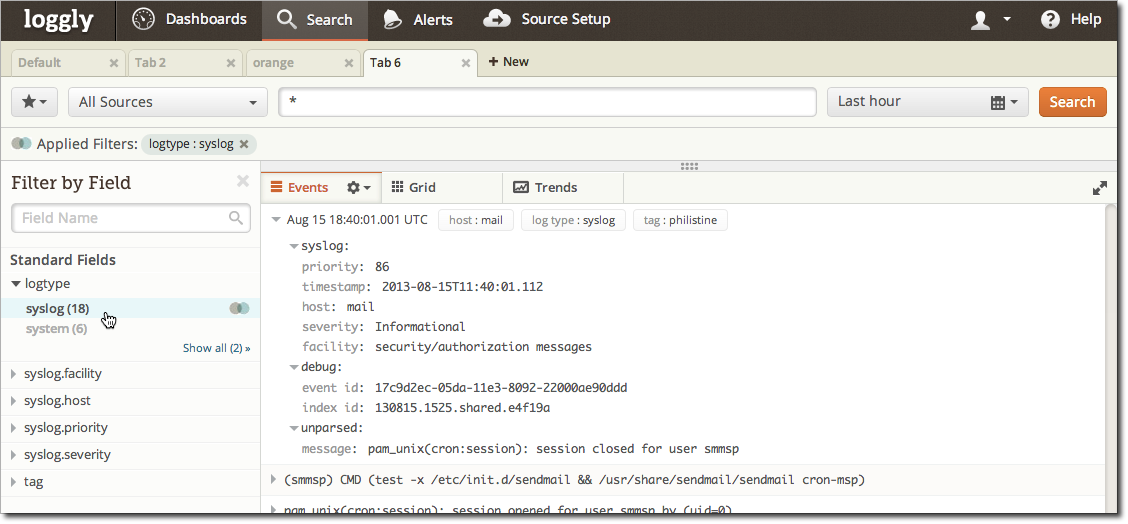
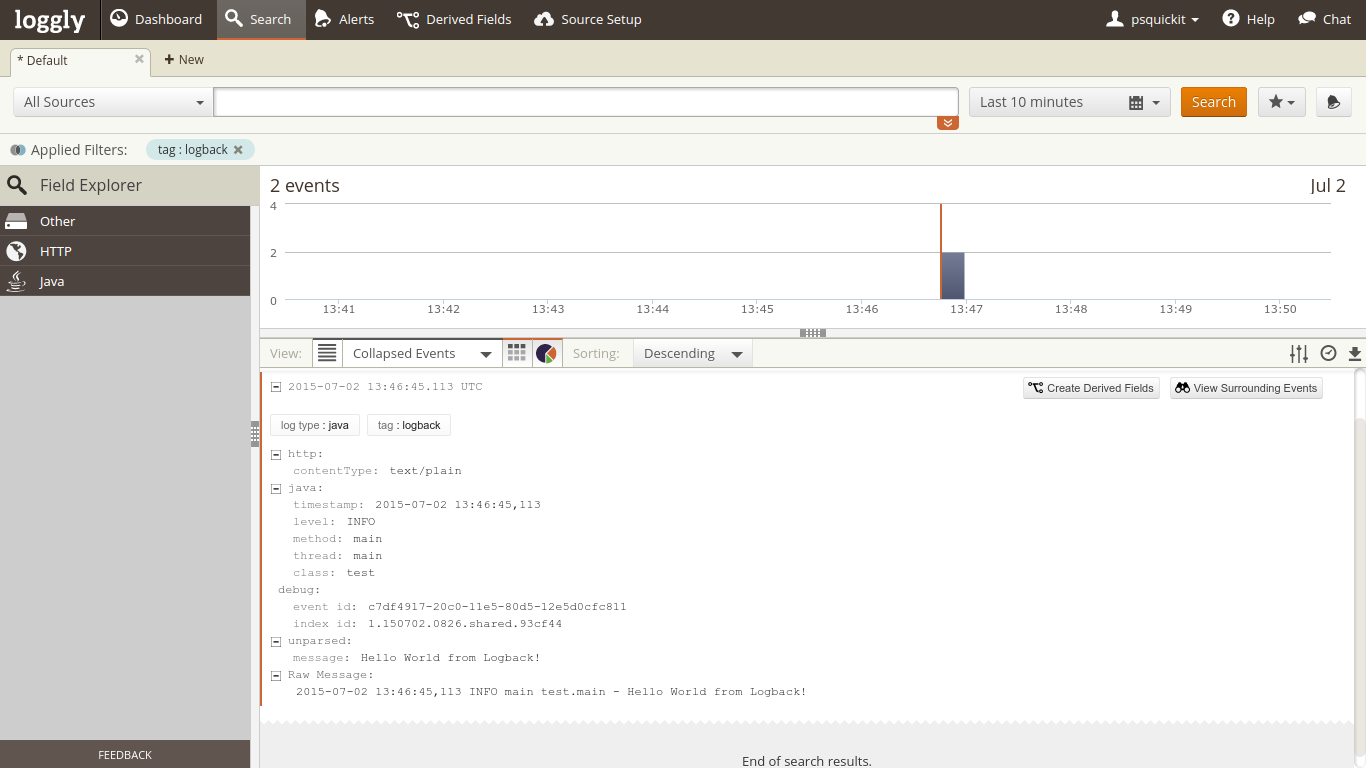
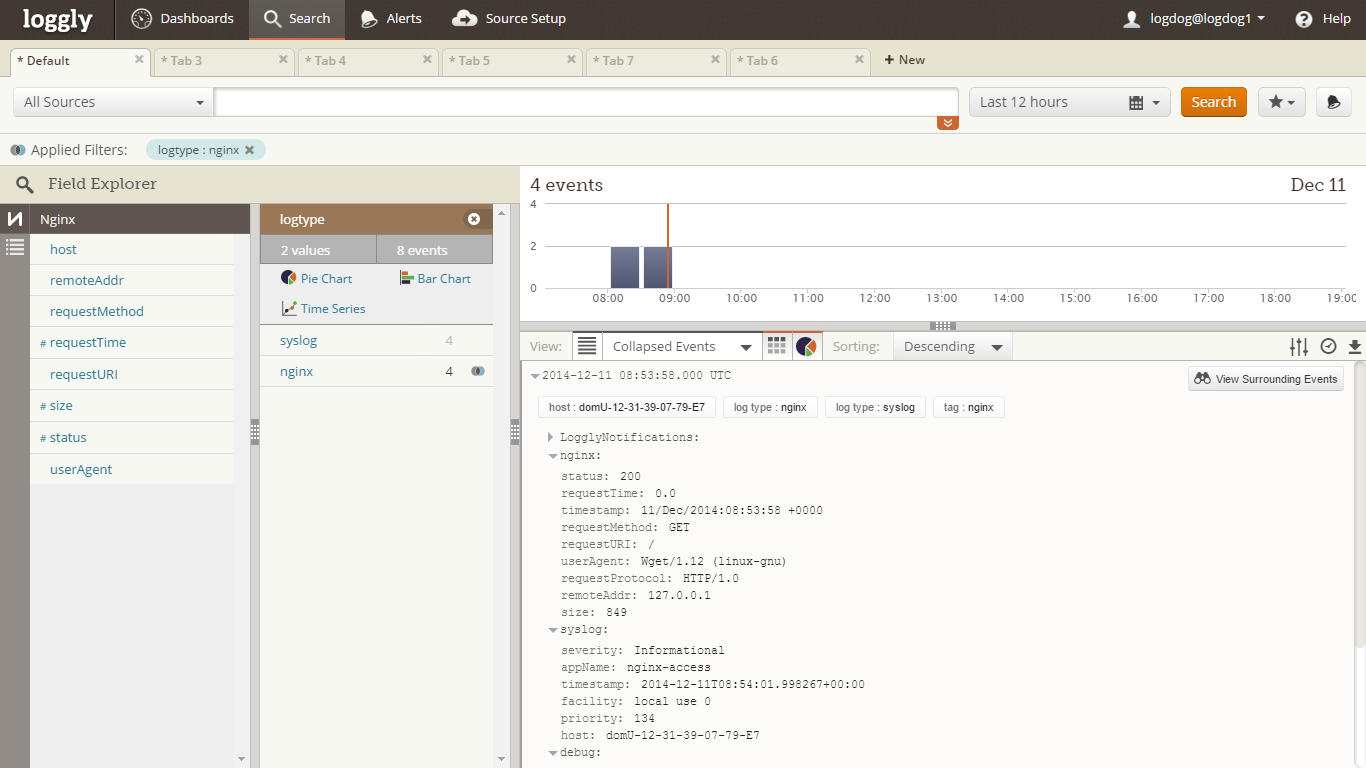
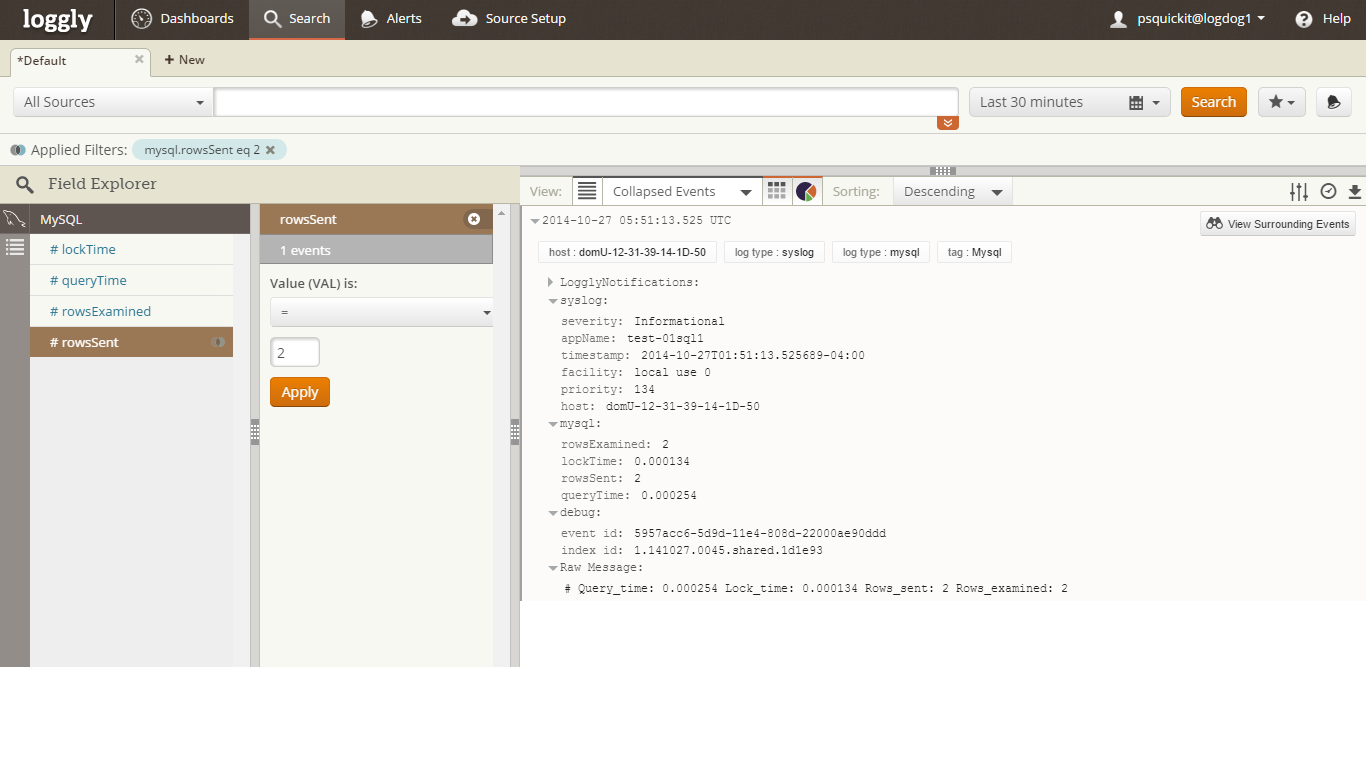
| Attribute | Loggly | Found | ELK |
|---|---|---|---|
| Message Format | syslog | multiple | multiple |
| Free Tier | [x] | [ ] | [x] |
| Alerting | [*] | [^] | [^] |
| Automatic Parsing | [*] | [#] | [x] |
| Integrations | [*] | [#] | [#] |
* available but not tested
^ coming soon
# hand configured
{
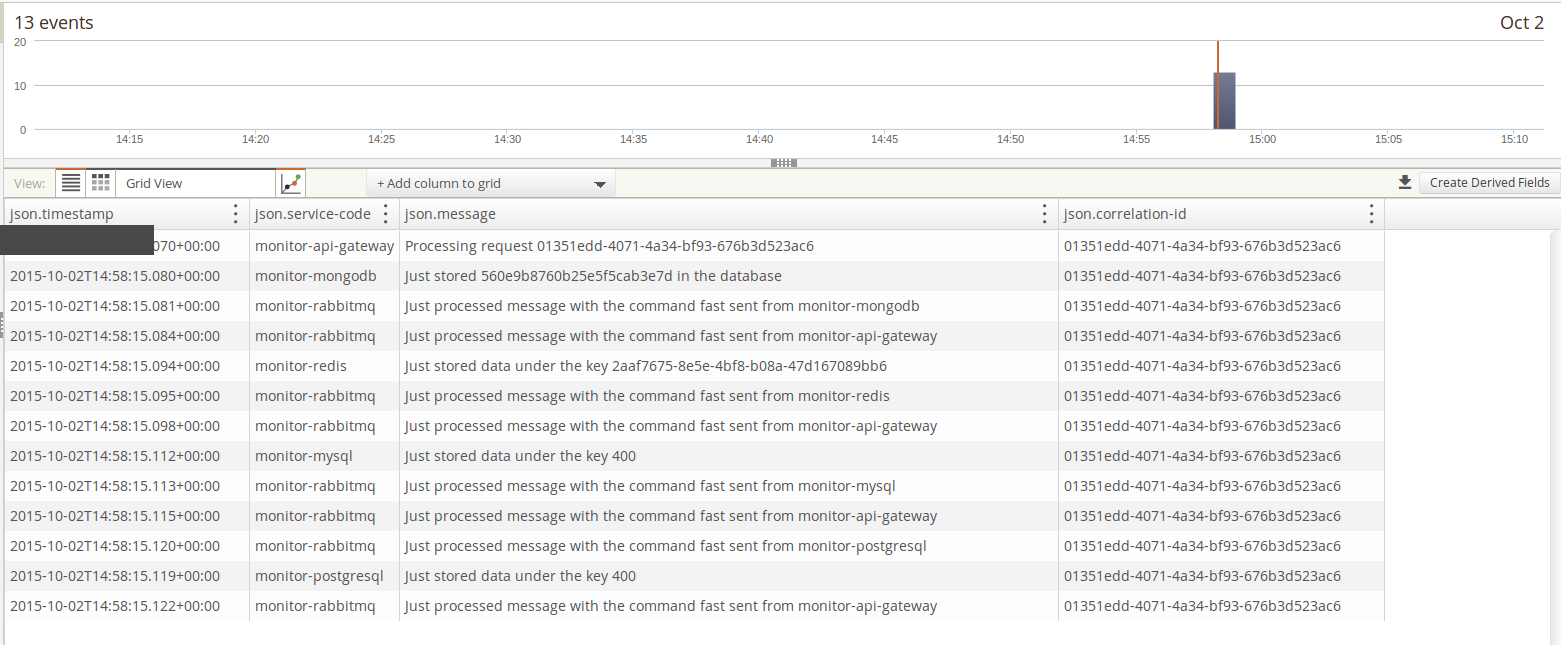
"timestamp": "2015-10-02T15:02:12.455+00:00",
"message": "Just processed message with the command fast sent from monitor-api-gateway",
"component": "org.kurron.example.rest.inbound.MessageProcessor",
"level": "WARN",
"service-code": "monitor-rabbitmq",
"realm": "Nashua Endurance Lab",
"service-instance": "1",
"message-code": "2008",
"correlation-id": "54356aa8-ea9a-4dc8-946c-73b3b26b33f6",
"tags": [
"QA"
]
}{
"log": "2015-09-30 19:36:45 16 [Note] InnoDB: The InnoDB memory heap is disabled\n",
"stream": "stderr",
"time": "2015-09-30T19:36:45.033111964Z"
}{
"timestamp": "2013-10-11T22:14:15.003123Z",
"travel": {
"airplane": "jumbo",
"mileage": 2034
}
}By Ronald Kurr
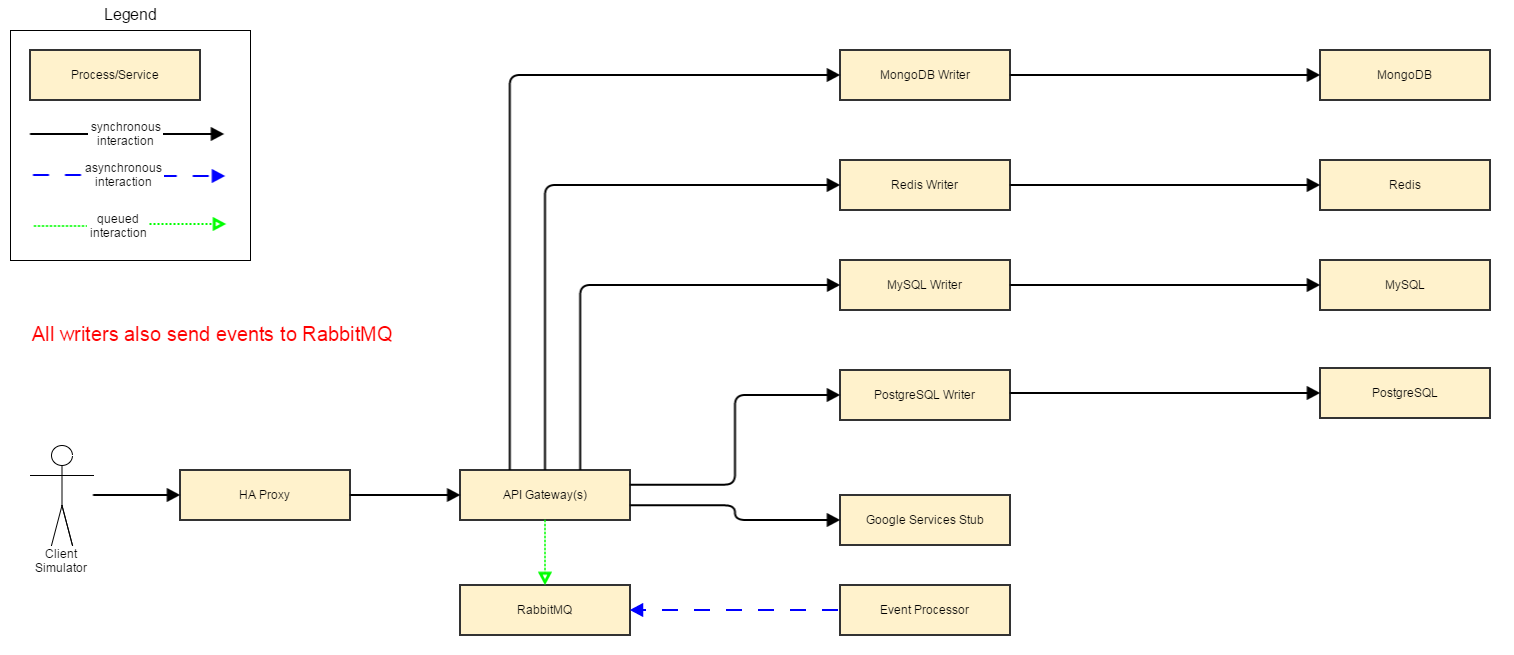
Proposal for application monitoring and diagnostic solutions


