Transformation and querying data

COMP63301 Data Engineering Concepts


Stian Soiland-Reyes

Intended Learning Outcomes

  1. Understanding the purpose of data transformation
  2. Ability to model transformed representations
  3. Reflect on optimisation challenges 
  4. Choose between streaming and batch querying
  5. Use of SQL beyond relational databases

Transformation considerations

What is the current representation? What does one row represent?

What is the purpose of the transformation? What questions will we ask?

What is the target representation? What should one row now represent?


Students
student_iddegreeentry_yearregion
1028802CS2024North
1278181CS+Math2026South
(20,000 rows)
Courses
course_idschoolcredits
COMP62301CS15
COMP62452CS10
(300 rows)
Enrollment
student_idcourse_idmark
1028802COMP6230178
1028802COMP6245266
1278181COMP6230181
(150,000 rows)
Engagement
event_idstudent_idcourse_idevent_timedurationresource_typecompleted
131211278181COMP623012025-12-0650videotrue
131221028802COMP624522026-02-1445videofalse
131231028802COMP624522026-02-209quiztrue
(3,000,000 rows)

Understanding the current schema

Inspect the database

mysql> SELECT * FROM Students LIMIT 2;
+------------+----------+------------+--------+
| student_id | degree   | entry_year | region |
+------------+----------+------------+--------+
|    1028802 | CS       |       2024 | North  |
|    1278181 | CS+Math  |       2026 | West   |
+------------+----------+------------+--------+
2 rows in set (0.00 sec)

Understanding the current schema

Relational schema notation

Students (student_id, degree, entry_year, region)

Courses (course_id, school, credits)

Enrollment (student_id, course_id, mark)

Engagement (event_id, students_id, course_id, event_time, duration,
                          resource_type, completed)

Students
student_iddegreeentry_yearregion
Courses
course_idschoolcredits
Enrollment
student_idcourse_idmark
Engagement
event_idstudent_idcourse_idevent_timedurationresource_typecompleted
mysql> DESCRIBE Students;
+------------+--------------+------+-----+---------+----------------+

| Field      | Type         | Null | Key | Default | Extra          |
+------------+--------------+------+-----+---------+----------------+

| student_id | int          | NO   | PRI | NULL    | auto_increment |
| degree     | varchar(100) | YES  |     | NULL    |                |
| entry_year | year         | YES  |     | NULL    |                |
| region     | varchar(50)  | YES  |     | NULL    |                |
+------------+--------------+------+-----+---------+----------------+

grain: per event per student per course

grain: per student per course

grain: per student

grain: per course

grain: one row represent what?

Students
student_iddegreeentry_yearregion
Courses
course_idschoolcredits
Enrollment
student_idcourse_idmark
Engagement
event_idstudent_idcourse_idevent_timedurationresource_typecompleted

Fact table: Append-only list of events

Dimension tables: Mostly static, attributes

Ralph Kimball, Margy Ross (2013):

The Data Warehouse Toolkit: The Definitive Guide to Dimensional Modeling, Third Edition
ISBN 978-1118530801
 

Engagement

Enrollment

Students

Courses

Kimball star schema:
The fact table is augmented by attributes in each of the dimensions.

facts

dimension

dimension

dimension

Events

dimension

Time

dimension

Understanding the current schema:

Make/generate UML Class Diagram

Transformation to.. what?

Consider what questions we want answered

How engaged was a student in a course?

How much time was spent on a course?

How many activities did each student complete?

Do engaged students achieve higher marks?

Data transformation create new data products to make questions (more easily) answerable

First: Decide on the grain of the desired table

Second: Which attributes do we wish were there?


EventSummary (student_id, course_id, event_count, total_duration, completion_rate, video_duration, reading_duration, last_activity)


StudentCourseFeatures  (student_id, course_id, mark,

engagement_level, degree, entry_year, region, school, event_count,

total_duration, completion_rate, video_duration, reading_duration, last_activity)

...


Sketching out transformed tables

Let's do it all in Python!

conn = sqlite3.connect(DB_FILE)

students = pd.read_sql("SELECT * FROM Students", conn)
courses = pd.read_sql("SELECT * FROM Courses", conn)
enrolments = pd.read_sql("SELECT * FROM Enrolment", conn)
engagement = pd.read_sql("SELECT * FROM Engagement", conn)
# Joining with Students
analytics = enrolments.merge(students,
    on="student_id",
    how="left"
)

# Join Courses
analytics = analytics.merge(courses,
    on="course_id",
    how="left"
)

Merging data frames in Pandas

joining data frames

Enrollment
student_idcourse_idmark
1028802COMP6230178
Courses
course_idschoolcredits
COMP62301CS15
Students
student_iddegreeentry_yearregion
1028802CS2024North
Analytics
student_idcourse_idmarkdegreeentry_yearregionschoolcredits
1028802COMP6230178CS2024NorthCS15
engagements = engagements.sort_values(
    ["student_id", "course_id", "event_time"]
)

event_summary = (engagements
    .groupby(
        ["student_id", "course_id"]
    )
    .agg(
        event_count=("event_id", "count"),
        total_duration=("duration", "sum"),
        completion_rate=("completed", "mean")
    )
)

Aggregate columns

Engagement
event_idstudent_idcourse_idevent_timedurationresource_typecompleted
131221028802COMP624522026-02-1445videofalse
131231028802COMP624522026-02-209quiztrue
131211278181COMP623012025-12-0650videotrue
Event Summary
student_idcourse_idevent_counttotal_durationcompletion_rate
1028802COMP624522540.5
1278181COMP623011501
student_means = (
    analytics
    .groupby("student_id")["mark"]
    .mean()
)

analytics["student_mean_mark"] = (
    analytics["student_id"]
    .map(student_means)
)
def classify_risk(row):

    if pd.isna(row["event_count"]):
        return "High Risk"

    if row["mark"] < 40:
        return "High Risk"

    if row["completion_rate"] < 0.5:
        return "Medium Risk"

    if row["event_count"] < 5:
        return "Medium Risk"

    return "Low Risk"

analytics["risk_band"] = (
    analytics
    .apply(
        classify_risk,
        axis=1
    )
)

Adding derived columns calculated in Python

student_idcourse_idmarkengagement_leveldegreeentry_yearregionschoolcreditsevent_counttotal_durationcompletion_ratevideo_durationlast_activityreading_durationstudent_mean_markcourse_mean_markengagement_bandrisk_bandabove_student_averageabove_course_averagedays_since_last_activitydegree_mean_markdegree_mean_events
124464.019.82Mathematics2025NorthMaths40188580.6112592026-07-2910170.17558.723LowLow RiskFalseTrue3464.59319.628
11083.719.82Mathematics2025NorthMaths10159450.6671032026-08-1148070.17565.867LowLow RiskTrueTrue2164.59319.628
117280.319.82Mathematics2025NorthMaths202312890.52272026-08-1569970.17569.430MediumLow RiskTrueTrue1764.59319.628
student_idcourse_idmarkengagement_leveldegreeentry_yearregionschoolcreditsevent_counttotal_durationcompletion_ratevideo_durationlast_activityreading_durationstudent_mean_markcourse_mean_markengagement_bandrisk_bandabove_student_averageabove_course_averagedays_since_last_activitydegree_mean_markdegree_mean_events
124464.019.82Mathematics2025NorthMaths40188580.6112592026-07-2910170.17558.723LowLow RiskFalseTrue3464.59319.628
11083.719.82Mathematics2025NorthMaths10159450.6671032026-08-1148070.17565.867LowLow RiskTrueTrue2164.59319.628
117280.319.82Mathematics2025NorthMaths202312890.52272026-08-1569970.17569.430MediumLow RiskTrueTrue1764.59319.628

Output statistics
----------------------------------------------------------------------
Rows: 149,983
Columns: 24 
Execution time: 16.7 seconds

Scalability challenge (Python+Pandas):

Querying a small 200 MB database takes 17 seconds at full CPU, using GBs of RAM

Enrollment
student_idcourse_idmark
1028802COMP6230178
1028802COMP6245266
1278181COMP6230181
(150,000 rows)
Engagement
event_idstudents_idcourse_idevent_timedurationresource_typecompleted
131211278181COMP623012025-12-0650videotrue
131221028802COMP624522026-02-1445videofalse
131231028802COMP624522026-02-209quiztrue
(3,000,000 rows)

Python is not a compiled language!

150k * 3M = 450 million rows combinations.

Each row revisited for each join/group.

All is kept in memory

No query optimization, indexes.

Python limitations

OK, let's do it all in SQL then!


CREATE TABLE StudentCourseAnalytics AS

WITH event_summary AS (
    SELECT
        student_id,
        course_id,
        COUNT(event_id) AS event_count,
        SUM(duration) AS total_duration,
        AVG(completed) AS completion_rate,
        SUM(
            CASE
                WHEN resource_type = 'video'
                THEN duration
            END
        ) AS video_duration,
        SUM(
            CASE
                WHEN resource_type = 'reading'
                THEN duration
            END
        ) AS reading_duration,
        MAX(event_time) AS last_activity
    FROM LearningEvents
    GROUP BY student_id, course_id
),

enrolment_details AS (
    SELECT
        e.student_id,
        e.course_id,
        e.mark,
        e.engagement_level,
        s.degree,
        s.entry_year,
        s.region,
        c.school,
        c.credits,
        es.event_count,
        es.total_duration,
        es.completion_rate,
        es.video_duration,
        es.reading_duration,
        es.last_activity,
        AVG(e.mark) OVER (
            PARTITION BY e.student_id
        ) AS student_mean_mark,
        AVG(e.mark) OVER (
            PARTITION BY e.course_id
        ) AS course_mean_mark
    FROM Enrolments AS e
    LEFT JOIN Students AS s
        ON s.student_id = e.student_id
    LEFT JOIN Courses AS c
        ON c.course_id = e.course_id
    LEFT JOIN event_summary AS es
        ON es.student_id = e.student_id
       AND es.course_id = e.course_id
),

classified AS (
    SELECT
        *,
        CASE
            WHEN event_count IS NULL THEN 'No Activity'
            WHEN event_count > 50 THEN 'High'
            WHEN event_count > 20 THEN 'Medium'
            ELSE 'Low'
        END AS engagement_band,
        CASE
            WHEN event_count IS NULL THEN 'High Risk'
            WHEN mark < 40 THEN 'High Risk'
            WHEN completion_rate < 0.5 THEN 'Medium Risk'
            WHEN event_count < 5 THEN 'Medium Risk'
            ELSE 'Low Risk'
        END AS risk_band,
        mark > student_mean_mark
            AS above_student_average,
        mark > course_mean_mark
            AS above_course_average,
        CASE
            WHEN last_activity IS NULL THEN 999
            ELSE CAST(
                julianday('2026-09-01')
                - julianday(last_activity)
                AS INTEGER
            )
        END AS days_since_last_activity,
        COALESCE(event_count, 0)
            AS filled_event_count,
        COALESCE(total_duration, 0)
            AS filled_total_duration,
        COALESCE(completion_rate, 0)
            AS filled_completion_rate,
        COALESCE(video_duration, 0)
            AS filled_video_duration,
        COALESCE(reading_duration, 0)
            AS filled_reading_duration
    FROM enrolment_details
),

degree_statistics AS (
    SELECT
        degree,
        AVG(mark) AS degree_mean_mark,
        AVG(filled_event_count) AS degree_mean_events
    FROM classified
    GROUP BY degree
)

SELECT
    classified.student_id,
    classified.course_id,
    classified.mark,
    classified.engagement_level,
    classified.degree,
    classified.entry_year,
    classified.region,
    classified.school,
    classified.credits,
    classified.filled_event_count AS event_count,
    classified.filled_total_duration AS total_duration,
    classified.filled_completion_rate AS completion_rate,
    classified.filled_video_duration AS video_duration,
    classified.last_activity,
    classified.filled_reading_duration AS reading_duration,
    classified.student_mean_mark,
    classified.course_mean_mark,
    classified.engagement_band,
    classified.risk_band,
    classified.above_student_average,
    classified.above_course_average,
    classified.days_since_last_activity,
    degree_statistics.degree_mean_mark,
    degree_statistics.degree_mean_events
FROM classified
LEFT JOIN degree_statistics
    ON degree_statistics.degree = classified.degree;

Using SQL WITH to create temporary tables for the big query


Aggregate columns created using AS 


Rows: 149,983
Columns: 24
Execution time: 4.2 seconds

Python+SQLite:

3-4 seconds, using less than 1% of RAM

~ 6x speed-up


Database: myinner_db
User: mynonsuperuser
Rows: 149,983
Columns: 24
Execution time: 2.3 seconds

.. Python+PostgreSQL

2 seconds, using less than 1.6% of RAM

~ 9x speed-up


Rule of thumb:

Let the data source handle filtering, joining, aggregation if it reduces data movement or repetitive executions.

Another VIEW

No more mega-query

CREATE VIEW EventSummary AS
SELECT
    student_id,
    course_id,
    COUNT(event_id) AS event_count,
    SUM(duration) AS total_duration,
    AVG(completed) AS completion_rate,
    SUM(
        CASE
            WHEN resource_type = 'video' THEN duration
            ELSE 0
        END
    ) AS video_duration,
    SUM(
        CASE
            WHEN resource_type = 'reading' THEN duration
            ELSE 0
        END
    ) AS reading_duration,
    MAX(event_time) AS last_activity
FROM LearningEvents
GROUP BY
    student_id,
    course_id;

View containing aggregate columns

student_idcourse_idevent_counttotal_durationcompletion_ratevideo_durationreading_durationlast_activity
124472150.86125402026-07-29
110159450.671034802026-08-11
21041310330.772604162026-07-19
CREATE VIEW EnrolmentDetails AS
SELECT
    e.student_id,
    e.course_id,
    e.mark,
    e.engagement_level,
    s.degree,
    s.entry_year,
    s.region,
    c.school,
    c.credits
FROM Enrolments AS e
LEFT JOIN Students AS s
    ON s.student_id = e.student_id
LEFT JOIN Courses AS c
    ON c.course_id = e.course_id;

View from merging (JOIN) tables

student_id course_id mark engagement_level degree entry_year region school credits
1 244 64.0 19.82 Mathematics 2025 North Maths 40
1 10 83.7 19.82 Mathematics 2025 North Maths 10
2 104 39.1 11.27 Data Science 2024 South CS 20
3 109 48.4 52.27 Data Science 2023 North NULL NULL
CREATE VIEW StudentCourseFeatures AS
SELECT
    ed.student_id,
    ed.course_id,
    ed.mark,
    ed.engagement_level,
    ed.degree,
    ed.entry_year,
    ed.region,
    ed.school,
    ed.credits,
    es.event_count,
    es.total_duration,
    es.completion_rate,
    es.video_duration,
    es.reading_duration,
    es.last_activity
FROM EnrolmentDetails AS ed
LEFT JOIN EventSummary AS es
    ON es.student_id = ed.student_id
   AND es.course_id = ed.course_id;

View from merging (JOIN) with other views

student_idcourse_idmarkengagement_leveldegreeentry_yearregionschoolcreditsevent_counttotal_durationcompletion_ratevideo_durationreading_durationlast_activity
11083.719.82Mathematics2025NorthMaths10159450.671034802026-08-11
110179.219.82Mathematics2025NorthMaths10199950.841682002026-08-13
117280.319.82Mathematics2025NorthMaths202312890.5276992026-08-15
SELECT
  student_id,
  course_id,
  degree,
  mark,
  event_count,
  completion_rate,
  days_since_last_activity
FROM StudentCourseAnalyticsFinal
WHERE risk_band = 'High Risk'
ORDER BY days_since_last_activity DESC
LIMIT 10

Each view designed to answer a set of possible questions

CREATE VIEW StudentCourseClassified AS
SELECT
    student_id,
    course_id,
    mark,
    engagement_level,
    degree,
    entry_year,
    region,
    school,
    credits,
    COALESCE(event_count, 0) AS event_count,
    COALESCE(total_duration, 0) AS total_duration,
    COALESCE(completion_rate, 0) AS completion_rate,
    COALESCE(video_duration, 0) AS video_duration,
    COALESCE(reading_duration, 0) AS reading_duration,
    last_activity,
    student_mean_mark,
    course_mean_mark,
    CASE
        WHEN event_count IS NULL THEN 'No Activity'
        WHEN event_count > 50 THEN 'High'
        WHEN event_count > 20 THEN 'Medium'
        ELSE 'Low'
    END AS engagement_band,
    CASE
        WHEN event_count IS NULL THEN 'High Risk'
        WHEN mark < 40 THEN 'High Risk'
        WHEN completion_rate < 0.5 THEN 'Medium Risk'
        WHEN event_count < 5 THEN 'Medium Risk'
        ELSE 'Low Risk'
    END AS risk_band,
    mark > student_mean_mark AS above_student_average,
    mark > course_mean_mark AS above_course_average,
    CASE
        WHEN last_activity IS NULL THEN 999
        ELSE CAST(
            julianday('2026-09-01') - julianday(last_activity)
            AS INTEGER
        )
    END AS days_since_last_activity
FROM StudentCourseAnalytics;
student_id course_id mark event_count completion_rate engagement_band risk_band above_student_average above_course_average days_since_last_activity
1 172 80.3 23 0.52 Medium Low Risk True True 17
1 244 64.0 18 0.61 Low Low Risk False True 34
2 104 39.1 13 0.77 Low High Risk False False 44

Transforming semi-structured data

Identify (implied) enumerators

video_summary = (
    events[
        events["resource_type"] == "video"
    ]
    .groupby(
        ["student_id", "course_id"]
    )
)
Engagement
event_idstudent_idcourse_idevent_timedurationresource_typecompleted
131211278181COMP623012025-12-0650videotrue
131221028802COMP624522026-02-1445videofalse
131231028802COMP624522026-02-209quiztrue
(3,000,000 rows)
myinner_db=> SELECT DISTINCT resource_type
               FROM learningevents ;
 resource_type 
---------------
 exercise
 quiz
 reading
 video

Pivot aggregation per feature

Engagement
event_idstudent_idcourse_idevent_timedurationresource_typecompleted
131211278181COMP623012025-12-0650videotrue
131221028802COMP624522026-02-1445videofalse
131231028802COMP624522026-02-209quiztrue
(3,000,000 rows)
EngagementFeatures
student_idcourse_idvideo_countvideo_durationvideo_completionquiz_countquiz_completion
1244122590.8181.0
210452600.7440/75

Columns per resource_type

Split feature tables

Engagement
event_idstudent_idcourse_idevent_timedurationresource_typecompleted
131211278181COMP623012025-12-0650videotrue
131221028802COMP624522026-02-1445videofalse
131231028802COMP624522026-02-209quiztrue
(3,000,000 rows)
VideoFeatures
student_idcourse_idvideo_countvideo_durationvideo_completion
1278181COMP62452122590.81
1028802COMP6230152600.74
(~ 120,000 rows)
QuizFeatures
student_idcourse_idquiz_countquiz_completion
1278181COMP6245281.0
1028802COMP6230140.75

Feature tables per resource_type

There may be multiple valid feature tables!

Slowly Changing Dimension (SCD)

Engagement
event_idstudent_idcourse_idevent_timedurationresource_typecompleted
4142312442025-12-0450videofalse
4142412442026-02-1845videotrue
(3,000,000 rows)
VideoFeatures
student_idcourse_idvideo_countvideo_durationvideo_completionuntil
124491200.892025-12-01
1244101700.802026-01-01
1244101700.802026-02-01
1244112150.822026-03-01
(~ 300,000 rows)

Feature tables per resource_type per time window (start--until)

Trends can be detected by aggregating per time window

Time
monthacademic_yearfromto
2025-122025/20262025-12-012025-12-31
2026-012025/20262026-01-012026-01-31

Identifying multi-dimensional data

Courses
course_idschoolcreditskeywords
COMP63301CS15database, data engineering
COMP62452CS & Business10data engineering,machine learning,statistics

data engineering

database

machine learning

statistics

CS

Business

Semi-structured list of values hiding inside a string value — what is the format?

Decomposing semi-structured values

Courses
course_idschoolcreditskeywords
COMP63301CS15database, data engineering
COMP62452CS & Business10data engineering,machine learning, statistics

data engineering

database

machine learning

statistics

CourseKeywords
course_idkeyword
COMP63301database
COMP63301data engineering
COMP62452data engineering
COMP62452machine learning
COMP62452statistics
Keywords
keywordalias
databasedb
data engineering
machine learningML
statisticsstats

Clean

Validate

Split values

Clean

Match

Document concept scheme

CourseSchools
course_idschool
COMP63301CS
COMP62452CS
COMP62452Business
Schools
school_idfull_name
CSDepartment of Computer Science
BusinessAlliance Manchester Business School

Embedded semi-structured data

CREATE VIEW StudentCourseFeatureDocument AS
SELECT
    student_id,
    course_id,
    mark,

    jsonb_build_object(

        'video',
        jsonb_build_object(
            'duration', video_duration
        ),

        'reading',
        jsonb_build_object(
            'duration', reading_duration
        ),

        'engagement',
        jsonb_build_object(
            'event_count', event_count,
            'completion_rate', completion_rate
        )

    ) AS features

FROM StudentCourseFeatures;
student_id course_id mark features (JSONB)
1 10 83.7
{
  "video": {
    "duration": 103
  },
  "reading": {
    "duration": 480
  },
  "engagement": {
    "event_count": 15,
    "completion_rate": 0.67
  }
}
1 101 79.2
{
  "video": {
    "duration": 168
  },
  "reading": {
    "duration": 200
  },
  "engagement": {
    "event_count": 19,
    "completion_rate": 0.84
  }
}
1 168 67.2
{
  "video": {
    "duration": 298
  },
  "reading": {
    "duration": 199
  },
  "engagement": {
    "event_count": 18,
    "completion_rate": 0.89
  }
}

Building JSON from the database, prepared as data products exposed by API

SELECT
    student_id,
    course_id
FROM StudentCourseFeatureDocument
WHERE
    (features->'video'->>'duration')::integer
    > 200;
student_id course_id mark features (JSONB)
1 10 83.7
{
  "video": {
    "duration": 103
  },
  "reading": {
    "duration": 480
  },
  "engagement": {
    "event_count": 15,
    "completion_rate": 0.67
  }
}
1 101 79.2
{
  "video": {
    "duration": 168
  },
  "reading": {
    "duration": 200
  },
  "engagement": {
    "event_count": 19,
    "completion_rate": 0.84
  }
}
1 168 67.2
{
  "video": {
    "duration": 298
  },
  "reading": {
    "duration": 199
  },
  "engagement": {
    "event_count": 18,
    "completion_rate": 0.89
  }
}

Querying semi-structured JSON in relational databases

student_idcourse_id
1168
CREATE VIEW StudentCourseFlattenedFeatures AS
SELECT
    student_id,
    course_id,
    
    (features->'video'->>'duration')::integer
        AS video_duration,

    (features->'reading'->>'duration')::integer
        AS reading_duration,

    (features->'engagement'->>'event_count')::integer
        AS event_count,

    (features->'engagement'->>'completion_rate')::numeric
        AS completion_rate

FROM StudentCourseFeatureDocument;
student_id course_id mark features (JSONB)
1 10 83.7
{
  "video": {
    "duration": 103
  },
  "reading": {
    "duration": 480
  },
  "engagement": {
    "event_count": 15,
    "completion_rate": 0.67
  }
}
1 101 79.2
{
  "video": {
    "duration": 168
  },
  "reading": {
    "duration": 200
  },
  "engagement": {
    "event_count": 19,
    "completion_rate": 0.84
  }
}
1 168 67.2
{
  "video": {
    "duration": 298
  },
  "reading": {
    "duration": 199
  },
  "engagement": {
    "event_count": 18,
    "completion_rate": 0.89
  }
}

Transform from JSON to a feature table

StudentCourse FlattenedFeatures
student_idcourse_idvideo_durationreading_durationevent_countcompletion_rate
110103480150.67
2104168200190.84

Life of a query

SQL query
issued

Parsing and conversion to bytecode

Query planning and optimization

Query execution

Results returned

Adapted from Figure 8.2 in Fundamentals of Data engineering

🧑🏾‍💻

📃

🧐

👷🏽‍♀️

🧑🏿‍🍳

SQL is a declarative language

SQL instructions says what you want, not how

Relational databases are able to optimize the query

e.g. which order to join tables or which rows to examine first

Queries are (largely) independent of implementation details (e.g. file vs memory vs distributed)

Restructuring the relational table design can help/complicate query writing and/or query execution


Query optimization

SELECT Title, Journal_Title
FROM articles
JOIN journals;

Careless use of database joins may lead to row explosion or inefficient database load

The Fisher Thermodynamics of Quasi-Probabilities Acta Crystallographica Section E Crystallograp...
The Fisher Thermodynamics of Quasi-Probabilities Agriculture
The Fisher Thermodynamics of Quasi-Probabilities Agronomy
The Fisher Thermodynamics of Quasi-Probabilities Animals
The Fisher Thermodynamics of Quasi-Probabilities Applied Sciences
... ...
Metagenomic Analysis of Upwelling-Affected Bra... Toxics
Metagenomic Analysis of Upwelling-Affected Bra... Toxins
Metagenomic Analysis of Upwelling-Affected Bra... Vaccines
Metagenomic Analysis of Upwelling-Affected Bra... Viruses
Metagenomic Analysis of Upwelling-Affected Bra... Water

51051 rows × 2 columns

How can we improve query performance?

  • Prejoin data: Denormalisation or materialised views
  • Reduce complexity of query
    • Multiple simpler queries may be faster (but use more data transfer)
    • But: Avoid full-table scan SELECT *
  • Add indexes on frequently queried columns
  • Use EXPLAIN to reveal the query plan
EXPLAIN SELECT Title, Journal_Title
FROM articles
JOIN journals 
ON (articles.ISSNs = journals.ISSNs)
ORDER BY Journal_Title;
0 Init 0 32 0 None 0 None
1 SorterOpen 2 4 0 k(1,B) 0 None
2 OpenRead 0 5 0 7 0 None
3 OpenRead 1 3 0 5 0 None
4 Rewind 0 24 0 None 0 None
5 Once 0 14 0 None 0 None
6 OpenAutoindex 3 3 0 k(3,B,,) 0 None
7 Rewind 1 14 0 None 0 None
8 Column 1 2 2 None 0 None
9 Column 1 4 3 None 0 None
10 Rowid 1 4 0 None 0 None
11 MakeRecord 2 3 1 None 0 None
12 IdxInsert 3 1 0 None 16 None
13 Next 1 8 0 None 3 None
14 Column 0 6 5 None 0 None
15 IsNull 5 23 0 None 0 None
16 SeekGE 3 23 5 1 0 None
17 IdxGT 3 23 5 1 0 None
18 Column 0 1 7 None 0 None
19 Column 3 1 6 None 0 None
20 MakeRecord 6 2 9 None 0 None
21 SorterInsert 2 9 6 2 0 None
22 Next 3 17 0 None 0 None
23 Next 0 5 0 None 1 None
24 OpenPseudo 4 10 4 None 0 None
25 SorterSort 2 31 0 None 0 None
26 SorterData 2 10 4 None 0 None
27 Column 4 0 8 None 0 None
28 Column 4 1 7 None 0 None
29 ResultRow 7 2 0 None 0 None
30 SorterNext 2 26 0 None 0 None
31 Halt 0 0 0 None 0 None
32 Transaction 0 0 38 0 1 None
33 Goto 0 1 0 None 0 None


0 Init 0 23 0 None 0 None
1 OpenRead 0 5 0 7 0 None
2 OpenRead 1 3 0 5 0 None
3 Rewind 0 22 0 None 0 None
4 Once 0 13 0 None 0 None
5 OpenAutoindex 2 3 0 k(3,B,,) 0 None
6 Rewind 1 13 0 None 0 None
7 Column 1 2 2 None 0 None
8 Column 1 4 3 None 0 None
9 Rowid 1 4 0 None 0 None
10 MakeRecord 2 3 1 None 0 None
11 IdxInsert 2 1 0 None 16 None
12 Next 1 7 0 None 3 None
13 Column 0 6 5 None 0 None
14 IsNull 5 21 0 None 0 None
15 SeekGE 2 21 5 1 0 None
16 IdxGT 2 21 5 1 0 None
17 Column 0 1 6 None 0 None
18 Column 2 1 7 None 0 None
19 ResultRow 6 2 0 None 0 None
20 Next 2 16 0 None 0 None
21 Next 0 4 0 None 1 None
22 Halt 0 0 0 None 0 None
23 Transaction 0 0 38 0 1 None
24 Goto 0 1 0 None 0 None


EXPLAIN SELECT Title, Journal_Title
FROM articles
JOIN journals 
ON (articles.ISSNs = journals.ISSNs);

Using EXPLAIN to reveal the query plan and compare equivalent queries

How can we improve query performance? #2

  • Consider impact of transactions and concurrency
  • Vacuum dead records
  • Ensure query results can be cached
    • Avoid many almost-same queries
    • Use prepared statements with parameters, don't embed values 
SELECT Title, Authors, ISSNs, Year
FROM Articles
WHERE ISSNs = '2056-9890' AND Month=2 AND YEAR=2015 ;
pd.read_sql_query("""
SELECT Title, Authors, ISSNs, Year
FROM Articles
WHERE ISSNs=? AND Month=? AND YEAR=? ;
""", db, 
params=['2056-9890', 2, 2015]).head()

Querying data streams

Streaming architectures

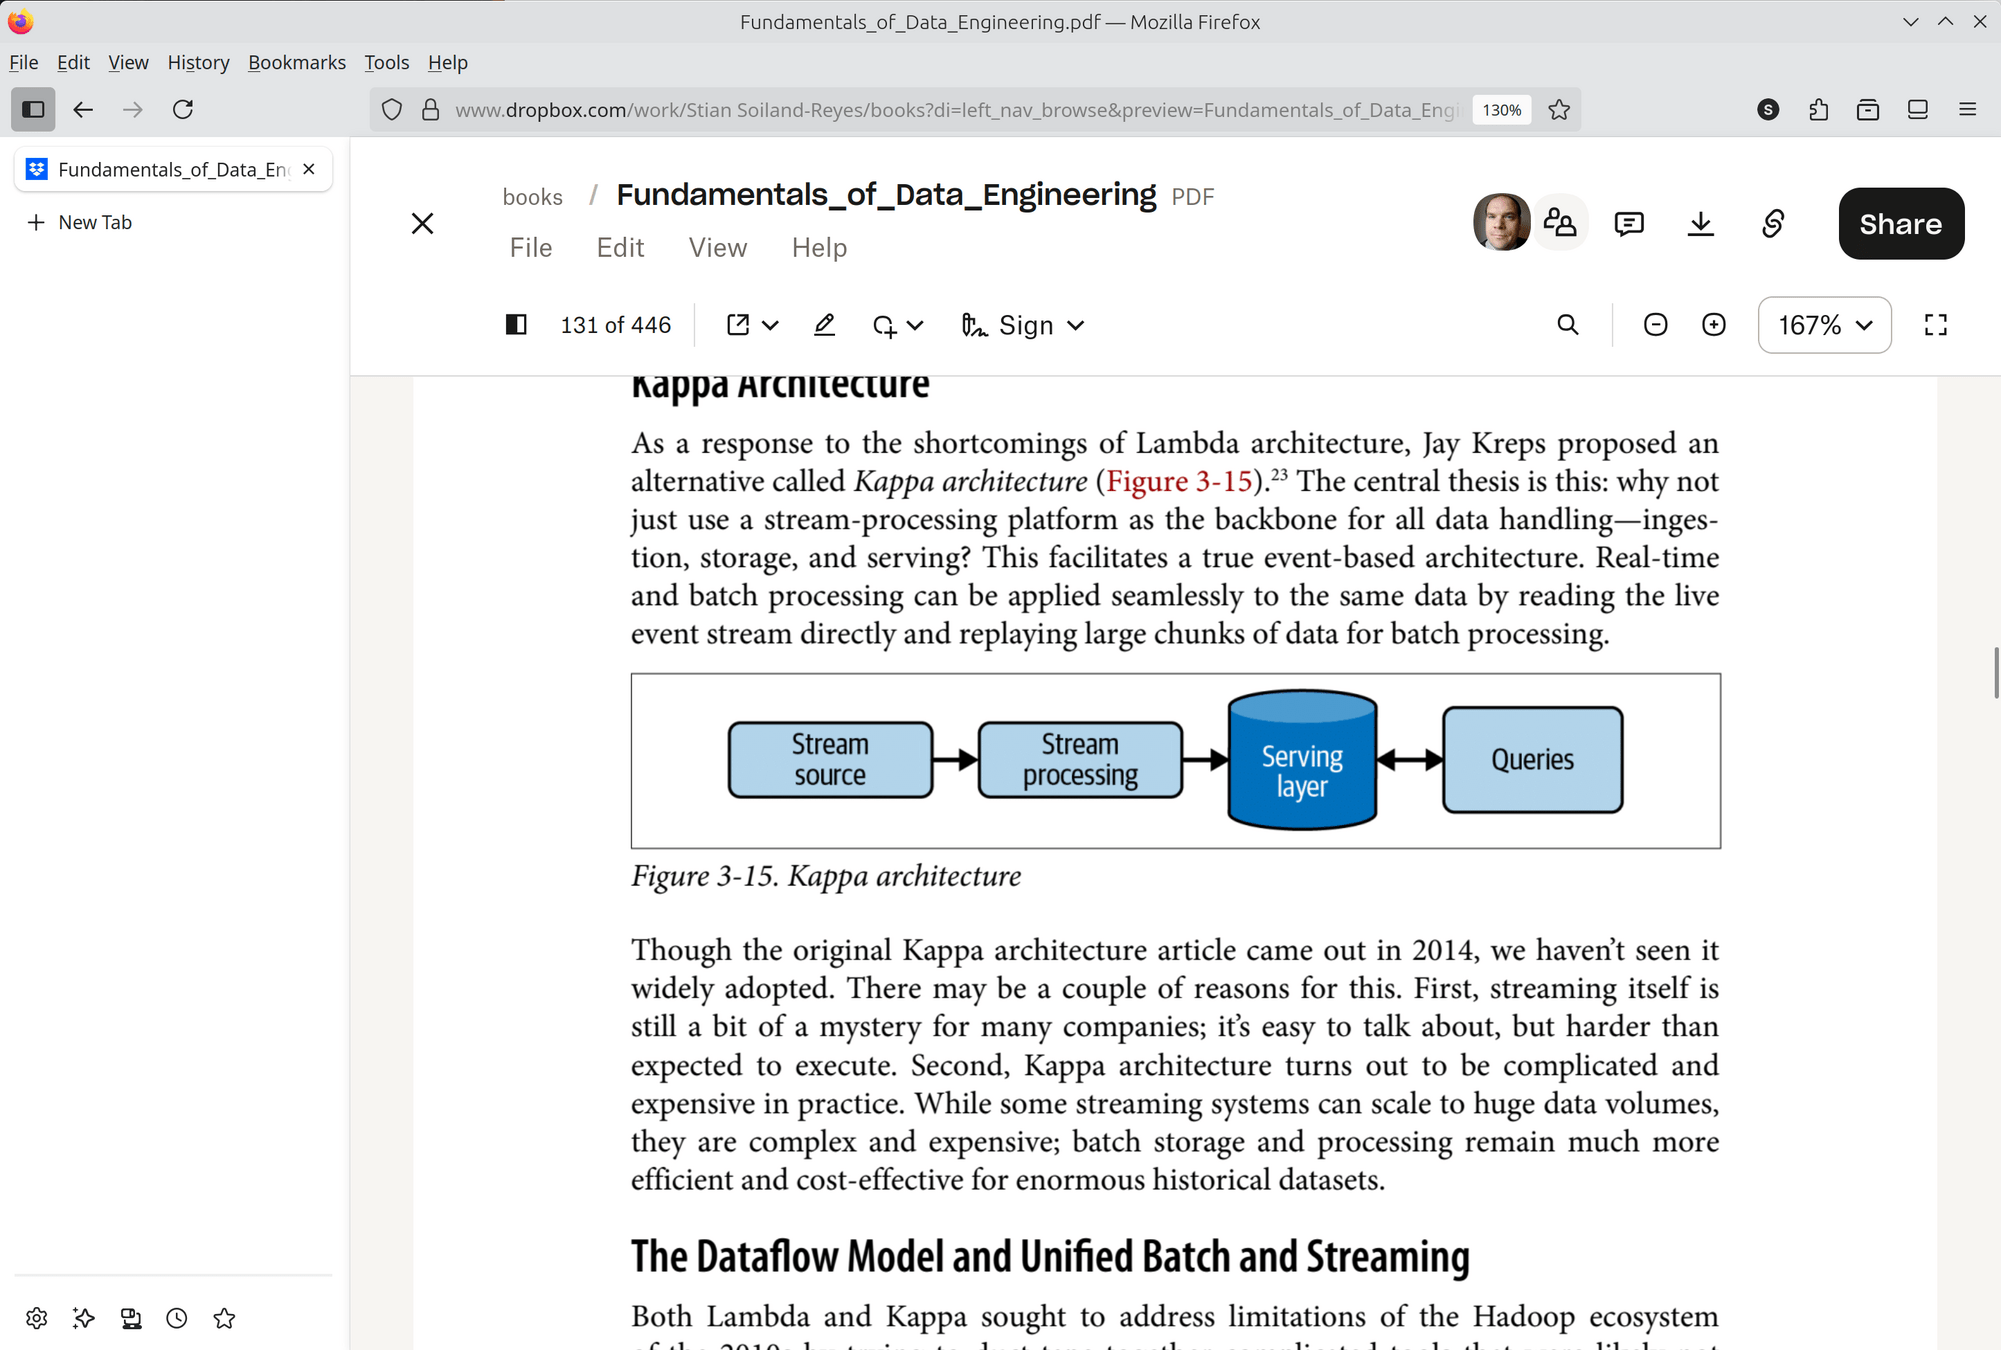
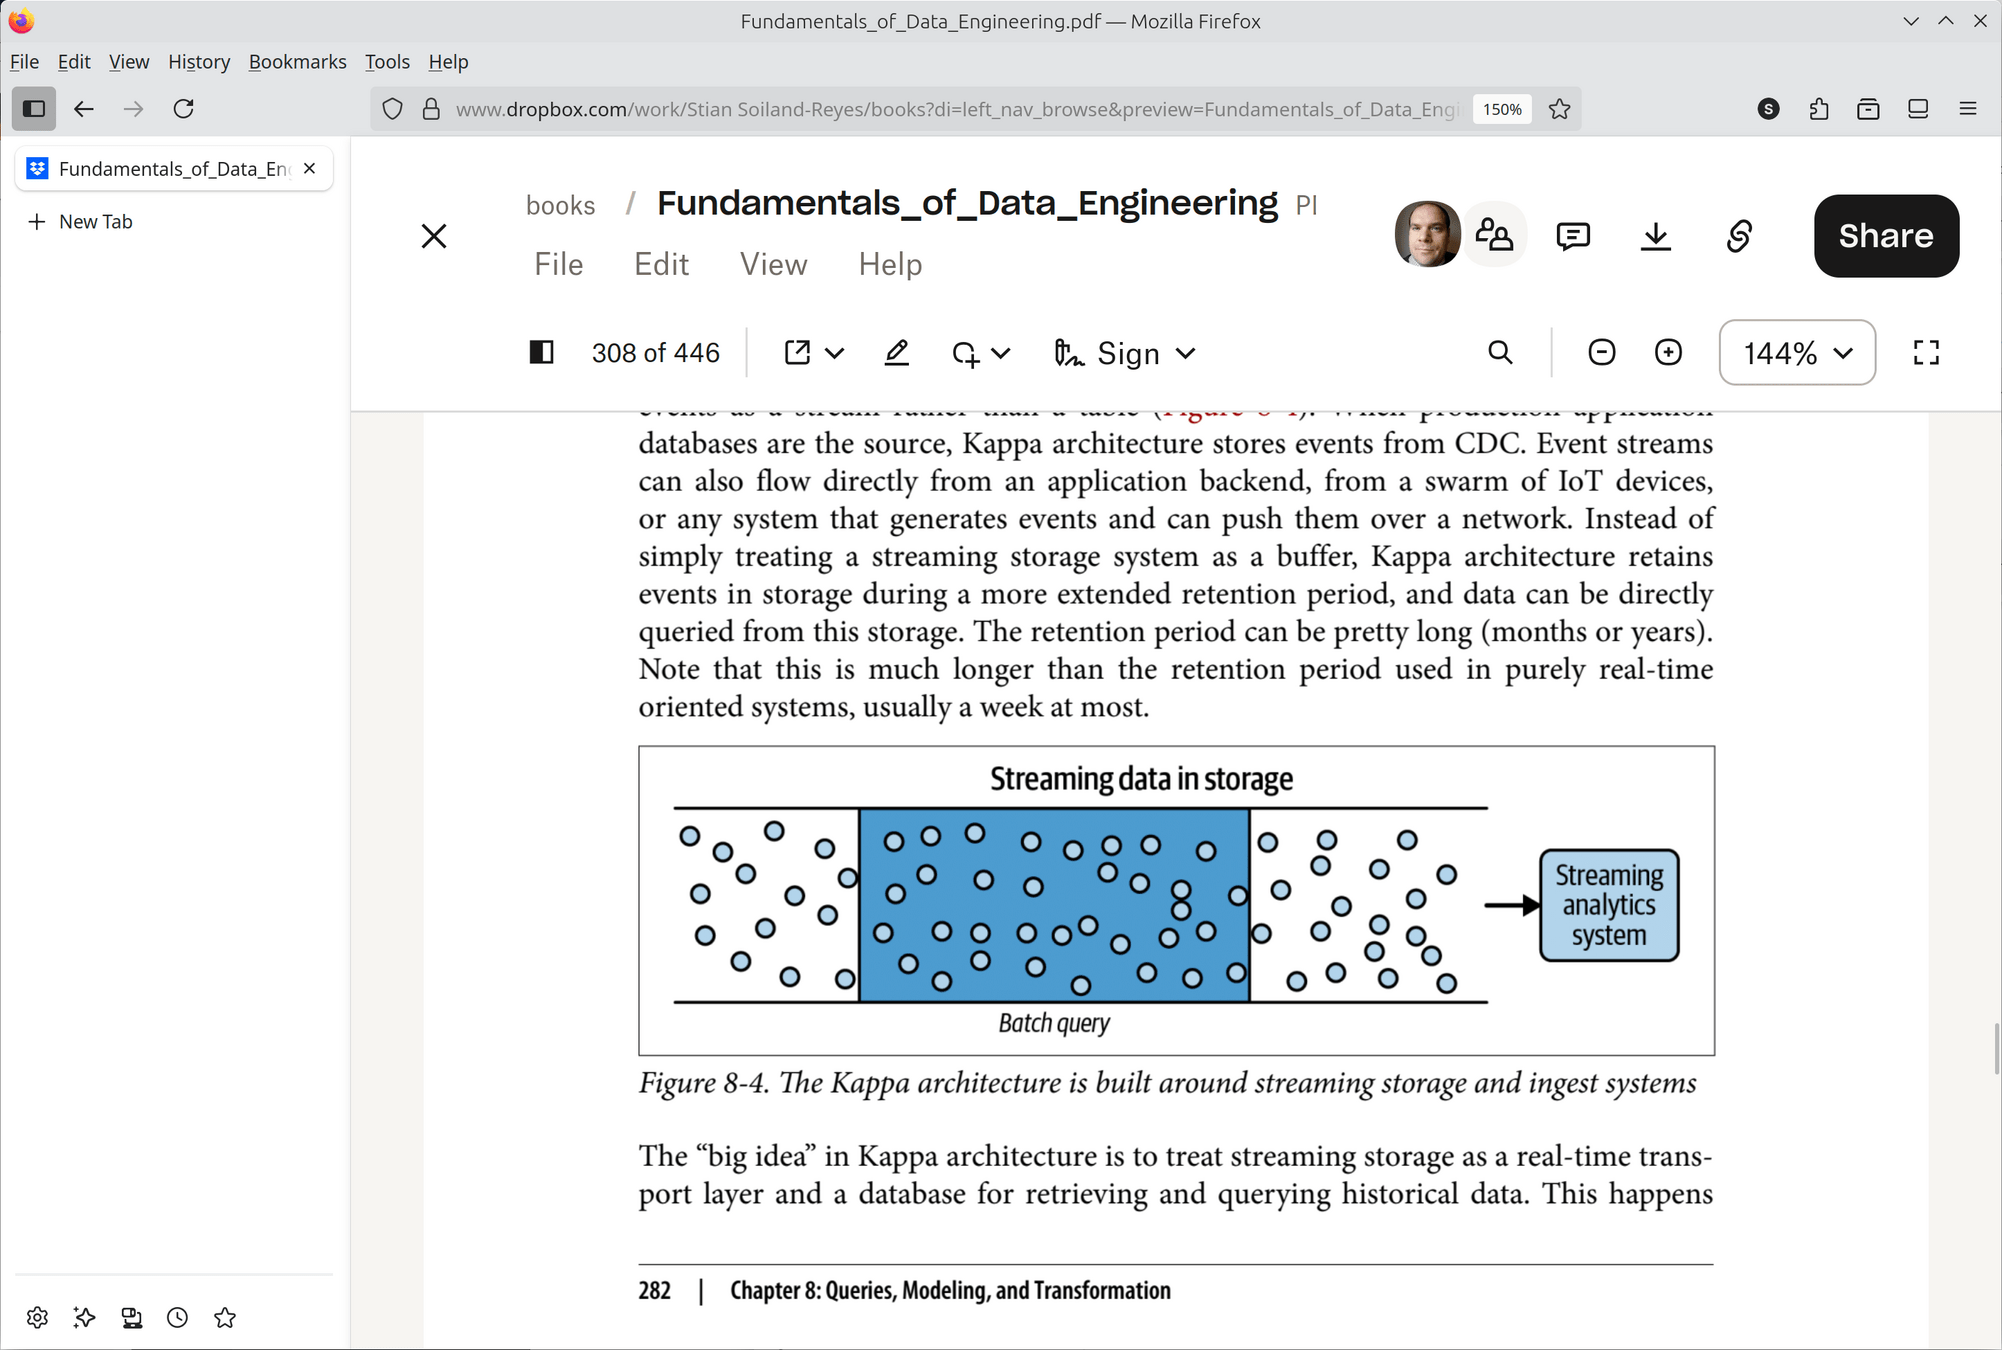
  • Kappa architecture treat all data as continuous streams without a separate batch layer

Figure 3.4, 3.5 from Fundamentals of Data Engineering

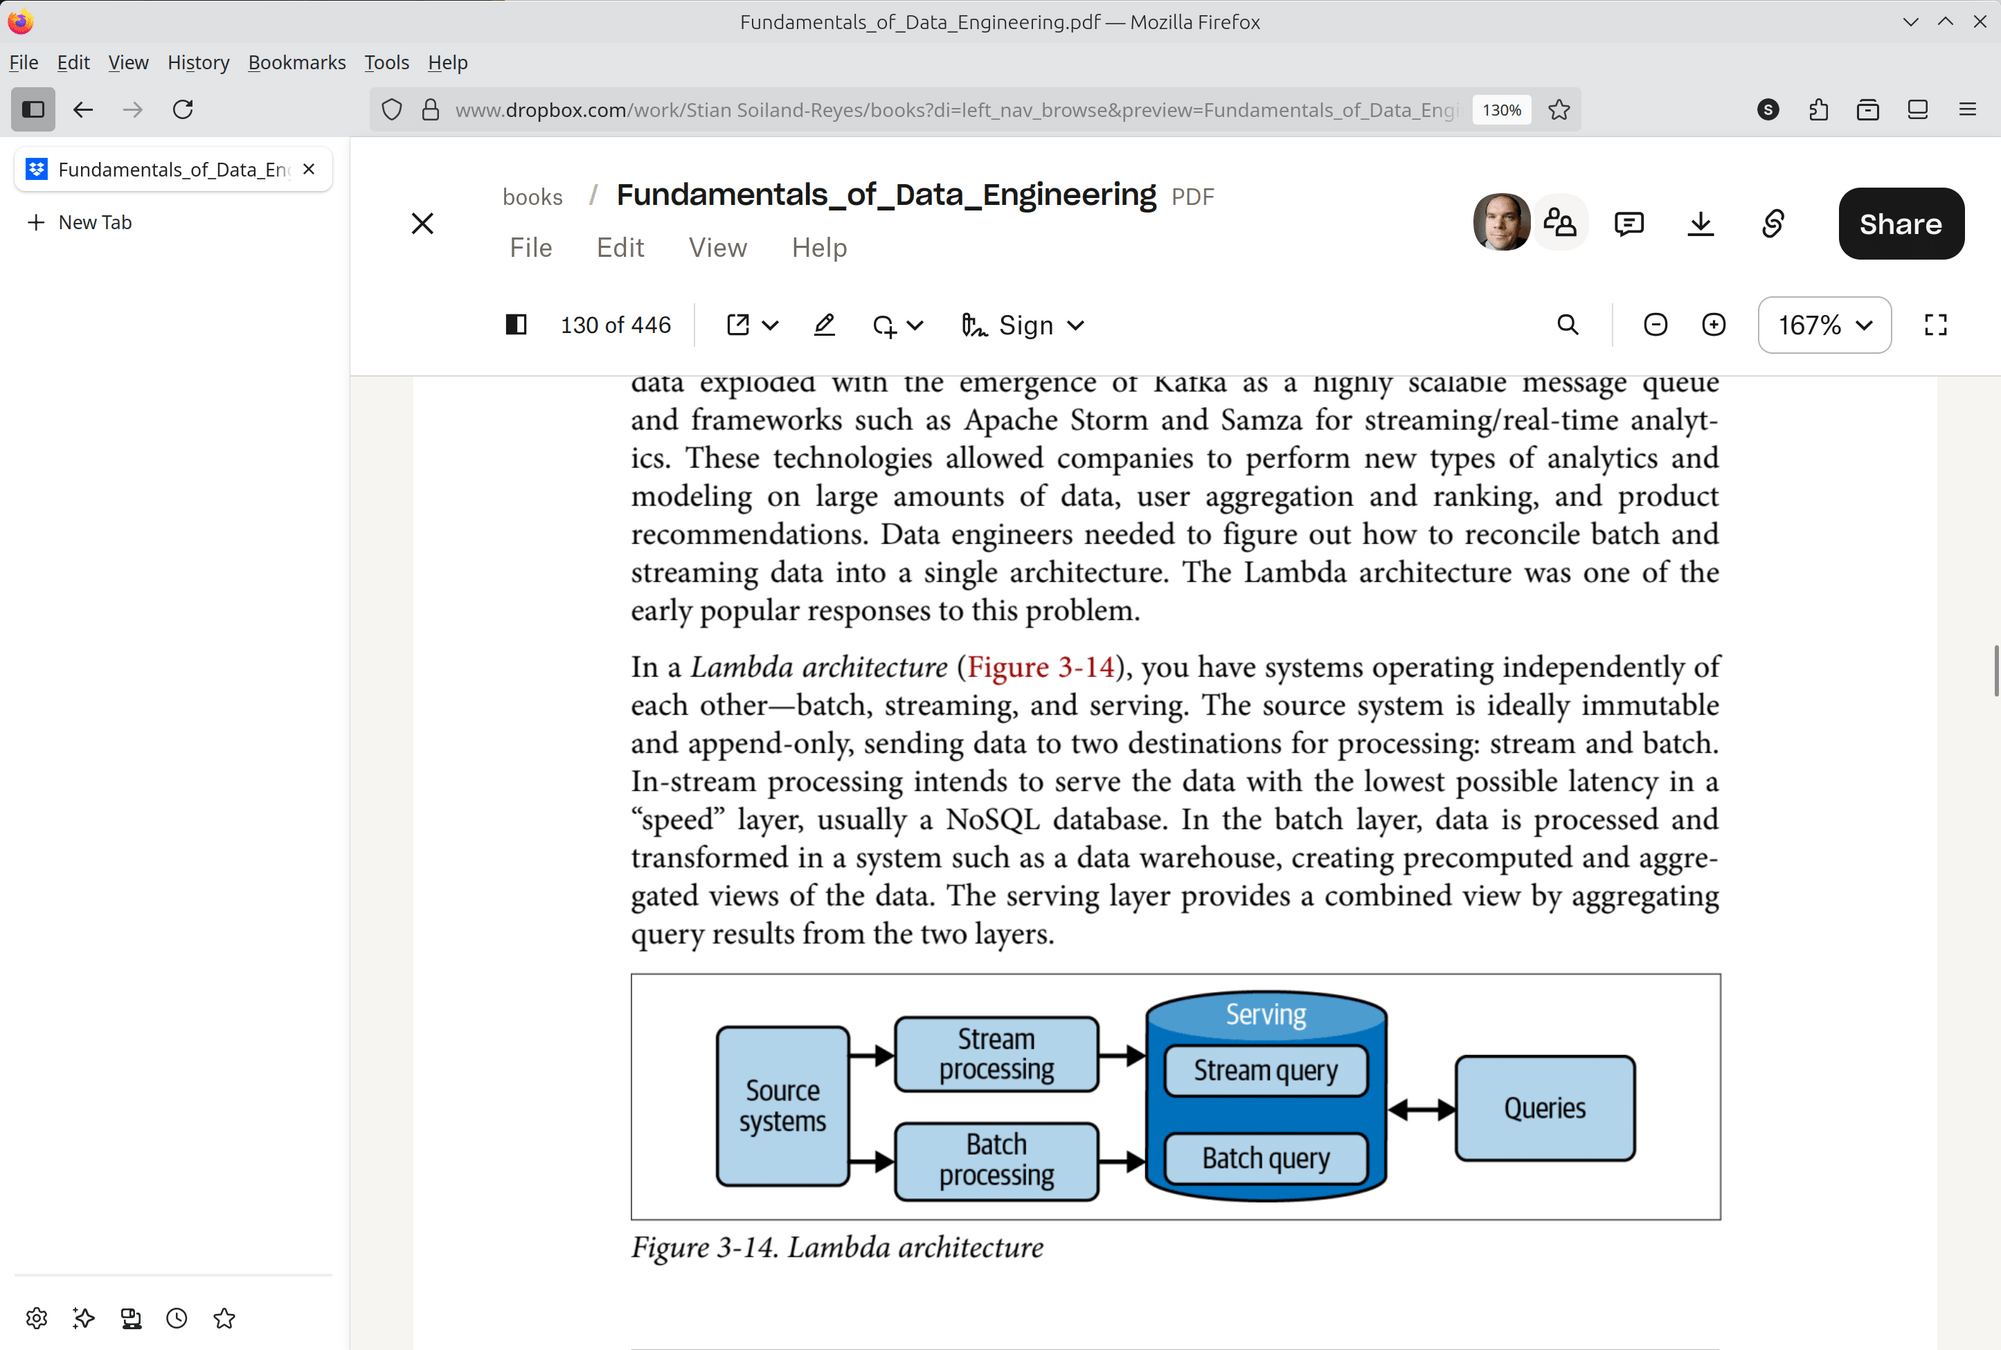
  • Lambda architecture has separate stream and batch processing, serving separate query methods

Querying in Lambda architecture

Stream query

Batch query

Data processed in real-time

high speed, but incomplete data

Immediate response to events

"Top up" batch views with newest data

Examples: Hadoop, Snowflake, BigQuery

Operates on complete data (in batches)

high latency, with complete data

Historical accuracy

Each batch update pre-compute full views

Examples: Spark, Kafka, Kinesis

Named after λ calculus, a functional mathematical system

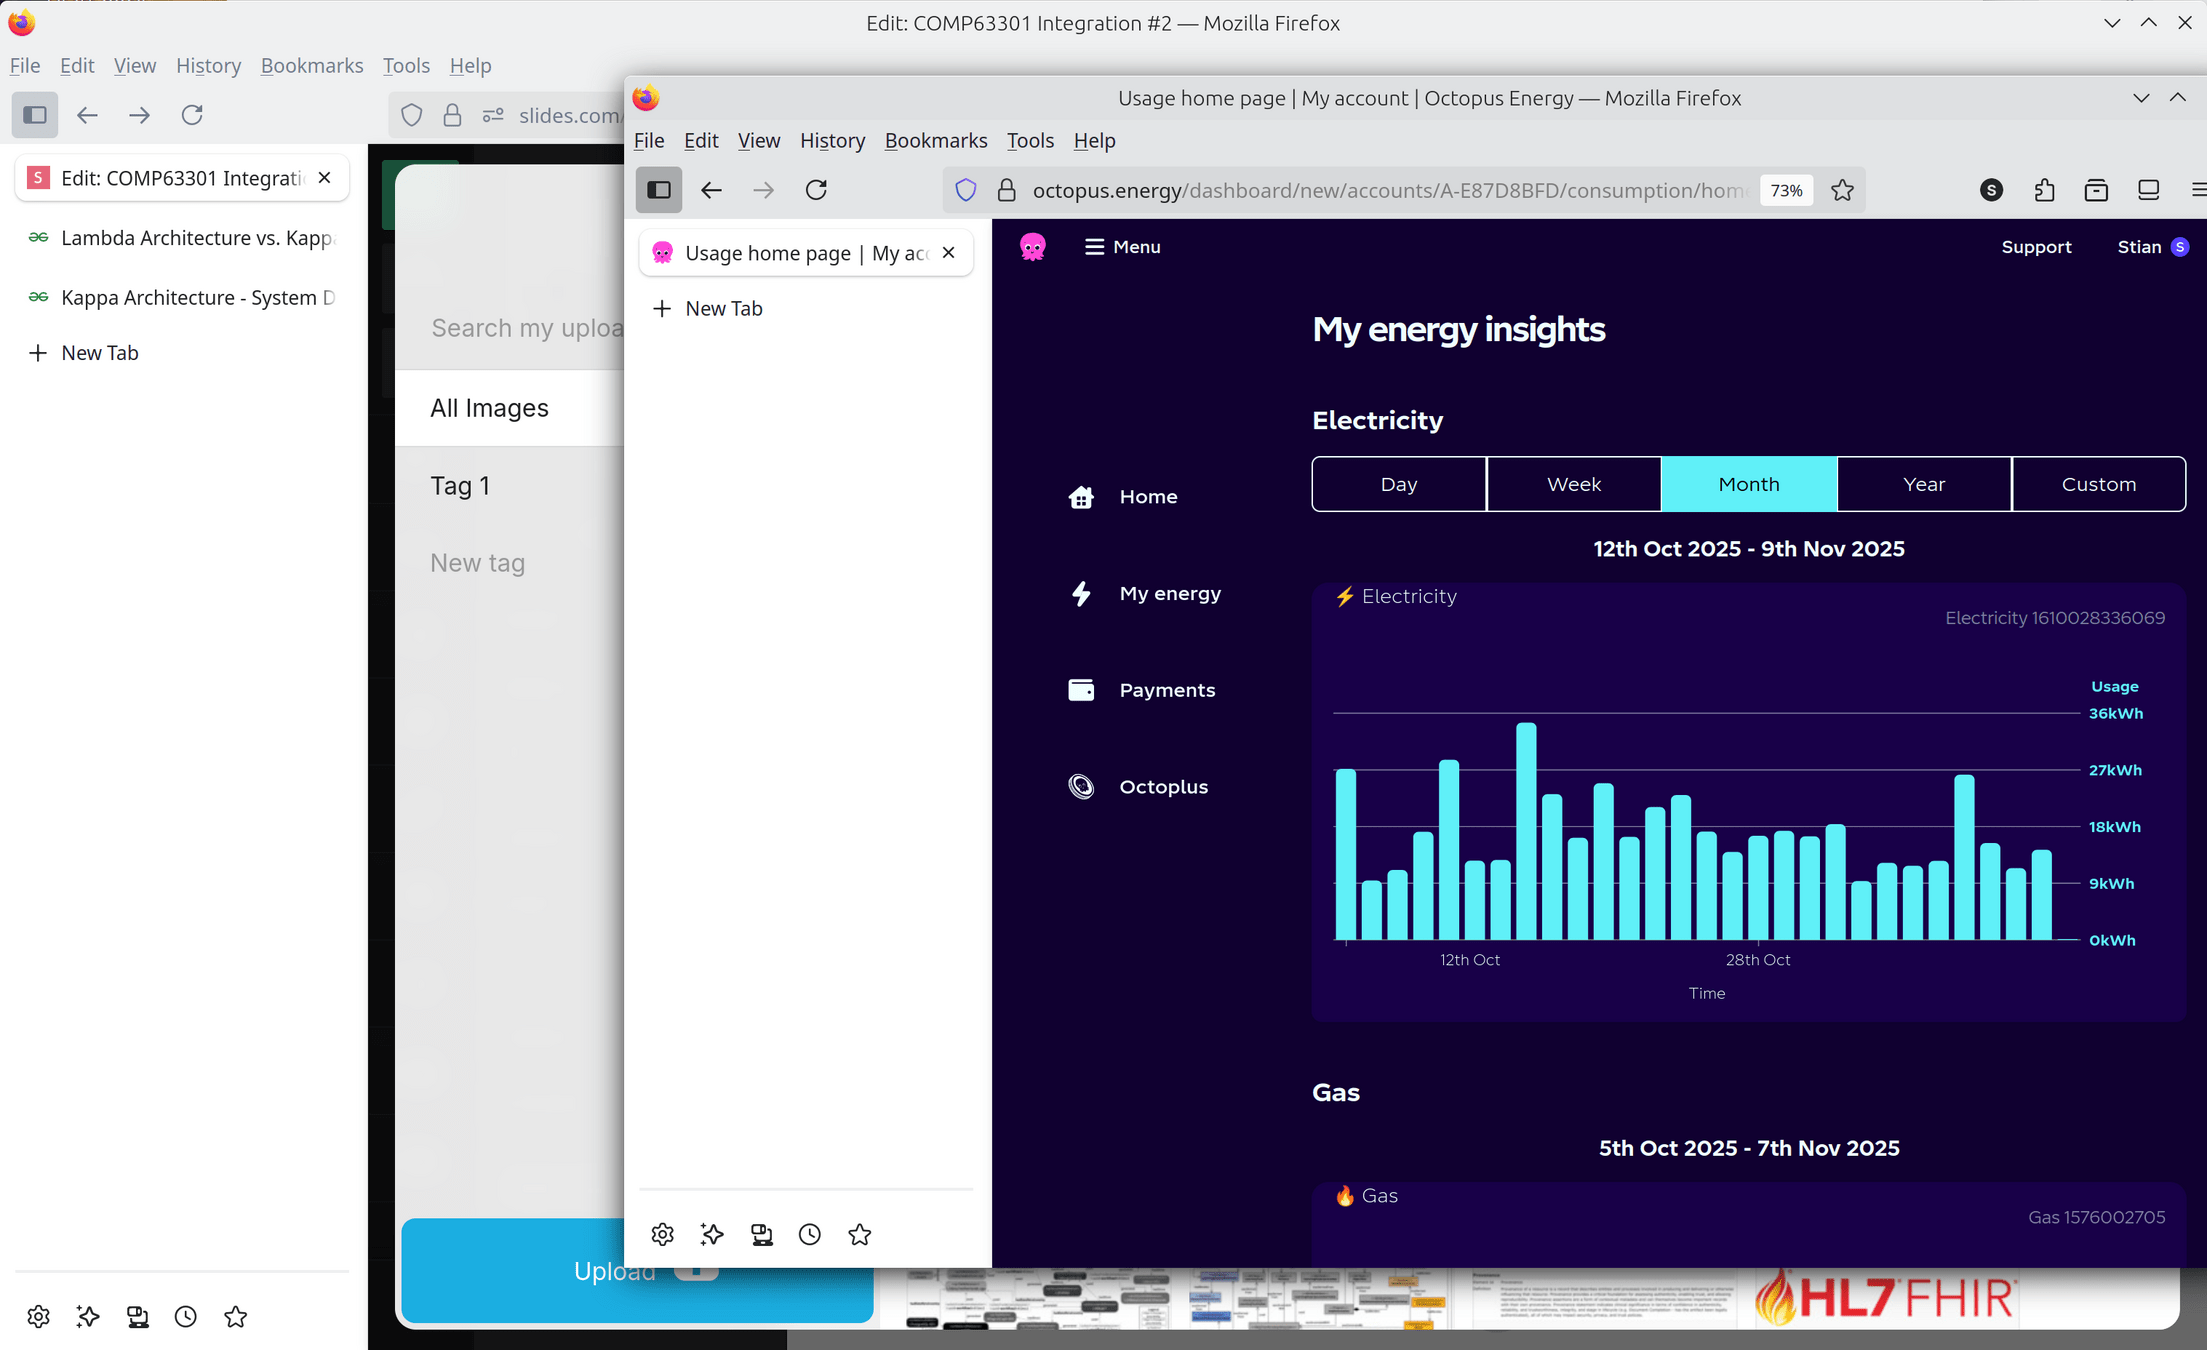
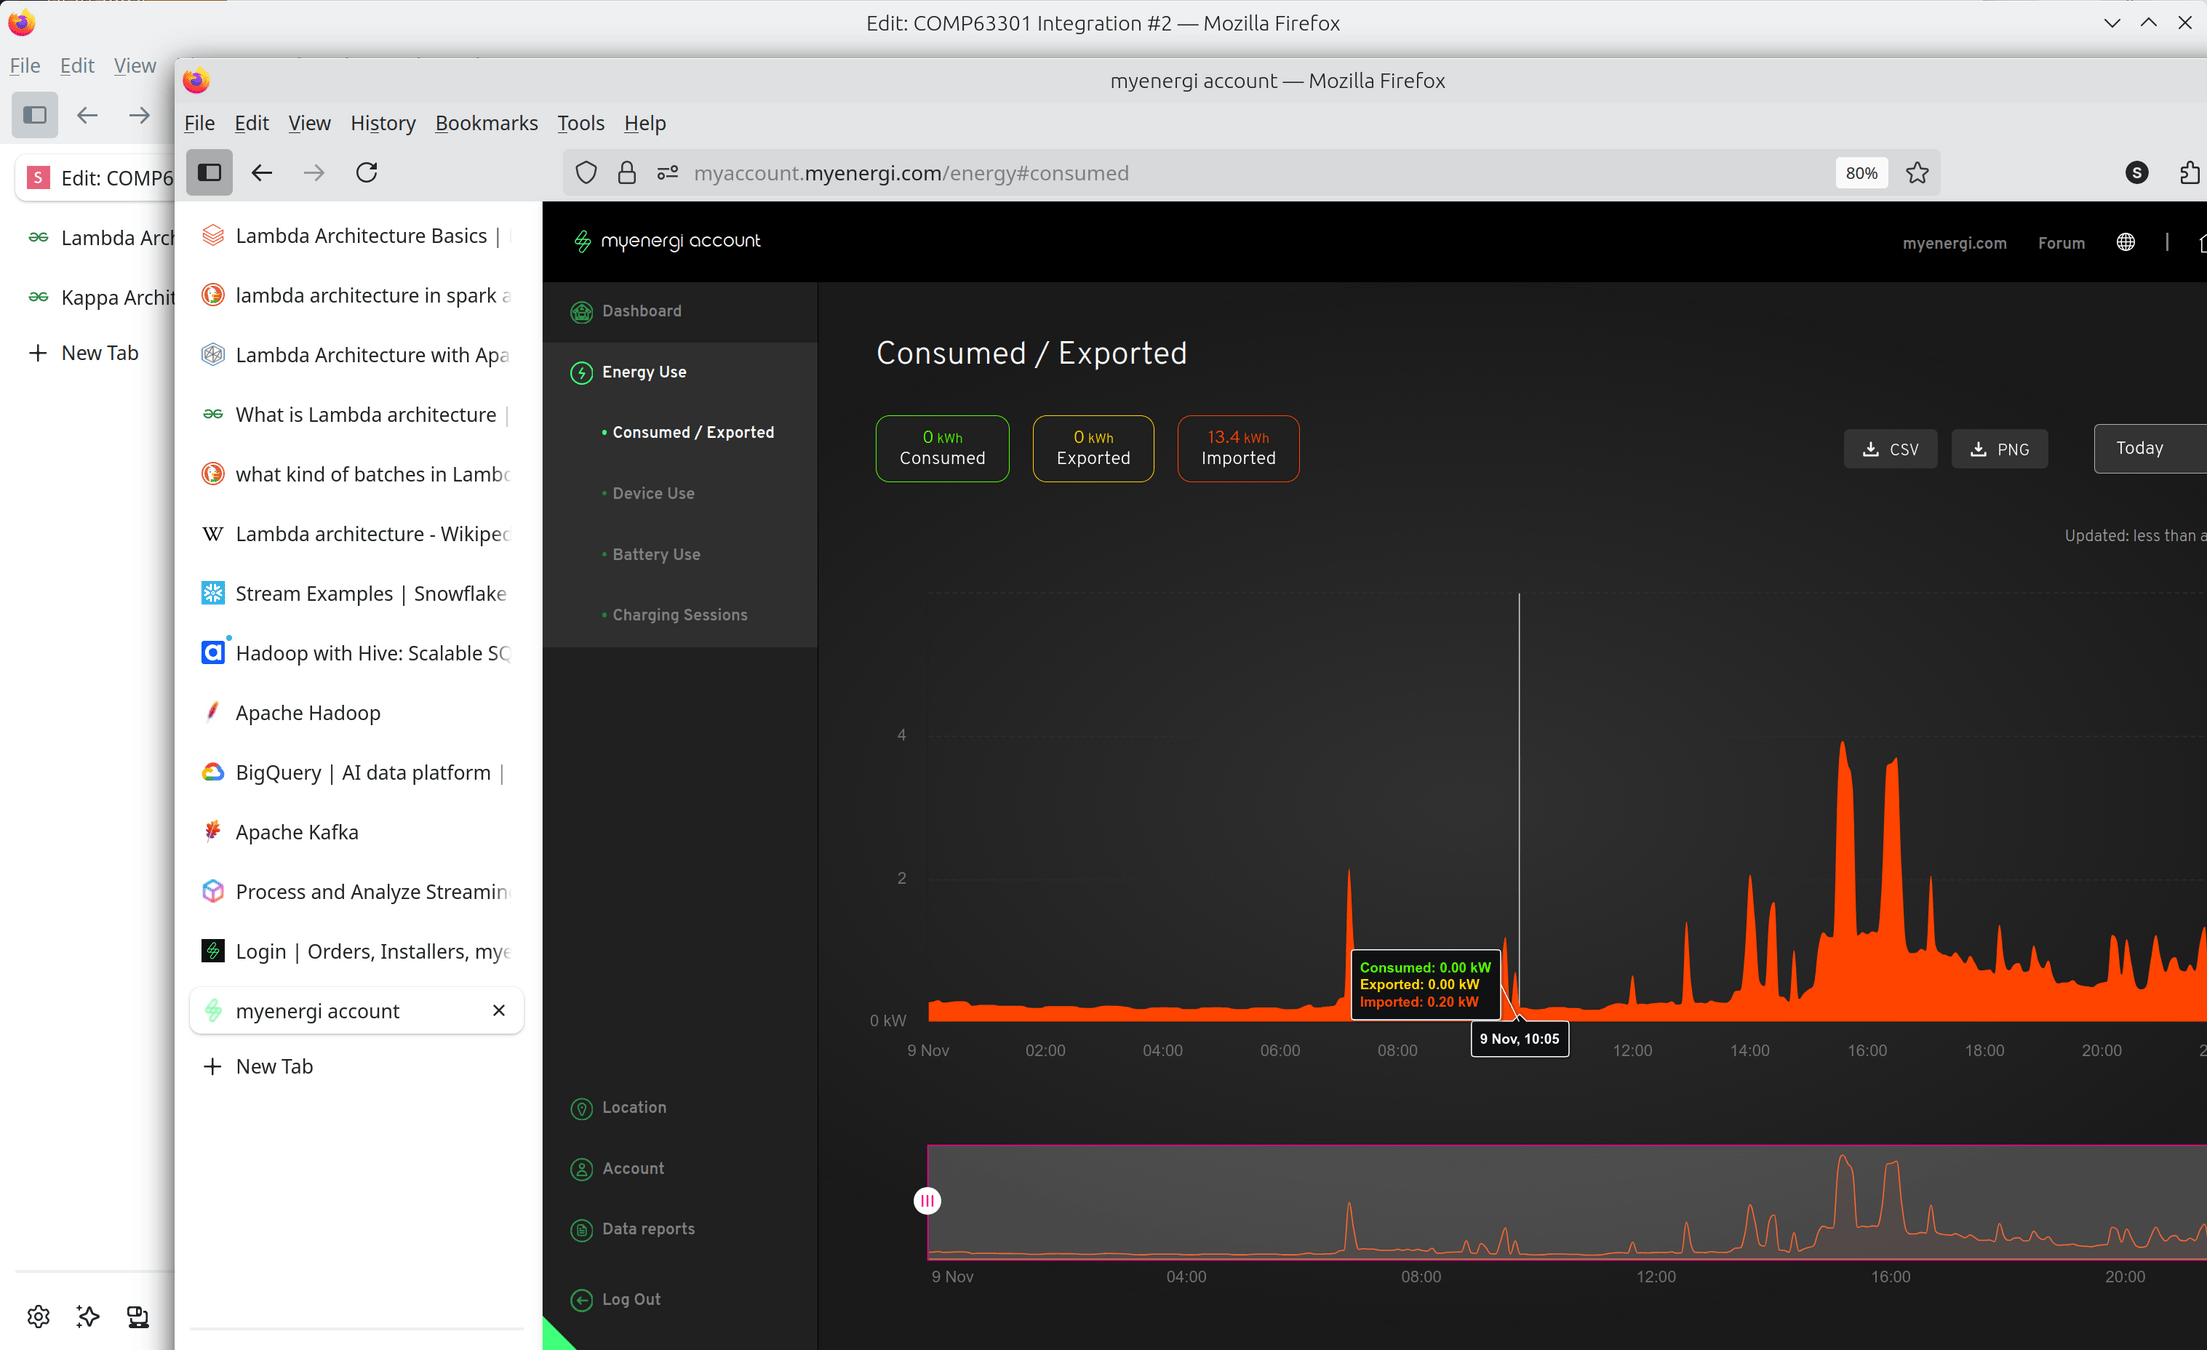
Smart Energy example

Batch query

Calculate cost for invoicing by 30 minute readings

Predict which periods are busiest

Latency: 60 minutes (or month!)

Accuracy: Gaps aligned by next readings

Stream query

Immediate feedback, what is using power?

Power generators can react quickly to sudden spikes (e.g. electric car charging)

Latency: 1 minute

Accuracy: Gaps ignored e.g. WiFi is down

Querying in Kappa architecture

Real-time data processed directly, transforming on the fly

Data streams treated like immutable logs

New and historical data handled uniformly (replay)

Simplifies processing, avoiding duality of batch/stream (ensure business logic is consistent)

Low latency, but full reprocessing can be expensive

Examples: Kafka, Flink, Storm

Greek letter κ supersedes λ

Uber event processing

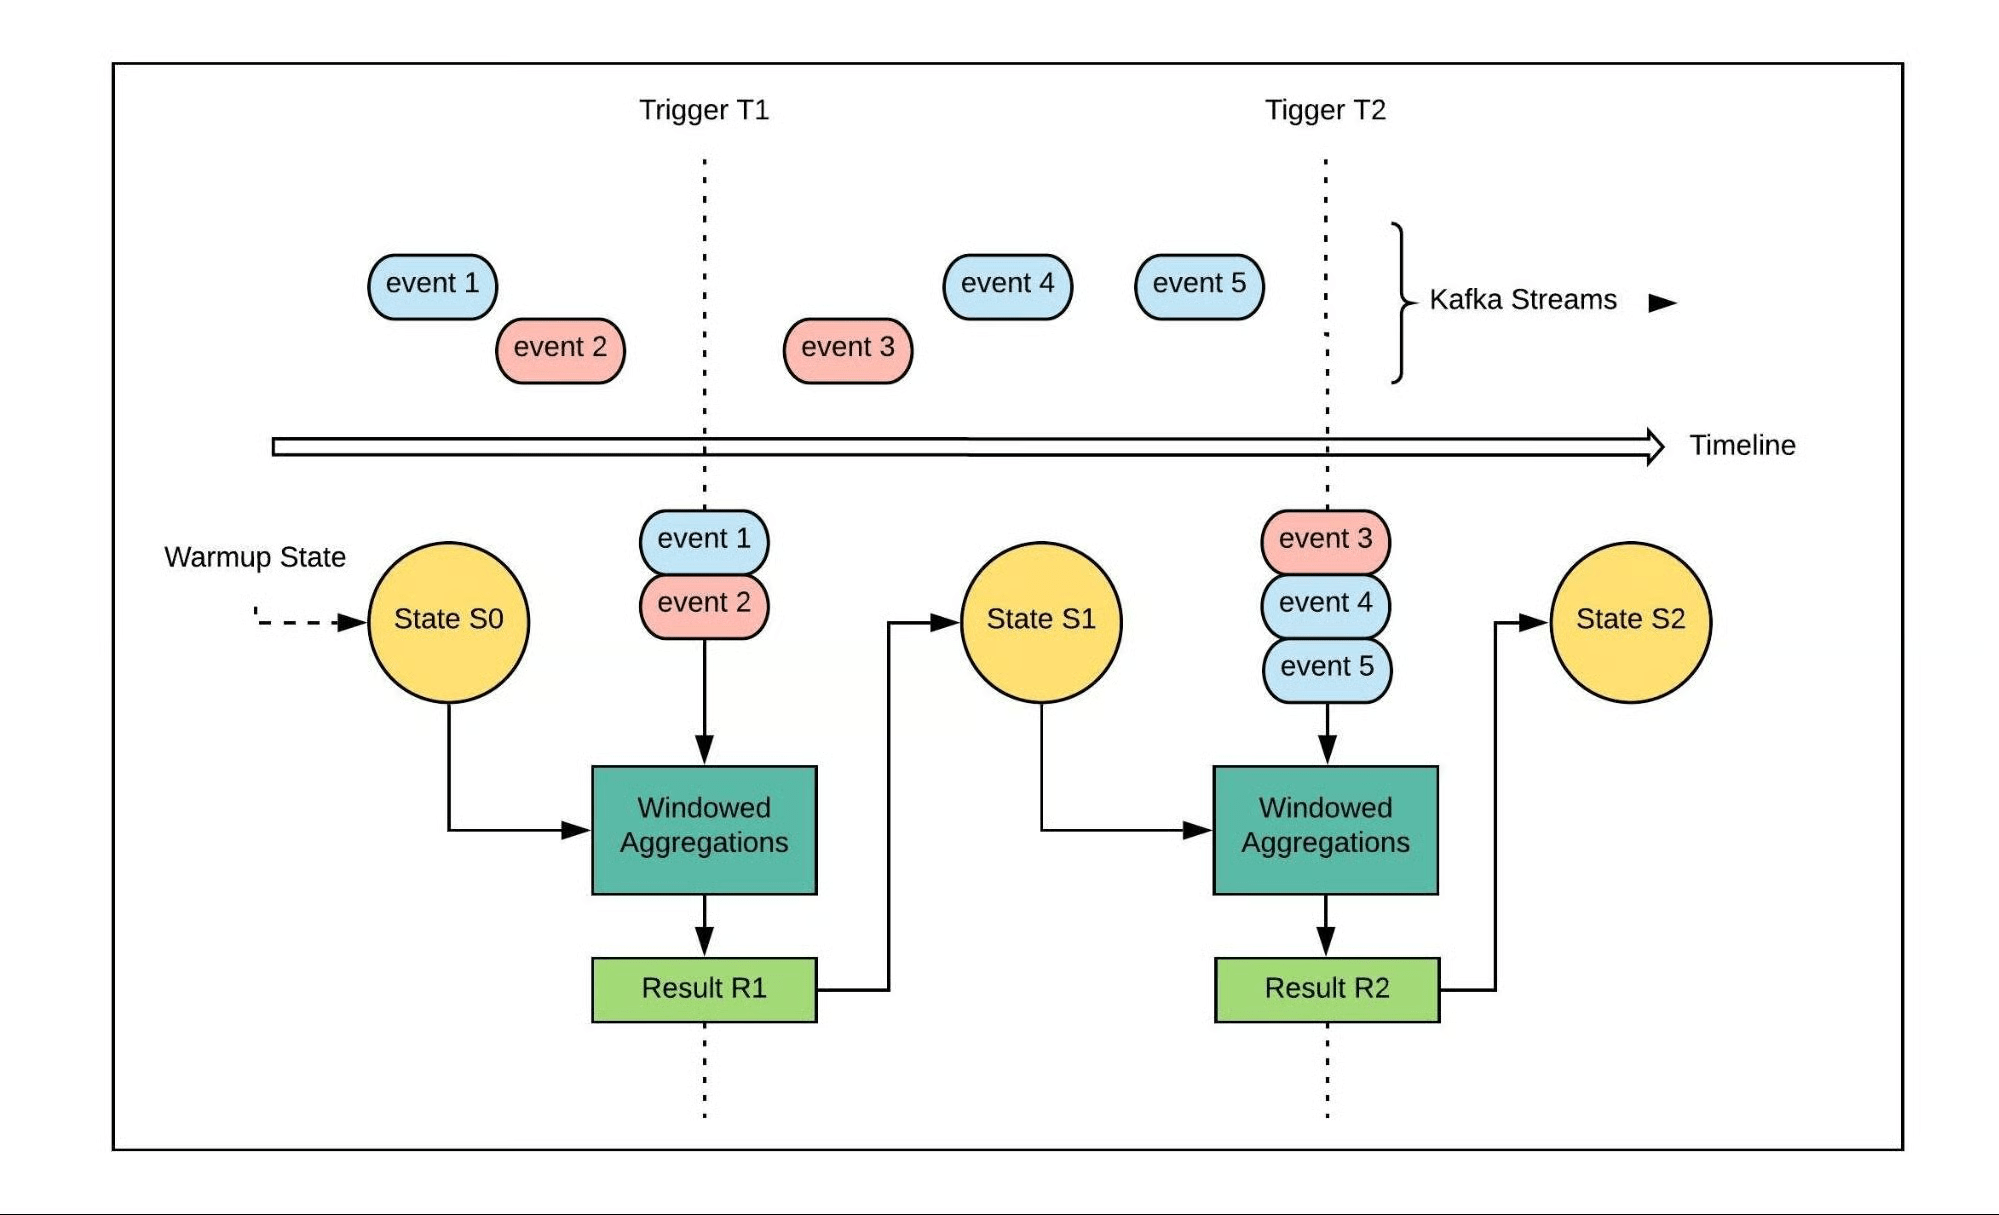
Challenge: backfilling of streaming workloads using a unified codebase.

Goal: Replay Uber rider sessions for accurate monthly business analysis

Example: Rider waits to rate a driver until their next Uber app session

Solution: Use Kappa architecture and process in Windows to allow late-arriving and out-of-order events

Benefit: Switching between streaming and batch job is just a switch of data source (live vs replay)

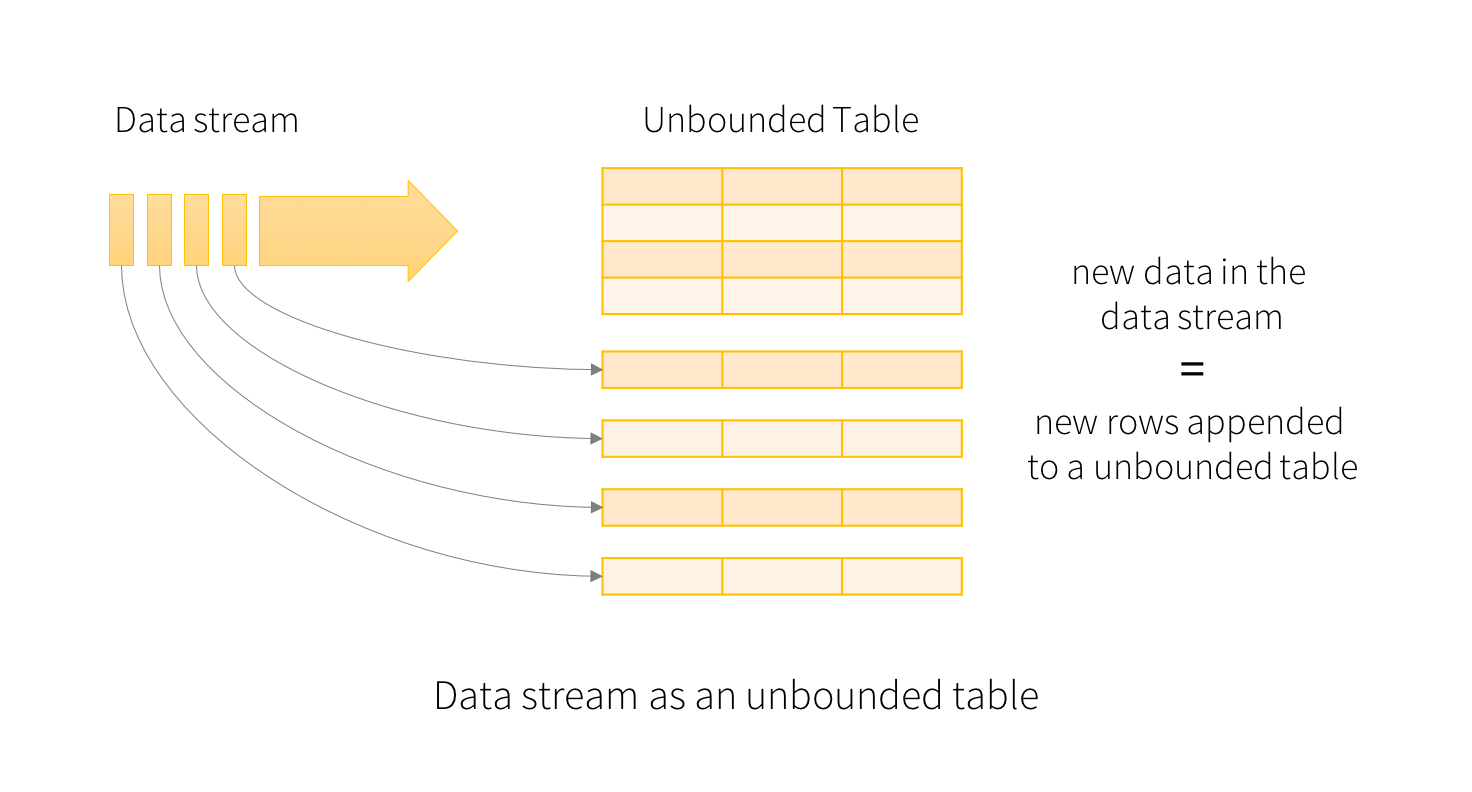
Querying streams with “SQL”

HiveQL: SQL-like queries on streams

Text

CREATE EXTERNAL TABLE raw_stream_events (
  event_id STRING,
  user_id STRING,
  event_type STRING,
  event_timestamp TIMESTAMP
)
ROW FORMAT SERDE 'org.apache.hive.hcatalog.data.JsonSerDe'
LOCATION '/hdfs/streaming/events';

Ingest streaming data from Kafka into Hive

CREATE TABLE processed_events AS
SELECT 
  e.event_id,
  e.user_id,
  e.event_type,
  e.event_timestamp,
  u.region
FROM raw_stream_events e
JOIN user_dim u ON e.user_id = u.user_id
WHERE e.event_timestamp IS NOT NULL;

Process streaming events (~ materialised view)

event_id user_id event_type event_timestamp region
3133 alice81 purchase 17:52 Europe
… not here yet!
{ "event_id": 3133, "user_id": "alice81", "event_type": "purchase", … }
event_id user_id event_data
3133 alice81 { … }
… not here yet!

Structured Streaming with Spark SQL and DataFrames

spark.read.json("s3n://...")
  .registerTempTable("json")
results = spark.sql(
  """SELECT *
     FROM people
     JOIN json ...""")
results = spark.sql(
  "SELECT * FROM people")
names = results.map(lambda p: p.name)
df.select("device").where("signal > 10")

Any Spark data source can be queried

SQL can be combined with data frame operations

DataFrames have n SQL-like methods

Key points on transformation

  • SQL can generate derived data, joining existing sources
  • Heavy queries may need to be optimised
  • Batch queries pre-cook reliable transformations
  • Stream queries for immediate (but partial) transformation
  • Historical events can be replayed as a stream
  • Streaming frameworks support SQL-like transformation  from non-relational sources

COMP63301 Integration #2 2026/2027

By Stian Soiland-Reyes

COMP63301 Integration #2 2026/2027

Lecture in COMP63301 Data Engineering Concepts at The University of Manchester.

  • 659