Profiling and Debugging
Parallel Algorithms
David Mayerich
Scalable Tissue Imaging and Modeling (STIM) Laboratory
Department of Electrical and Computer Engineering
Cullen College of Engineering
University of Houston
David Mayerich
STIM Laboratory, University of Houston

C Time Function
David Mayerich
STIM Laboratory, University of Houston
-
The
time()function returns the number of seconds since 1 Jan 1970
-
Only 1 second resolution
- This can be useful for quick-and-dirty timing because it's so simple
- Don't use it for any practical profiling
#include <time.h>
// ...
time_t t0 = time(NULL);
// ...
// do something
// ...
time_t t1 = time(NULL);
// duration (1s resolution)
time_t duration = t1 - t0;
C++ High-Resolution Clocks
system_clock
-
real-world "clock" time
-
not monotonic:
jumps with system settings (ex. DST)
Usage: time stamping events so they can be correlated with other measurements
David Mayerich
STIM Laboratory, University of Houston
steady_clock
-
measures duration
-
cannot be converted to a real-world time
-
always monotonic
Usage: precise timing of events that occur in your application
- function calls
- thread execution time
- benchmarking
high_resolution_clock
-
clock with the highest-resolution possible
-
implementation-specific
High Resolution Timers
David Mayerich
STIM Laboratory, University of Houston
#include <chrono>

// record a time point
std::chrono::steady_clock::time_point start = std::chrono::steady_clock::now();

// do something

// record a second time point
std::chrono::steady_clock::time_point end = std::chrono::steady_clock::now();

// calculate a duration and specify the units
std::chrono::duration<double, std::milli> d = end - start;

// get the time in seconds
// resolution is system dependent, but around 20 – 40 ns
double elapsed = d.count();
<PA1 Example>
David Mayerich
STIM Laboratory, University of Houston
Debugging Symbols
-
Metadata embedded in an executable that references the source code
-
Allows a debugger to step through lines of source code as they are being executed
-
Assigns register names to source code variables
-
Associates operations with lines/locations in source code files
-
-
Symbols are provided by compiling in "Debug" mode:
-
set(CMAKE_BUILD_TYPE Debug) -
or select "Debug" in Visual Studio
-
-
Note on Debug Modes:
-
the compiler does not perform standard optimizations
(this maintains consistency between the source code and executable) -
code will run 10x times slower on a good day
-
David Mayerich
STIM Laboratory, University of Houston
Call Stacks
-
The call stack keeps track of active subroutines in an executing program
-
stack frame / activation record:
-
function parameters: values passed into the function
-
local variables: variables declared within the function
-
return address: pointer to the command that called this subroutine
-
corresponds to symbols in "scope"
-
-
stack pointer: pointer to the current function location
David Mayerich
STIM Laboratory, University of Houston
-
The stack pointer is "popped" when a function returns:
Call Stack
sphere::Hit
CalculateClosestHit
cpuRenderScene
std::thread::_Invoke
raytrace (PID: 28267)
stack pointer
Tracing
-
Records significant events:
-
function entry/exit
-
operating system calls
-
external library events
-
-
Provided with timestamps
David Mayerich
STIM Laboratory, University of Houston
Disadvantages:
-
Significant performance hit
-
Recording details eats up performance, especially for short-running tasks
-
Not useful for evaluating performance
-
-
Can get dense for long-running or interactive programs with a lot of small things going on (ex. games)
Advantages:
- Complete picture of program execution
- Reproducible across multiple executions
- Mostly useful for debugging
Tools
- strace and ltrace
- Visual Studio debugger
DEMO - Tracing, Debugging, Call Stacks
David Mayerich
STIM Laboratory, University of Houston
Sampling (Profiling)
-
Samples the call stack during execution at regular intervals (several ms)
-
Doesn't provide timing information for functions
(you can often extrapolate this) -
Much lower overhead than tracing
David Mayerich
STIM Laboratory, University of Houston
Disadvantages:
- Data can be difficult to interpret: sampling provides a statistical distribution, not a timeline
-
Can miss very short subroutines that the program doesn't spend a lot of time in
-
Sampling isn't directly reproducible across different executions:
-
System occupancy due to other processes can change the results across runs
-
Changes in caching/memory locations can impact the results
-
Advantages:
- Much better for measuring execution time
- Shows you what subroutines are "occupying" the system
- Works well for multi-threaded processes
Sampling Software
-
Sampling is generally performed using a "profiler"
-
Visual studio has one built in
-
perfis the most common Linux tool
-
-
It's useful to have symbol names present:
-
set(CMAKE_BUILD_TYPE RelWithDebInfo) -
Perform optimizations but also store symbols and source code details
-
David Mayerich
STIM Laboratory, University of Houston
samply
- Cross-platform sampler that uses Firefox as a GUI:
https://github.com/mstange/samply
- Record the samples during execution:
samply record ./mie
- Profiling usually requires some system-level access
sudo sysctl kernel.perf_event_paranoid=1
(Windows may ask you for admin privileges)
Flame Graph
A flame graph shows the statistical distribution of the call stack based on the acquired samples
David Mayerich
STIM Laboratory, University of Houston
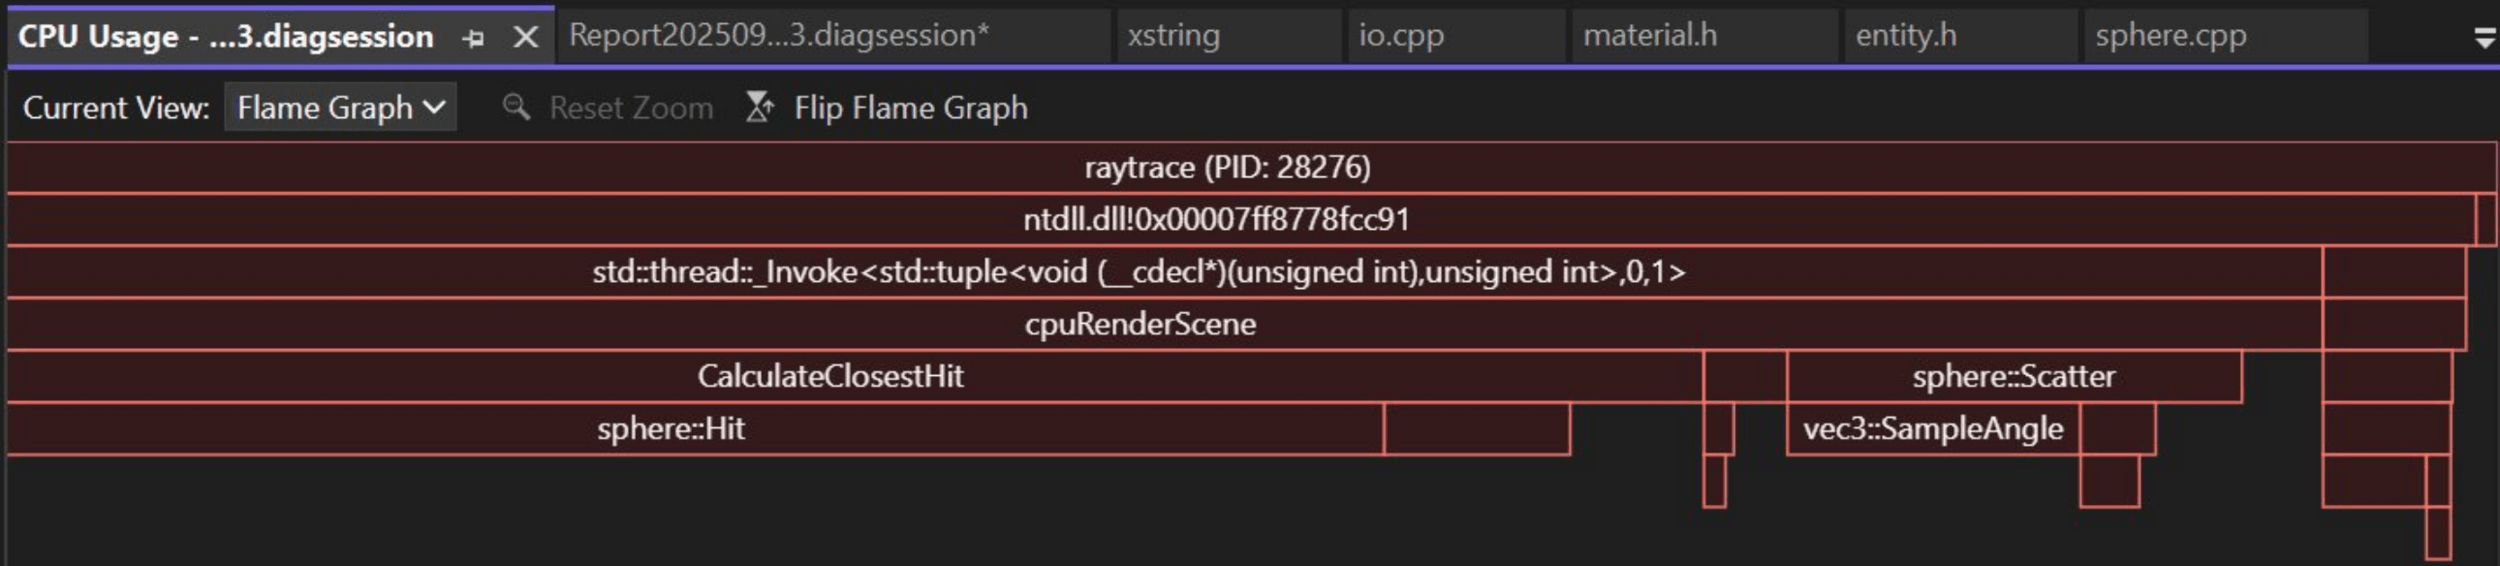
call stack
time spent in function
Hot Path
-
The hot path is the code in your program that consumes the most time (occupancy)
David Mayerich
STIM Laboratory, University of Houston
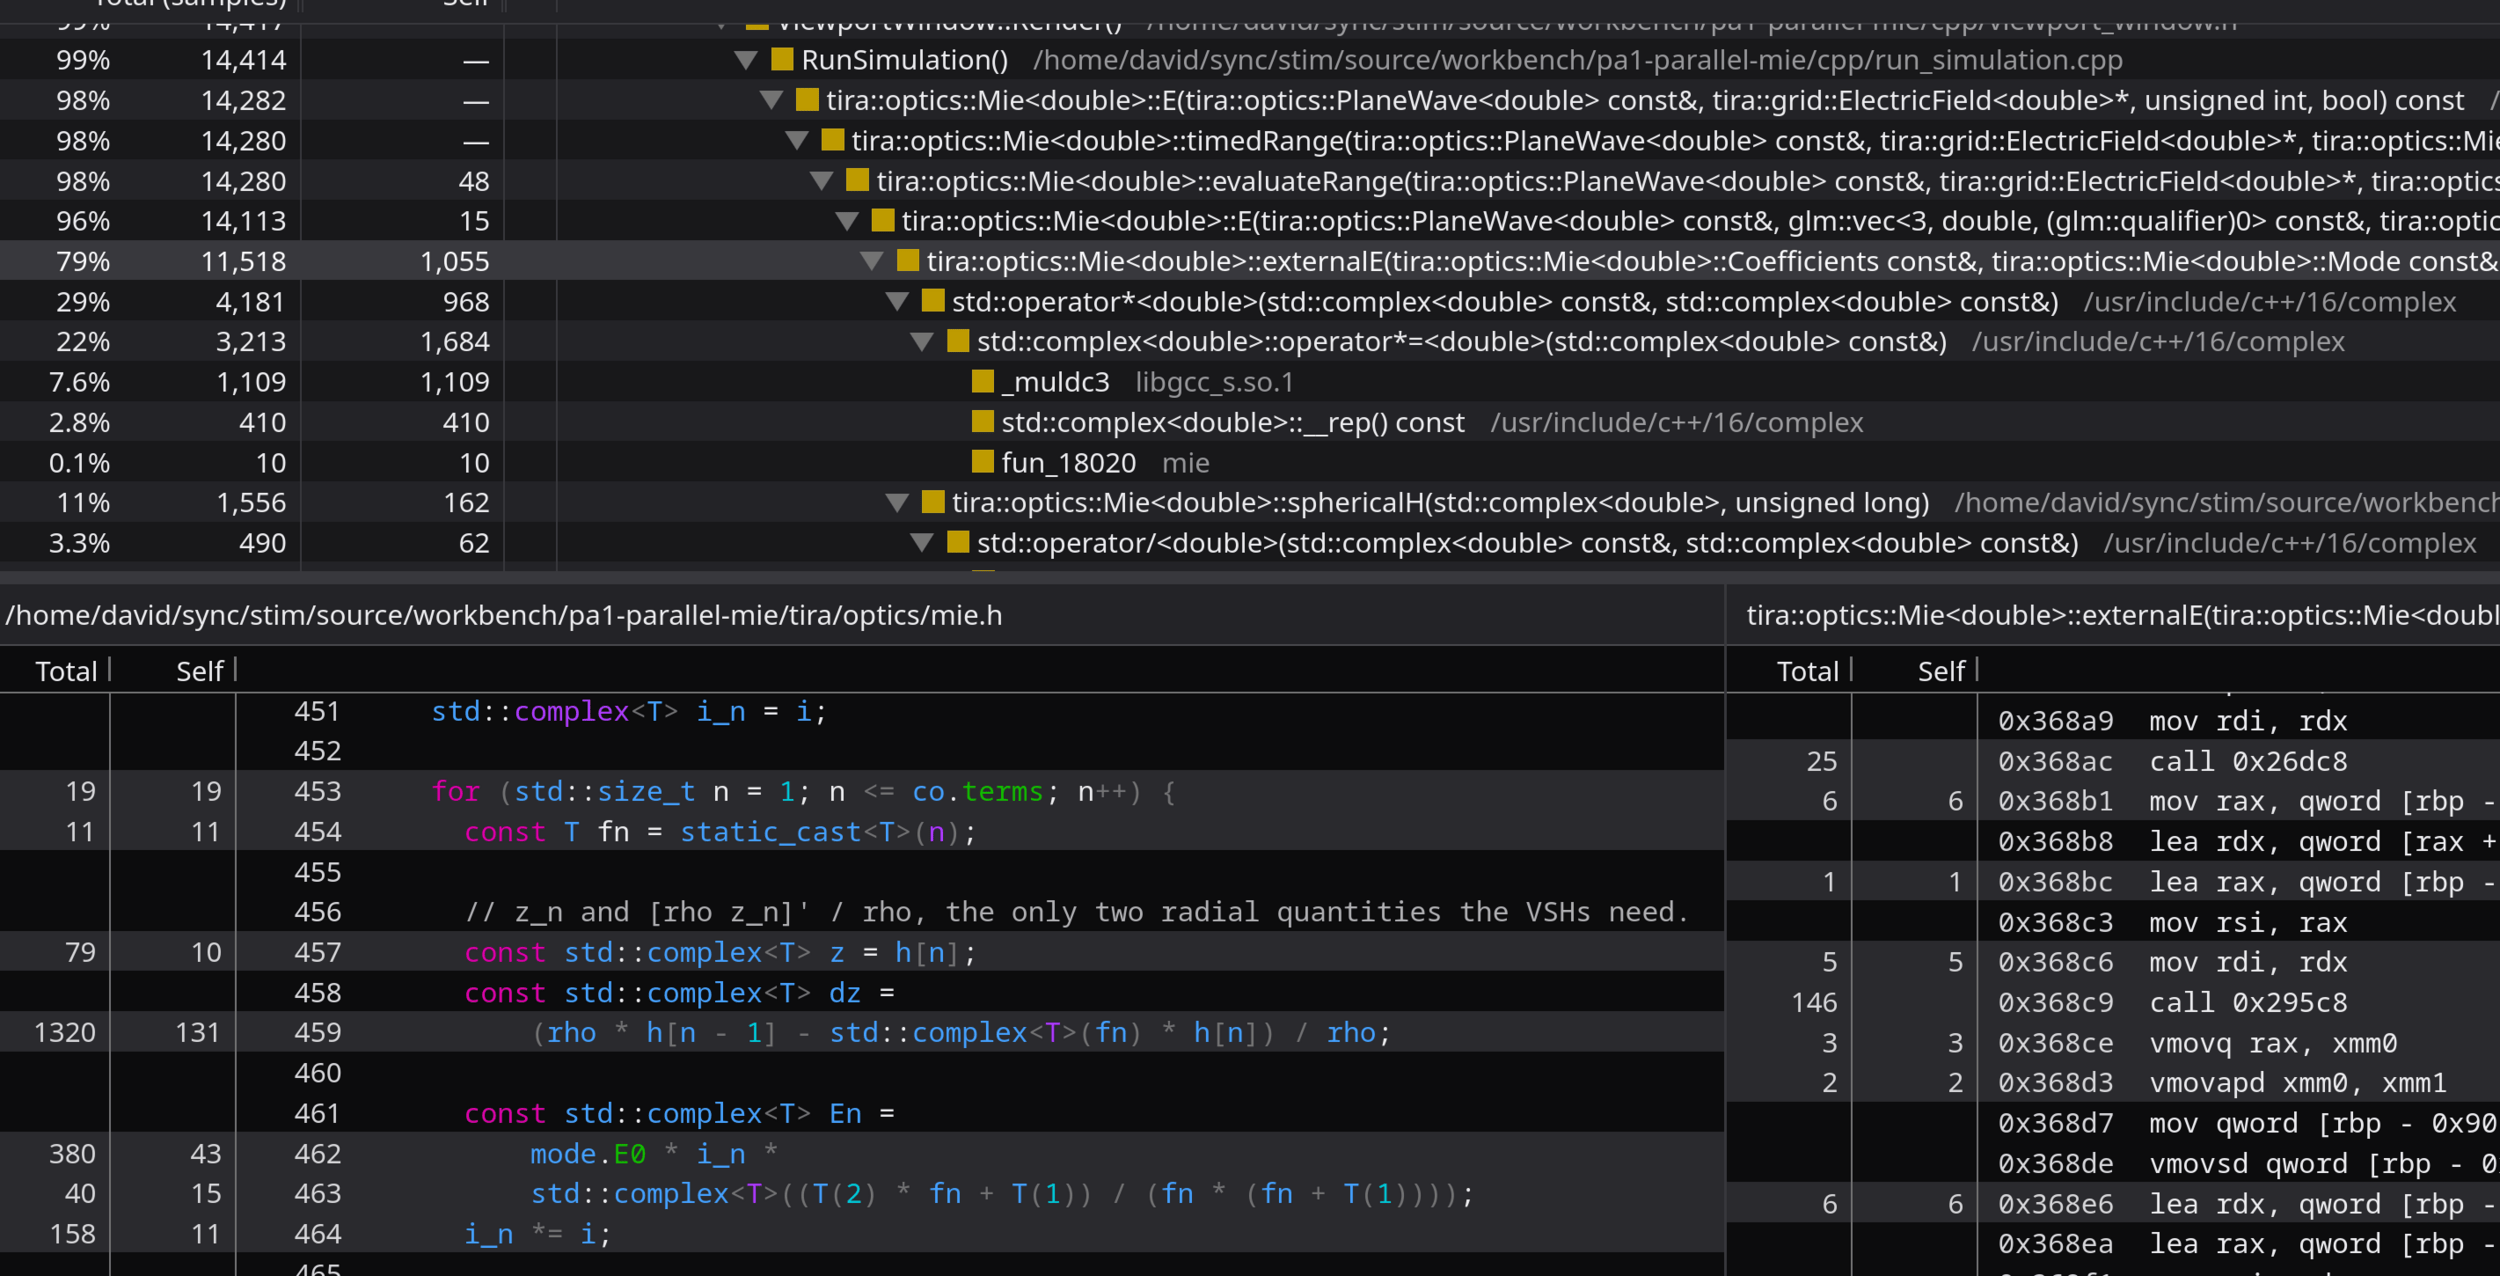
99% of samples are in this function
debug symbols allow correlation between samples and source code
DEMO - samply, Flame Graphs
David Mayerich
STIM Laboratory, University of Houston
B.2 Profiling
By STIM Laboratory