
Adsata
Eyetracking for the web
DEMOCRATISING EYETRACKING – ANALYSING THE 98%
the process of capturing the gaze location within a display,
Eye tracking
extensively used in usability studies, psychology, human-computer interaction, and marketing.
The Problem w/ Modern Eyetrackers
1. The setup and operation of modern eye trackers is time-consuming
2. A specialist is needed to calibrate them and be present throughout the experiment
3. This leads to highly-controlled user studies with artificial tasks and only a small number of participants
4. In addition, their steep price, which rises to tens of thousands of dollars/euros, restricts their use to only a small number of labs that can afford them


The Solution...
democratize eye tracking by using common webcams already present in laptops and desktops.
1. These contributions make eye tracking accessible to everyday users, researchers, and developers.

2. Traditional eye tracking studies that are confined to labs can now
be performed remotely and at scale.

3. Subjects can participate in studies in their everyday environments
which can yield a more naturalistic behavior and lead to more powerful insights.

4. Make eye tracking affordable.
The science behind our approach
Measure coordinates of 3 fiducial markers in facial images of subject captured by camera facing away from screen towards subject.
Map measured coordinates of three fiducial markers to estimated coordinates of estimated gaze targets of subject on screen using reduced multivariate polynomial model.
Optimise estimated coordinates of gaze targets using polynomial optimisation algorithm.
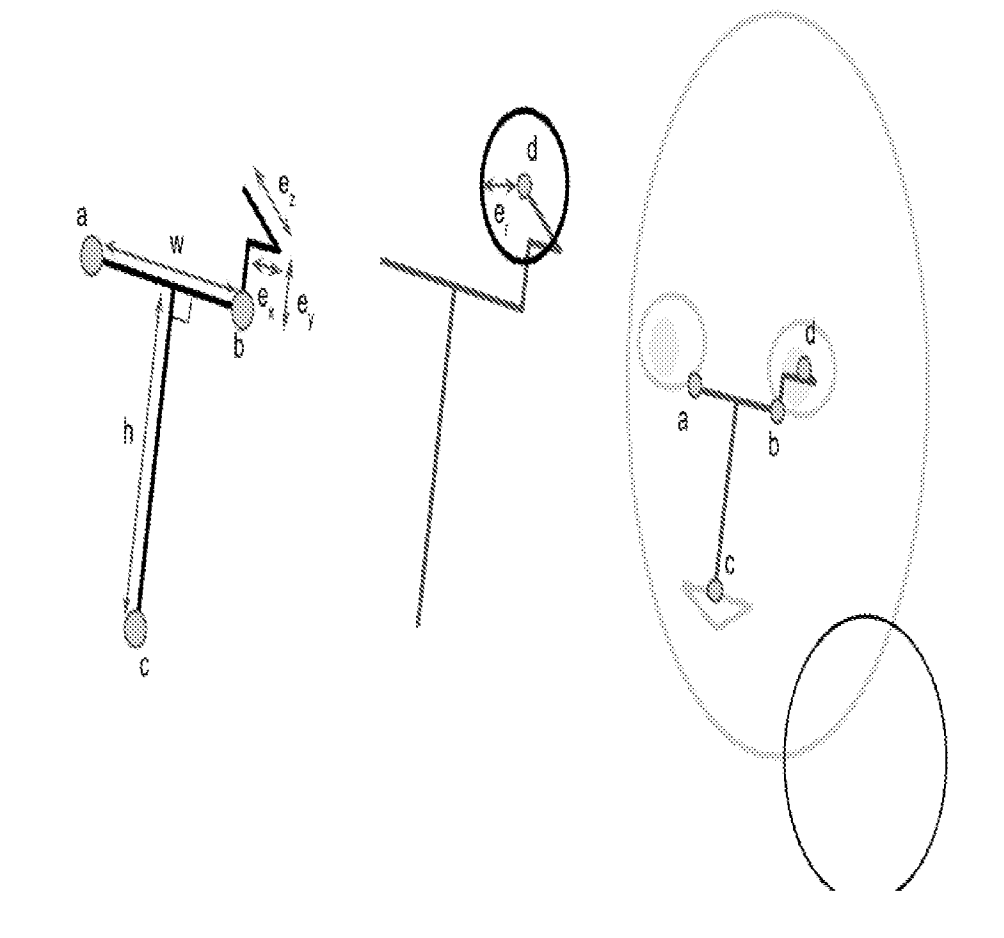
Figure 1: is a schematic diagram of a face-eye model based on three facial landmarks.
Defining Parameters
a. left inner canthus
b. right inner canthus
c. midpoint of the upper lip
e_x.
e_y. Defining eyeball (centre)
e_z.
e_r. eyeball radius
h. model height
w. model width
** Sample rate depends on the maximum frame rate individual webcam can provide.

This is normally between 5 and 25 frames per second. We then aggregate based on 0.2s intervals (5 frames per seconds) just to ensure equal representation of data in aggregation.**
Visual interaction w/ the screen
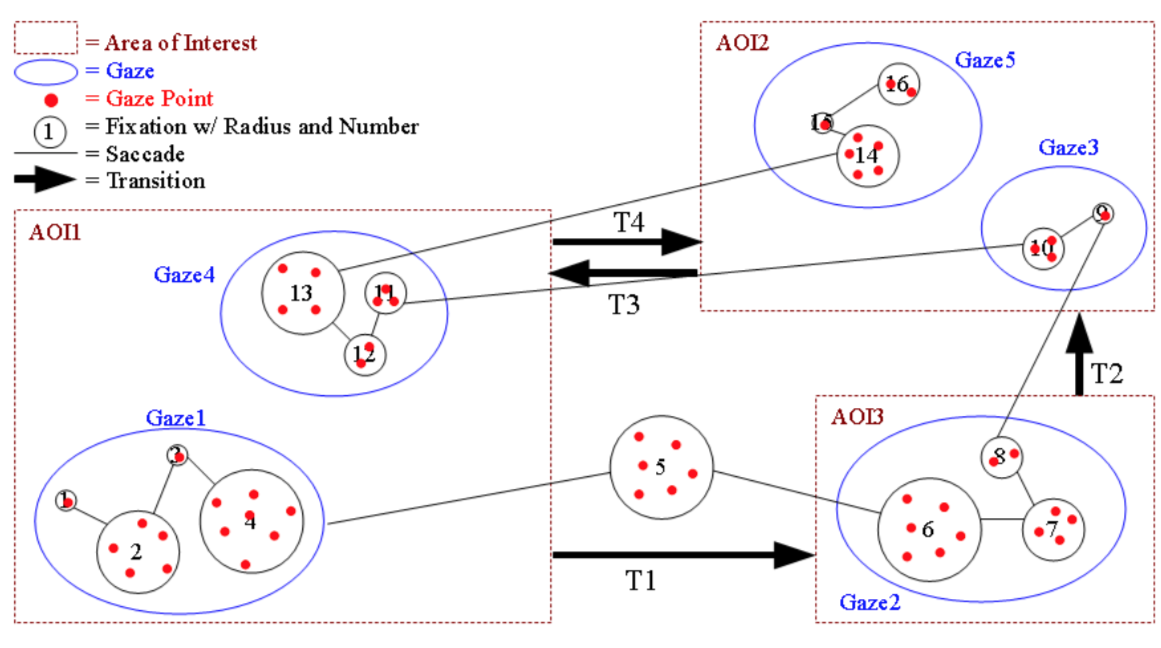
Figure 2: Gaze points are spatially and temporally aggregated into fixations (20-50 pxls). Fixations are connected by saccades and have a certain duration represented by the radius. A temporal order of fixations is a gaze, however, only if the fixations are within an AOI. An AOI is a region of specific interest on the stimulus. A saccade from one AOI to the next is called a transition. A complete sequence of fixations and saccades is called a scanpath.
(Blascheck, T. et al., 2014)
What data do you get?
Qualitative
Quantitative
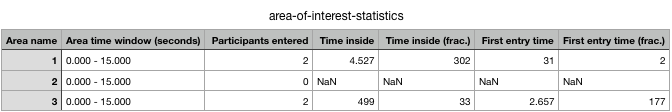
Statistical analysis of AOI mainly provides quantitative results:

     - what percentage of participants see the stim;

     - for how long;

     - in what order;

     - how do the participants interact visually.


2. AOI based visualisation techniques:

        - Timeline AOI Visualisations

        - Relational AOI Visualisations
Visualisation techniques allow analysation at different levels and aspects of the recorded eye tracking data in an explorative and qualitative way.


1) Point-Based Visualisation Techniques

      - Timeline Visualisations

      - Attention maps

      - Scanpath Visualisations

      - Space-Time Visualisation
Data Visualisation in Eye tracking (1950-2010)
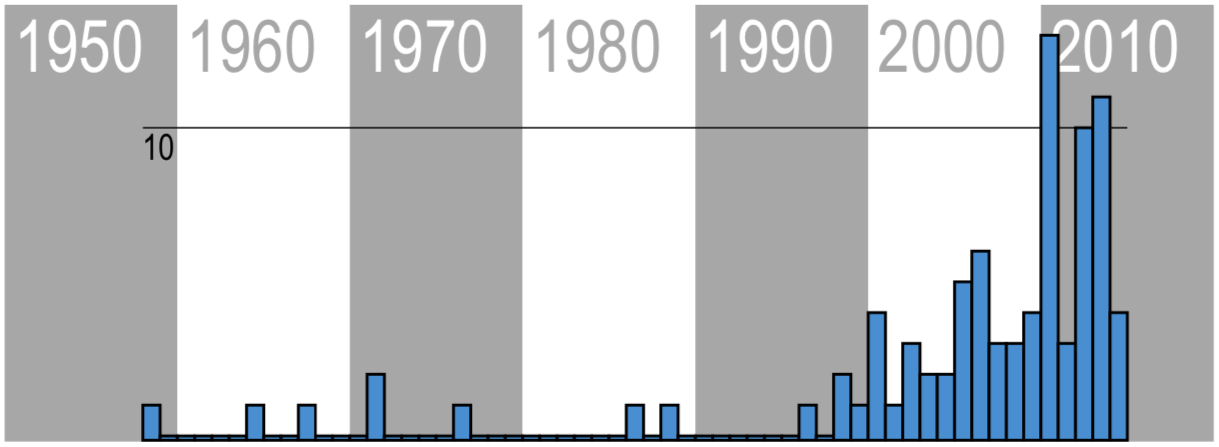
Figure 3: Histogram of all publications relevant for eye tracking data visualisation techniques. The number of published articles, conference papers, and books has strongly increased during the last decade.
(Blascheck, T. et al., 2014)
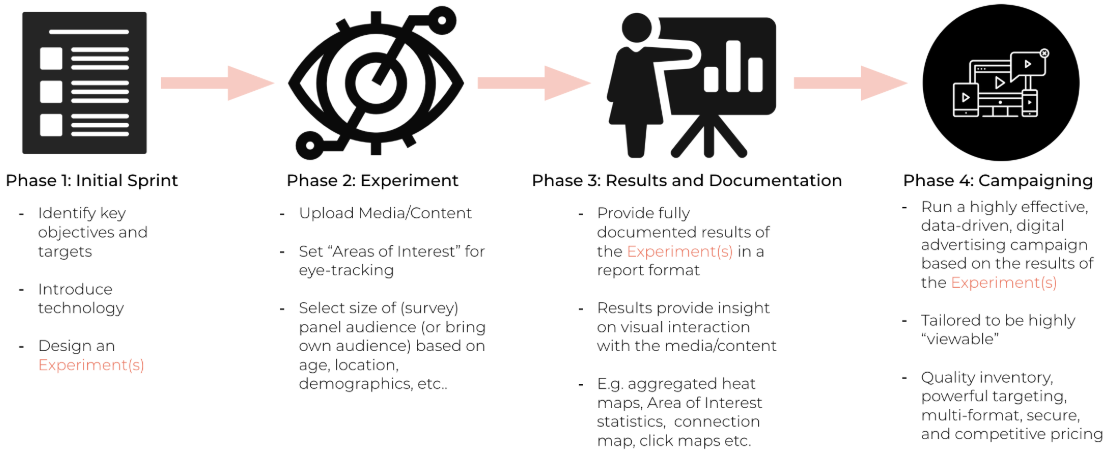
The Workflow
Who can use our data?
Marketers
Agencies
Market Researchers
Designers
UX & Product
Scientific Researchers
-
Improve engagement & conversion -
Get the complete picture -
Save thousands on A/B tests
-
Improve client acquisition with valuable data -
Create designs users love -
Increase ROI
-
Run quick and effective experiments and media tests -
Qualitative/Quantitative analysis -
Get real-time results
-
Optimise designs faster -
Create designs users love -
Prove your design
-
Measure users’ interaction -
Optimise designs faster -
Release features users love
-
Scale your research
-
No need for lab set-up
-
Virtually unlimited participants
Exeriment Results...
Exeriment Results...
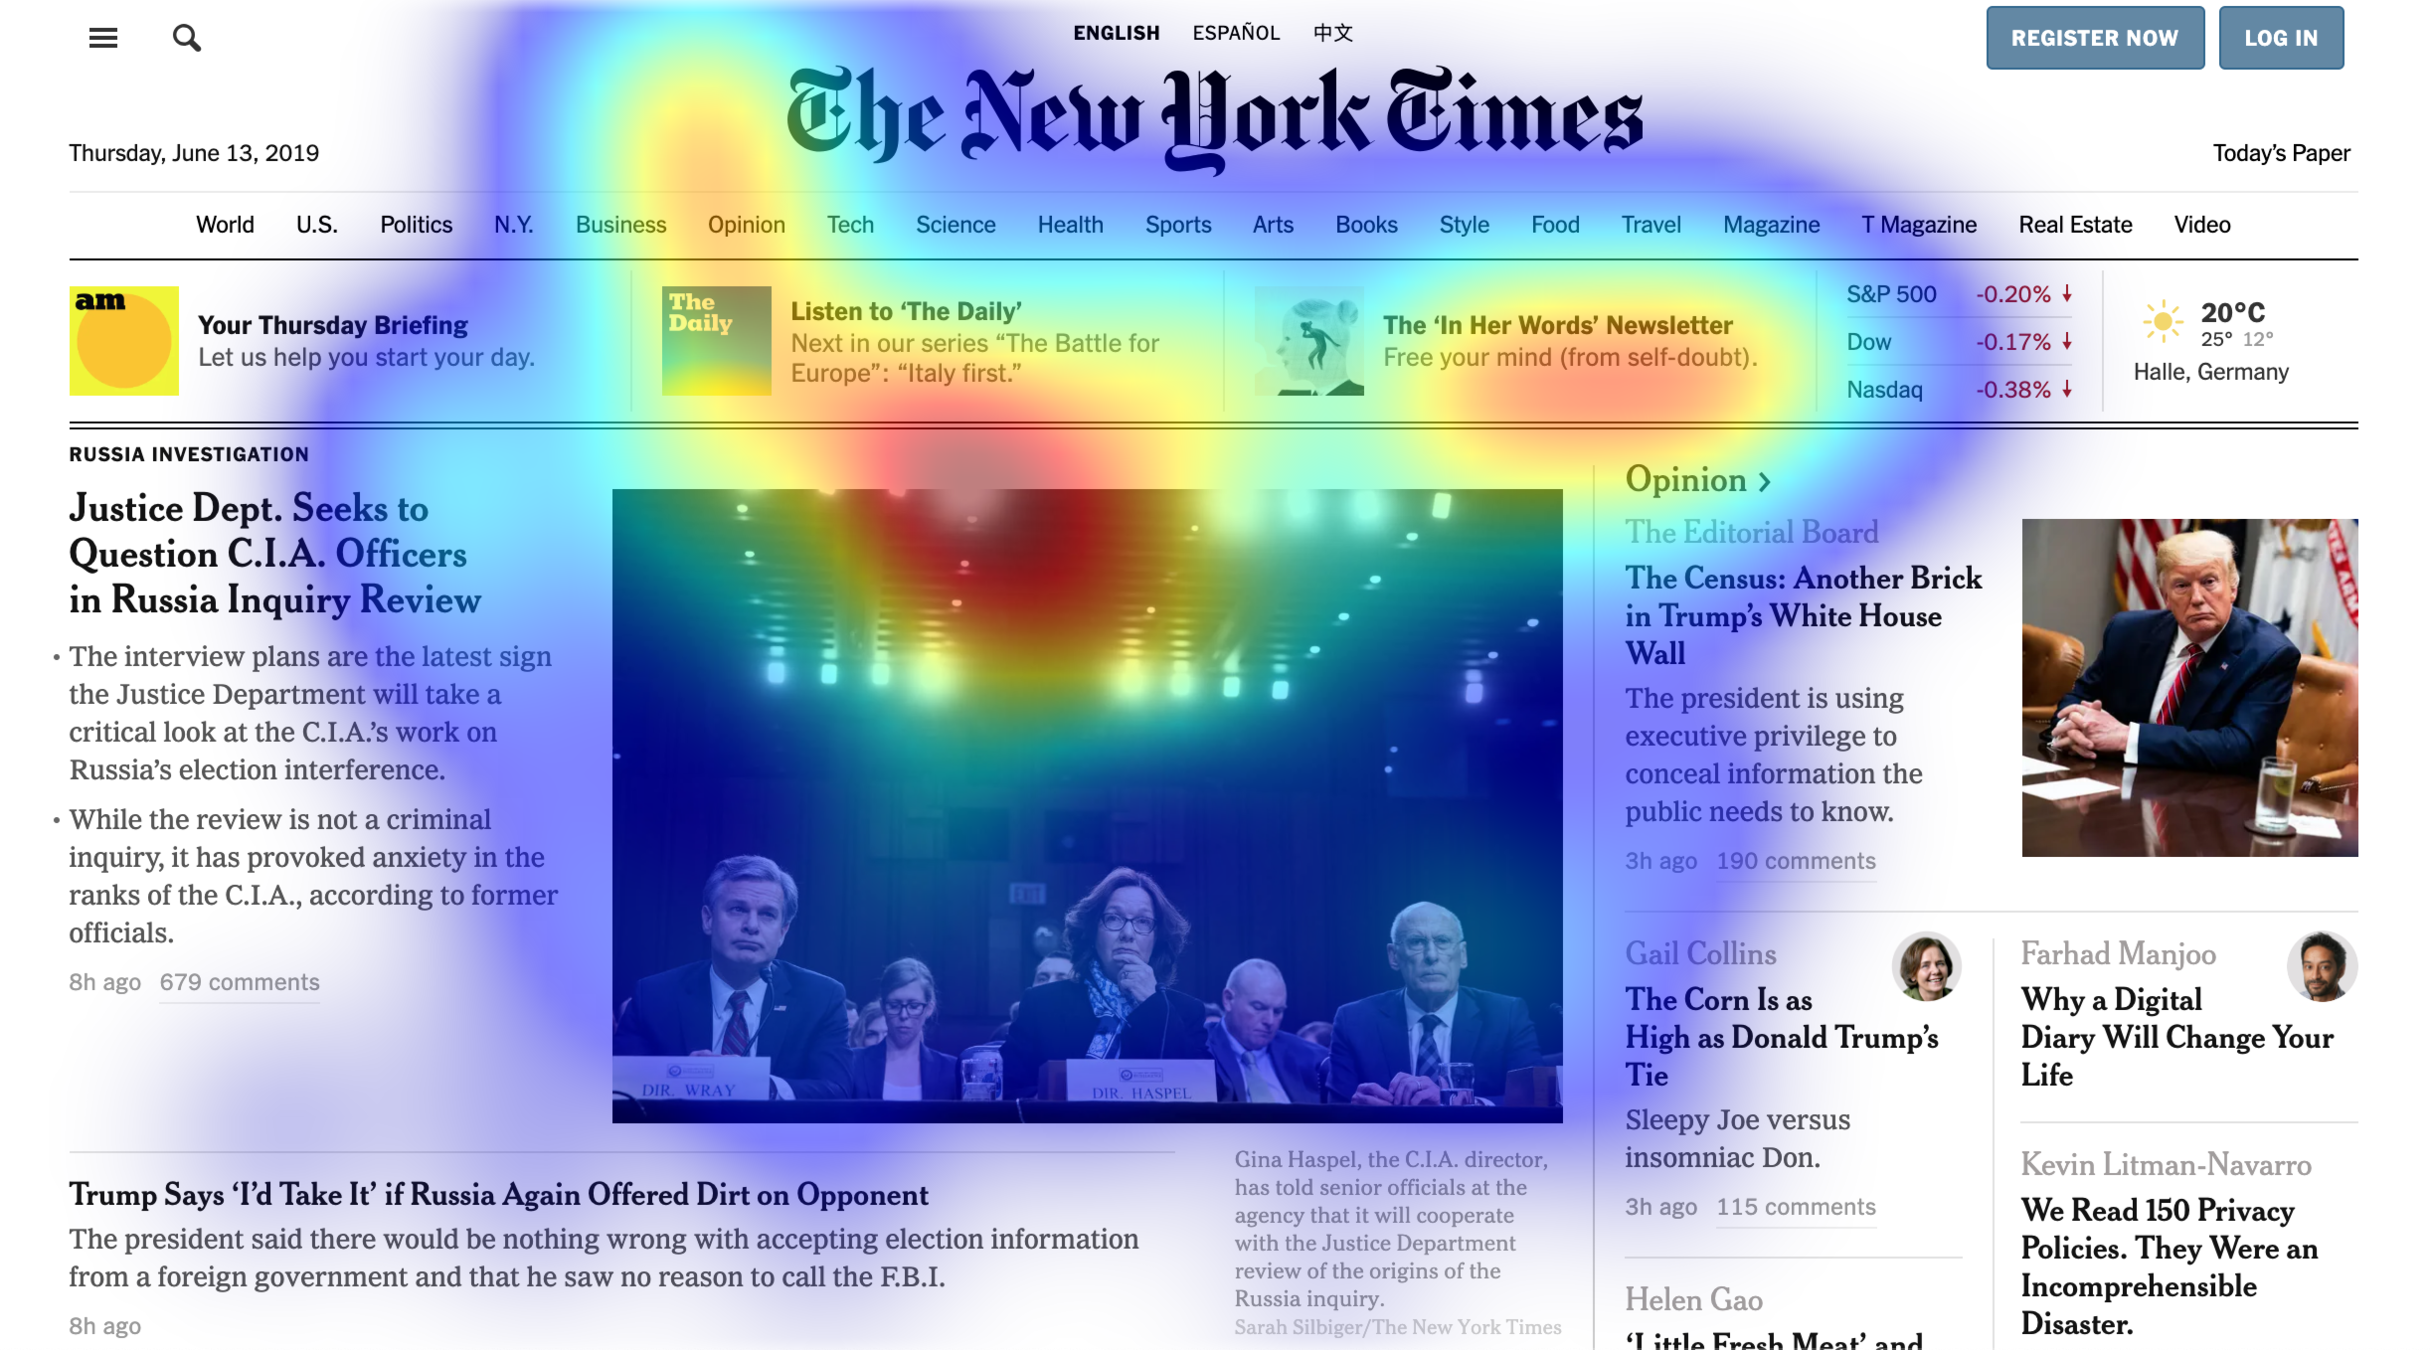
Exeriment Results...
Adsata--Startup Safari
By taimurhk
Adsata--Startup Safari
Slide deck


